Cities with the Highest Percentage of Households Heated without Fuel in Utah
RELATED REPORTS & OPTIONS
Fuel-less Heating
Utah
Compare Cities
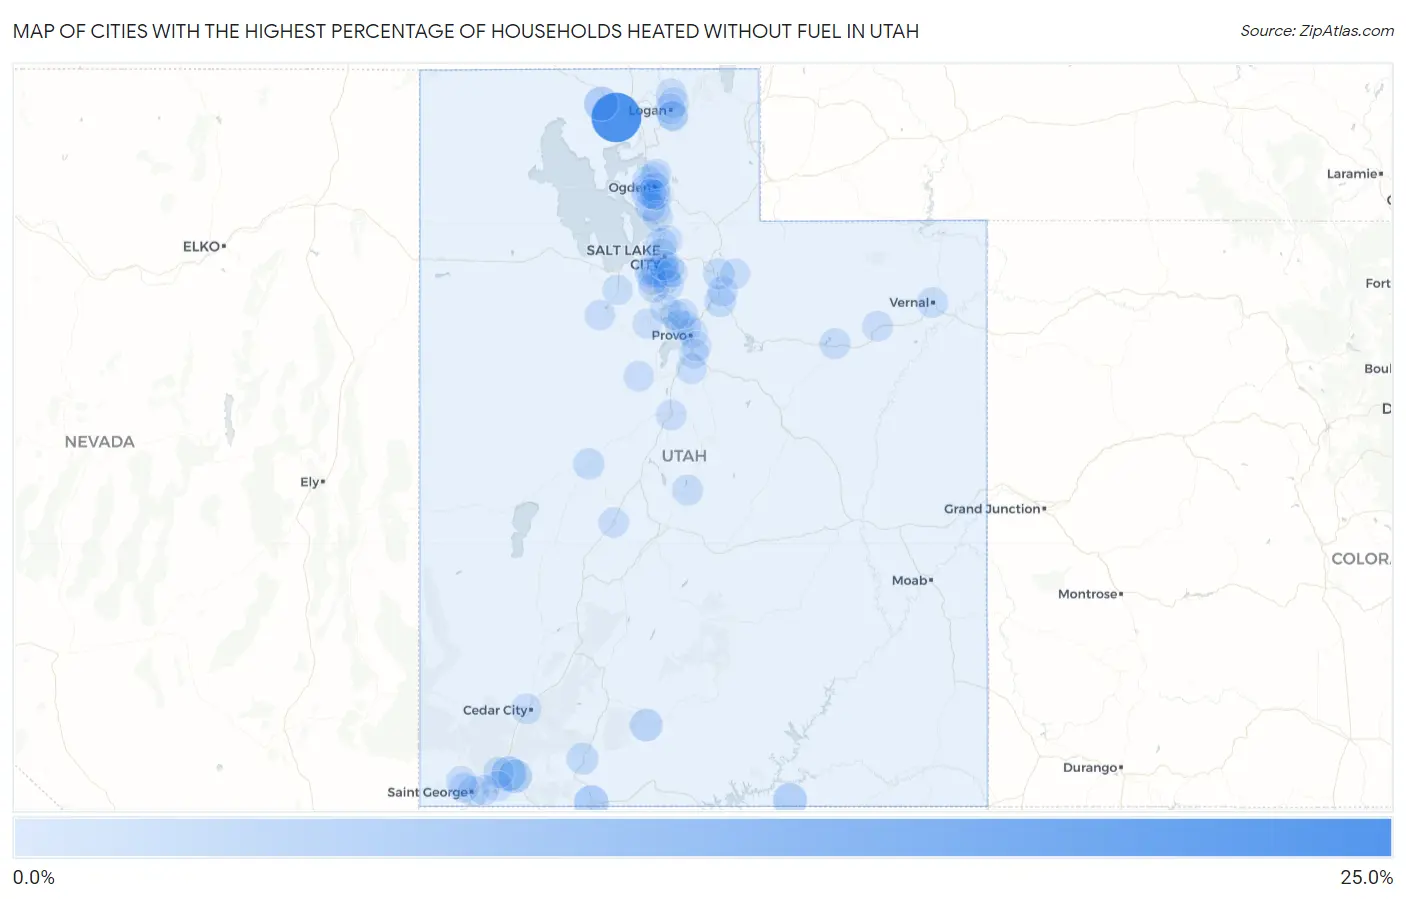
Map of Cities with the Highest Percentage of Households Heated without Fuel in Utah
0.0%
25.0%
Cities with the Highest Percentage of Households Heated without Fuel in Utah
| City | Fuel-less Heating | vs State | vs National | |
| 1. | Thatcher | 21.8% | 0.30%(+21.5)#1 | 1.2%(+20.6)#501 |
| 2. | La Verkin | 5.0% | 0.30%(+4.70)#2 | 1.2%(+3.80)#1,044 |
| 3. | Kanab | 4.6% | 0.30%(+4.30)#3 | 1.2%(+3.40)#1,117 |
| 4. | Howell | 4.4% | 0.30%(+4.10)#4 | 1.2%(+3.20)#1,193 |
| 5. | Navajo Mountain | 3.8% | 0.30%(+3.50)#5 | 1.2%(+2.60)#1,341 |
| 6. | Virgin | 3.7% | 0.30%(+3.40)#6 | 1.2%(+2.50)#1,375 |
| 7. | Cannonville | 2.7% | 0.30%(+2.40)#7 | 1.2%(+1.50)#1,821 |
| 8. | Daniel | 1.7% | 0.30%(+1.40)#8 | 1.2%(+0.500)#2,970 |
| 9. | Glendale | 1.7% | 0.30%(+1.40)#9 | 1.2%(+0.500)#2,989 |
| 10. | Delta | 1.3% | 0.30%(+1.00)#10 | 1.2%(+0.100)#3,773 |
| 11. | Hideout | 1.3% | 0.30%(+1.00)#11 | 1.2%(+0.100)#3,842 |
| 12. | North Salt Lake | 1.2% | 0.30%(+0.900)#12 | 1.2%(=0.000)#3,941 |
| 13. | Marriott Slaterville | 1.2% | 0.30%(+0.900)#13 | 1.2%(=0.000)#4,086 |
| 14. | Leeds | 1.0% | 0.30%(+0.700)#14 | 1.2%(-0.200)#4,834 |
| 15. | Midvale | 0.90% | 0.30%(+0.600)#15 | 1.2%(-0.300)#4,961 |
| 16. | Duchesne | 0.90% | 0.30%(+0.600)#16 | 1.2%(-0.300)#5,211 |
| 17. | Sterling | 0.90% | 0.30%(+0.600)#17 | 1.2%(-0.300)#5,313 |
| 18. | Vernal | 0.80% | 0.30%(+0.500)#18 | 1.2%(-0.400)#5,510 |
| 19. | Taylorsville | 0.70% | 0.30%(+0.400)#19 | 1.2%(-0.500)#5,908 |
| 20. | West Valley City | 0.60% | 0.30%(+0.300)#20 | 1.2%(-0.600)#6,460 |
| 21. | West Haven | 0.60% | 0.30%(+0.300)#21 | 1.2%(-0.600)#6,609 |
| 22. | Smithfield | 0.60% | 0.30%(+0.300)#22 | 1.2%(-0.600)#6,657 |
| 23. | Roosevelt | 0.60% | 0.30%(+0.300)#23 | 1.2%(-0.600)#6,755 |
| 24. | Nephi | 0.60% | 0.30%(+0.300)#24 | 1.2%(-0.600)#6,764 |
| 25. | Woodland Hills | 0.60% | 0.30%(+0.300)#25 | 1.2%(-0.600)#6,977 |
| 26. | Rush Valley | 0.60% | 0.30%(+0.300)#26 | 1.2%(-0.600)#7,073 |
| 27. | Layton | 0.50% | 0.30%(+0.200)#27 | 1.2%(-0.700)#7,151 |
| 28. | Murray | 0.50% | 0.30%(+0.200)#28 | 1.2%(-0.700)#7,194 |
| 29. | Hurricane | 0.50% | 0.30%(+0.200)#29 | 1.2%(-0.700)#7,283 |
| 30. | South Ogden | 0.50% | 0.30%(+0.200)#30 | 1.2%(-0.700)#7,303 |
| 31. | Vineyard | 0.50% | 0.30%(+0.200)#31 | 1.2%(-0.700)#7,351 |
| 32. | Providence | 0.50% | 0.30%(+0.200)#32 | 1.2%(-0.700)#7,412 |
| 33. | Salt Lake City | 0.40% | 0.30%(+0.100)#33 | 1.2%(-0.800)#7,812 |
| 34. | St George | 0.40% | 0.30%(+0.100)#34 | 1.2%(-0.800)#7,830 |
| 35. | Roy | 0.40% | 0.30%(+0.100)#35 | 1.2%(-0.800)#7,905 |
| 36. | Kearns | 0.40% | 0.30%(+0.100)#36 | 1.2%(-0.800)#7,910 |
| 37. | Cedar City | 0.40% | 0.30%(+0.100)#37 | 1.2%(-0.800)#7,911 |
| 38. | Clearfield | 0.40% | 0.30%(+0.100)#38 | 1.2%(-0.800)#7,923 |
| 39. | Washington | 0.40% | 0.30%(+0.100)#39 | 1.2%(-0.800)#7,936 |
| 40. | North Logan | 0.40% | 0.30%(+0.100)#40 | 1.2%(-0.800)#8,093 |
| 41. | Ivins | 0.40% | 0.30%(+0.100)#41 | 1.2%(-0.800)#8,128 |
| 42. | Harrisville | 0.40% | 0.30%(+0.100)#42 | 1.2%(-0.800)#8,166 |
| 43. | Eureka | 0.40% | 0.30%(+0.100)#43 | 1.2%(-0.800)#8,398 |
| 44. | Sandy | 0.30% | 0.30%(=0.000)#44 | 1.2%(-0.900)#8,459 |
| 45. | Ogden | 0.30% | 0.30%(=0.000)#45 | 1.2%(-0.900)#8,463 |
| 46. | South Jordan | 0.30% | 0.30%(=0.000)#46 | 1.2%(-0.900)#8,472 |
| 47. | Logan | 0.30% | 0.30%(=0.000)#47 | 1.2%(-0.900)#8,504 |
| 48. | Tooele | 0.30% | 0.30%(=0.000)#48 | 1.2%(-0.900)#8,547 |
| 49. | Kaysville | 0.30% | 0.30%(=0.000)#49 | 1.2%(-0.900)#8,561 |
| 50. | Heber | 0.30% | 0.30%(=0.000)#50 | 1.2%(-0.900)#8,687 |
| 51. | Washington Terrace | 0.30% | 0.30%(=0.000)#51 | 1.2%(-0.900)#8,814 |
| 52. | Santa Clara | 0.30% | 0.30%(=0.000)#52 | 1.2%(-0.900)#8,875 |
| 53. | Fillmore | 0.30% | 0.30%(=0.000)#53 | 1.2%(-0.900)#8,957 |
| 54. | Kamas | 0.30% | 0.30%(=0.000)#54 | 1.2%(-0.900)#8,965 |
| 55. | Millville | 0.30% | 0.30%(=0.000)#55 | 1.2%(-0.900)#8,995 |
| 56. | West Jordan | 0.20% | 0.30%(-0.100)#56 | 1.2%(-1.000)#9,078 |
| 57. | Millcreek | 0.20% | 0.30%(-0.100)#57 | 1.2%(-1.000)#9,109 |
| 58. | Eagle Mountain | 0.20% | 0.30%(-0.100)#58 | 1.2%(-1.000)#9,143 |
| 59. | Holladay | 0.20% | 0.30%(-0.100)#59 | 1.2%(-1.000)#9,191 |
| 60. | Provo | 0.10% | 0.30%(-0.200)#60 | 1.2%(-1.10)#9,562 |
| 61. | Orem | 0.10% | 0.30%(-0.200)#61 | 1.2%(-1.10)#9,571 |
| 62. | Lehi | 0.10% | 0.30%(-0.200)#62 | 1.2%(-1.10)#9,573 |
| 63. | Bountiful | 0.10% | 0.30%(-0.200)#63 | 1.2%(-1.10)#9,602 |
| 64. | Spanish Fork | 0.10% | 0.30%(-0.200)#64 | 1.2%(-1.10)#9,605 |
| 65. | Pleasant Grove | 0.10% | 0.30%(-0.200)#65 | 1.2%(-1.10)#9,619 |
| 66. | Springville | 0.10% | 0.30%(-0.200)#66 | 1.2%(-1.10)#9,631 |
| 67. | American Fork | 0.10% | 0.30%(-0.200)#67 | 1.2%(-1.10)#9,641 |
| 68. | South Salt Lake | 0.10% | 0.30%(-0.200)#68 | 1.2%(-1.10)#9,669 |
| 69. | North Ogden | 0.10% | 0.30%(-0.200)#69 | 1.2%(-1.10)#9,707 |
| 70. | Riverdale | 0.10% | 0.30%(-0.200)#70 | 1.2%(-1.10)#9,810 |
Common Questions
What are the Top 10 Cities with the Highest Percentage of Households Heated without Fuel in Utah?
Top 10 Cities with the Highest Percentage of Households Heated without Fuel in Utah are:
#1
21.8%
#2
5.0%
#3
4.6%
#4
4.4%
#5
3.8%
#6
3.7%
#7
2.7%
#8
1.7%
#9
1.7%
#10
1.3%
What city has the Highest Percentage of Households Heated without Fuel in Utah?
Thatcher has the Highest Percentage of Households Heated without Fuel in Utah with 21.8%.
What is the Percentage of Households Heated without Fuel in the State of Utah?
Percentage of Households Heated without Fuel in Utah is 0.30%.
What is the Percentage of Households Heated without Fuel in the United States?
Percentage of Households Heated without Fuel in the United States is 1.2%.