Knightsen, CA Map & Demographics
Knightsen Map
Knightsen Overview
$50,613
PER CAPITA INCOME
$133,269
AVG FAMILY INCOME
$128,750
AVG HOUSEHOLD INCOME
52.7%
WAGE / INCOME GAP [ % ]
47.3¢/ $1
WAGE / INCOME GAP [ $ ]
0.35
INEQUALITY / GINI INDEX
1,646
TOTAL POPULATION
859
MALE POPULATION
787
FEMALE POPULATION
109.15
MALES / 100 FEMALES
91.62
FEMALES / 100 MALES
39.5
MEDIAN AGE
3.4
AVG FAMILY SIZE
3.0
AVG HOUSEHOLD SIZE
811
LABOR FORCE [ PEOPLE ]
59.8%
PERCENT IN LABOR FORCE
6.5%
UNEMPLOYMENT RATE
Knightsen Zip Codes
Income in Knightsen
Income Overview in Knightsen
Per Capita Income in Knightsen is $50,613, while median incomes of families and households are $133,269 and $128,750 respectively.
| Characteristic | Number | Measure |
| Per Capita Income | 1,646 | $50,613 |
| Median Family Income | 434 | $133,269 |
| Mean Family Income | 434 | $153,124 |
| Median Household Income | 556 | $128,750 |
| Mean Household Income | 556 | $145,750 |
| Income Deficit | 434 | $0 |
| Wage / Income Gap (%) | 1,646 | 52.65% |
| Wage / Income Gap ($) | 1,646 | 47.35¢ per $1 |
| Gini / Inequality Index | 1,646 | 0.35 |
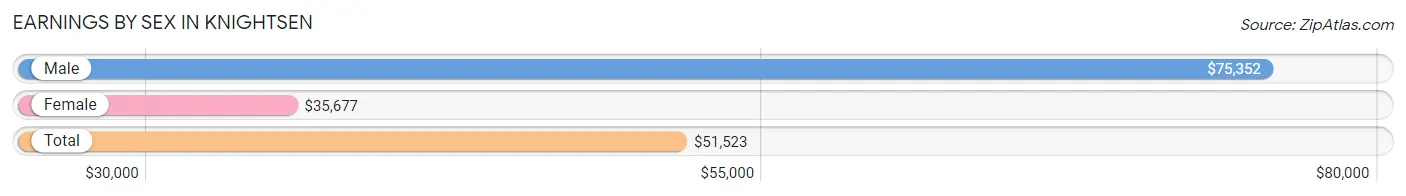
Earnings by Sex in Knightsen
Average Earnings in Knightsen are $51,523, $75,352 for men and $35,677 for women, a difference of 52.6%.
| Sex | Number | Average Earnings |
| Male | 495 (62.7%) | $75,352 |
| Female | 295 (37.3%) | $35,677 |
| Total | 790 (100.0%) | $51,523 |
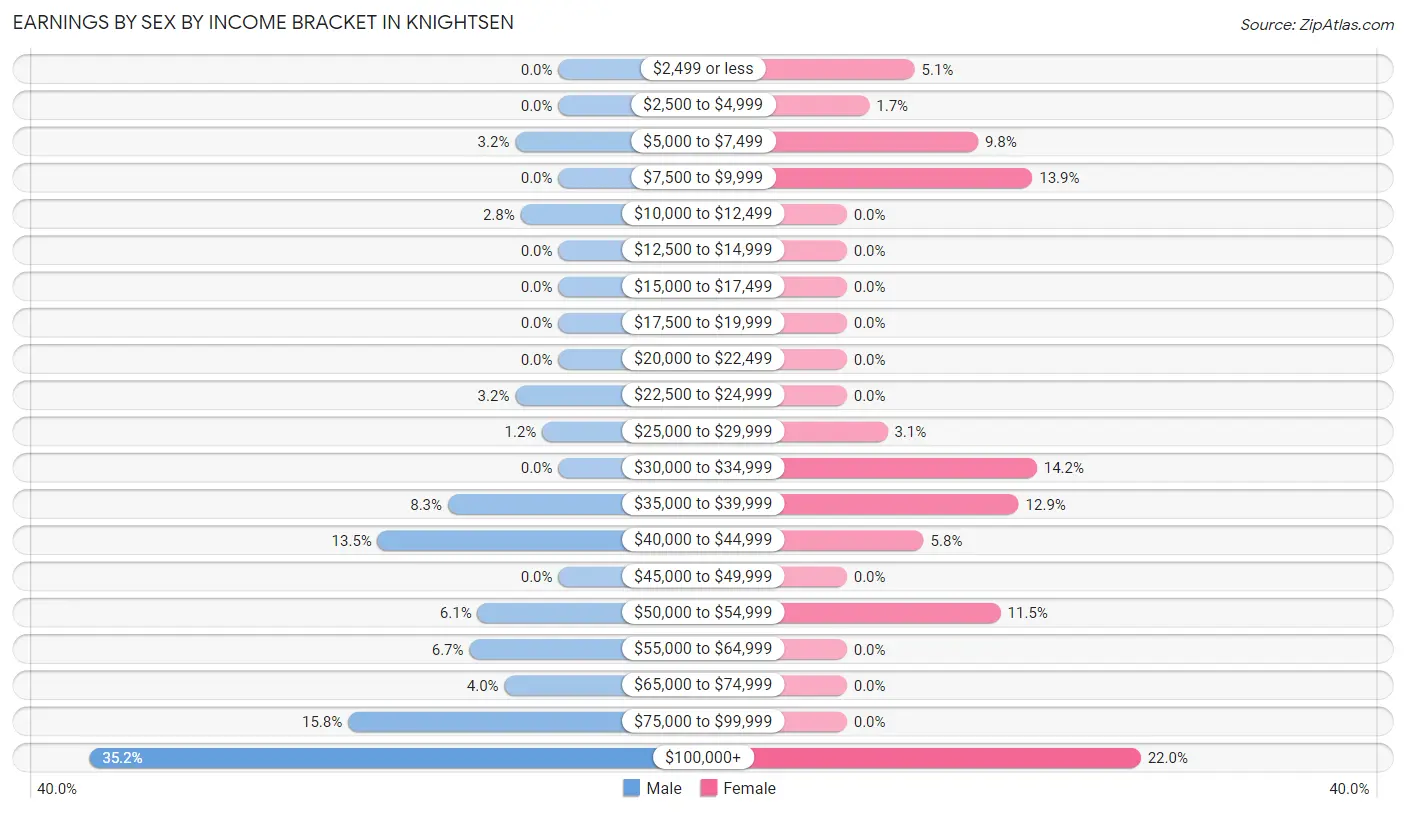
Earnings by Sex by Income Bracket in Knightsen
The most common earnings brackets in Knightsen are $100,000+ for men (174 | 35.1%) and $100,000+ for women (65 | 22.0%).
| Income | Male | Female |
| $2,499 or less | 0 (0.0%) | 15 (5.1%) |
| $2,500 to $4,999 | 0 (0.0%) | 5 (1.7%) |
| $5,000 to $7,499 | 16 (3.2%) | 29 (9.8%) |
| $7,500 to $9,999 | 0 (0.0%) | 41 (13.9%) |
| $10,000 to $12,499 | 14 (2.8%) | 0 (0.0%) |
| $12,500 to $14,999 | 0 (0.0%) | 0 (0.0%) |
| $15,000 to $17,499 | 0 (0.0%) | 0 (0.0%) |
| $17,500 to $19,999 | 0 (0.0%) | 0 (0.0%) |
| $20,000 to $22,499 | 0 (0.0%) | 0 (0.0%) |
| $22,500 to $24,999 | 16 (3.2%) | 0 (0.0%) |
| $25,000 to $29,999 | 6 (1.2%) | 9 (3.0%) |
| $30,000 to $34,999 | 0 (0.0%) | 42 (14.2%) |
| $35,000 to $39,999 | 41 (8.3%) | 38 (12.9%) |
| $40,000 to $44,999 | 67 (13.5%) | 17 (5.8%) |
| $45,000 to $49,999 | 0 (0.0%) | 0 (0.0%) |
| $50,000 to $54,999 | 30 (6.1%) | 34 (11.5%) |
| $55,000 to $64,999 | 33 (6.7%) | 0 (0.0%) |
| $65,000 to $74,999 | 20 (4.0%) | 0 (0.0%) |
| $75,000 to $99,999 | 78 (15.8%) | 0 (0.0%) |
| $100,000+ | 174 (35.1%) | 65 (22.0%) |
| Total | 495 (100.0%) | 295 (100.0%) |
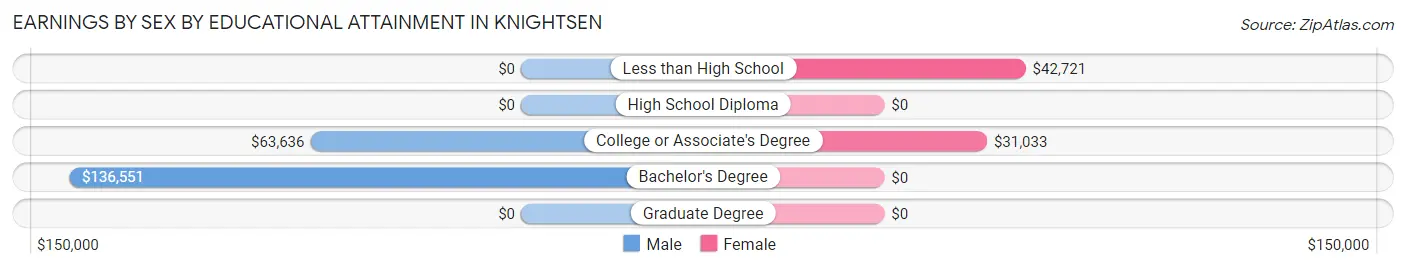
Earnings by Sex by Educational Attainment in Knightsen
Average earnings in Knightsen are $76,523 for men and $36,979 for women, a difference of 51.7%. Men with an educational attainment of bachelor's degree enjoy the highest average annual earnings of $136,551, while those with college or associate's degree education earn the least with $63,636. Women with an educational attainment of less than high school earn the most with the average annual earnings of $42,721, while those with college or associate's degree education have the smallest earnings of $31,033.
| Educational Attainment | Male Income | Female Income |
| Less than High School | - | - |
| High School Diploma | - | - |
| College or Associate's Degree | $63,636 | $31,033 |
| Bachelor's Degree | $136,551 | $0 |
| Graduate Degree | - | - |
| Total | $76,523 | $36,979 |
Family Income in Knightsen
Family Income Brackets in Knightsen
According to the Knightsen family income data, there are 122 families falling into the $100,000 to $149,999 income range, which is the most common income bracket and makes up 28.1% of all families.
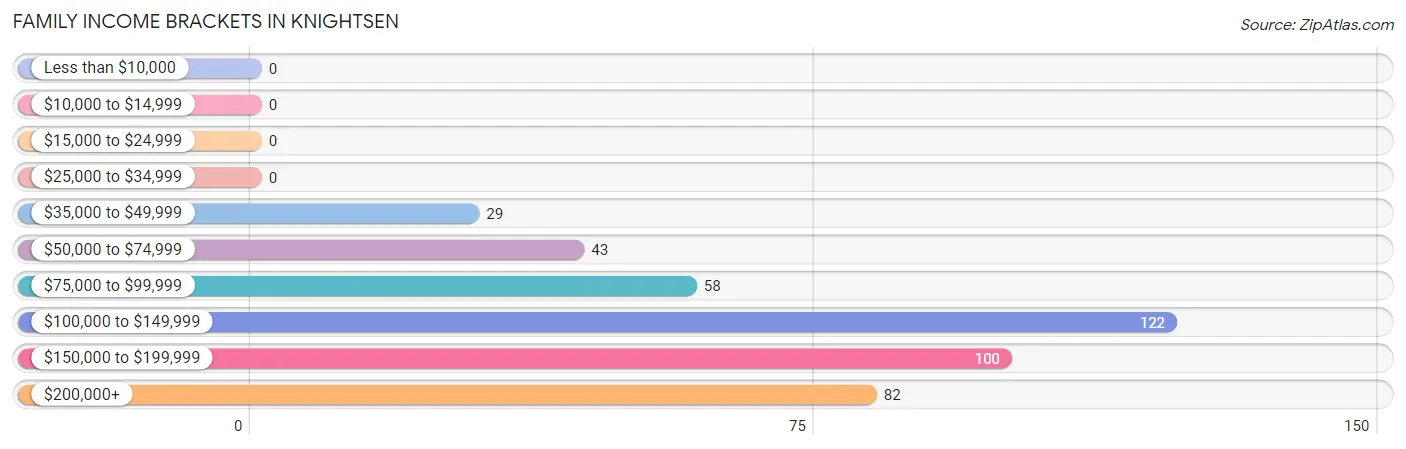
| Income Bracket | # Families | % Families |
| Less than $10,000 | 0 | 0.0% |
| $10,000 to $14,999 | 0 | 0.0% |
| $15,000 to $24,999 | 0 | 0.0% |
| $25,000 to $34,999 | 0 | 0.0% |
| $35,000 to $49,999 | 29 | 6.7% |
| $50,000 to $74,999 | 43 | 9.9% |
| $75,000 to $99,999 | 58 | 13.4% |
| $100,000 to $149,999 | 122 | 28.1% |
| $150,000 to $199,999 | 100 | 23.0% |
| $200,000+ | 82 | 18.9% |
Family Income by Famaliy Size in Knightsen
4-person families (172 | 39.6%) account for the highest median family income in Knightsen with $166,389 per family, while 2-person families (175 | 40.3%) have the highest median income of $43,599 per family member.
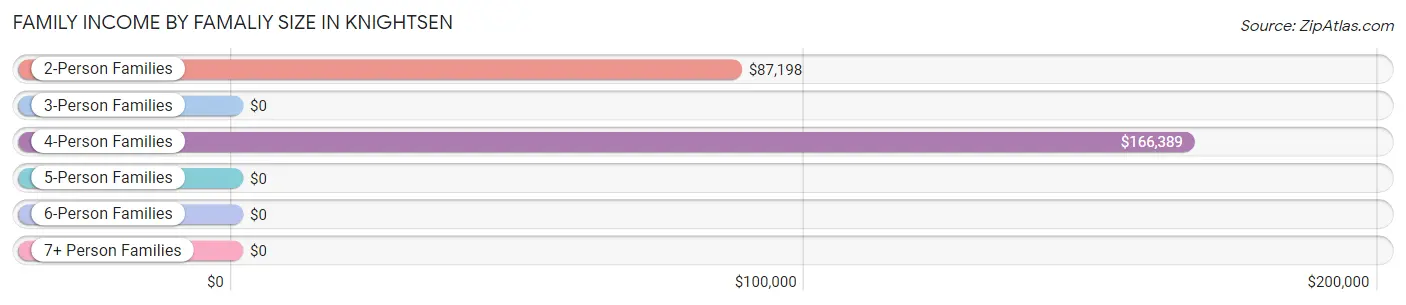
| Income Bracket | # Families | Median Income |
| 2-Person Families | 175 (40.3%) | $87,198 |
| 3-Person Families | 38 (8.8%) | $0 |
| 4-Person Families | 172 (39.6%) | $166,389 |
| 5-Person Families | 17 (3.9%) | $0 |
| 6-Person Families | 0 (0.0%) | $0 |
| 7+ Person Families | 32 (7.4%) | $0 |
| Total | 434 (100.0%) | $133,269 |
Family Income by Number of Earners in Knightsen
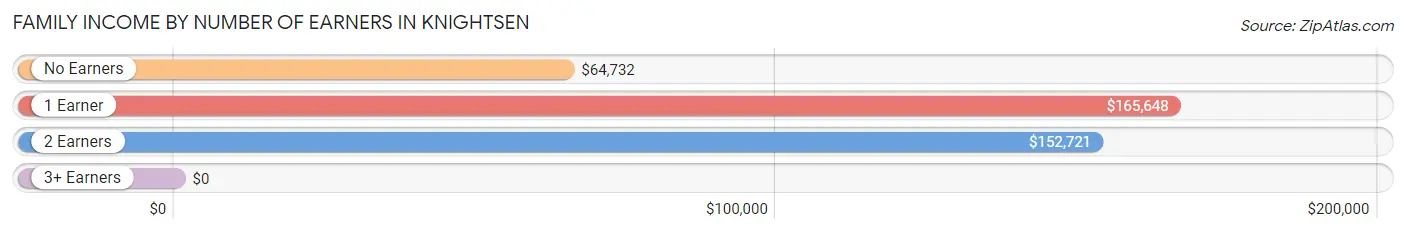
| Number of Earners | # Families | Median Income |
| No Earners | 83 (19.1%) | $64,732 |
| 1 Earner | 80 (18.4%) | $165,648 |
| 2 Earners | 223 (51.4%) | $152,721 |
| 3+ Earners | 48 (11.1%) | $0 |
| Total | 434 (100.0%) | $133,269 |
Household Income in Knightsen
Household Income Brackets in Knightsen
With 136 households falling in the category, the $150,000 to $199,999 income range is the most frequent in Knightsen, accounting for 24.5% of all households.
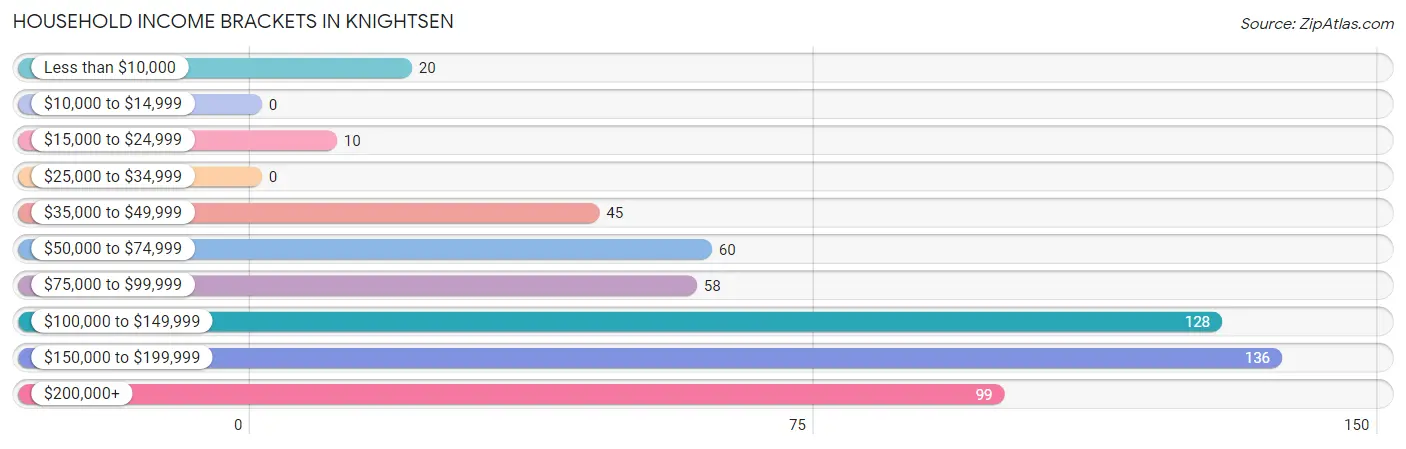
| Income Bracket | # Households | % Households |
| Less than $10,000 | 20 | 3.6% |
| $10,000 to $14,999 | 0 | 0.0% |
| $15,000 to $24,999 | 10 | 1.8% |
| $25,000 to $34,999 | 0 | 0.0% |
| $35,000 to $49,999 | 45 | 8.1% |
| $50,000 to $74,999 | 60 | 10.8% |
| $75,000 to $99,999 | 58 | 10.4% |
| $100,000 to $149,999 | 128 | 23.0% |
| $150,000 to $199,999 | 136 | 24.5% |
| $200,000+ | 99 | 17.8% |
Household Income by Householder Age in Knightsen
The median household income in Knightsen is $128,750, with the highest median household income of $165,648 found in the 25 to 44 years age bracket for the primary householder. A total of 108 households (19.4%) fall into this category.
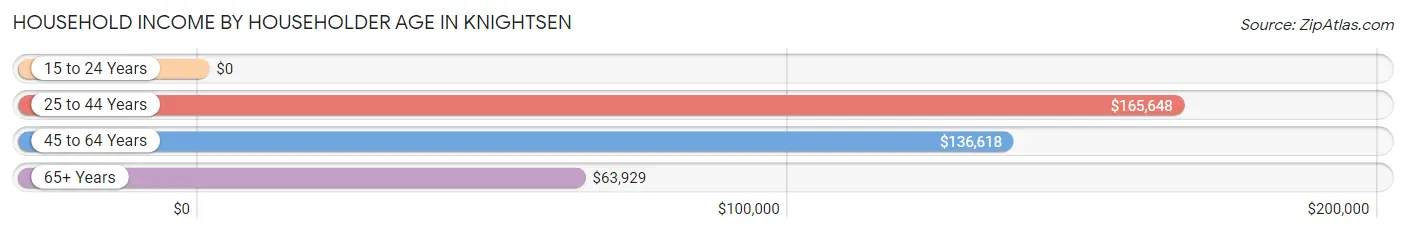
| Income Bracket | # Households | Median Income |
| 15 to 24 Years | 0 (0.0%) | $0 |
| 25 to 44 Years | 108 (19.4%) | $165,648 |
| 45 to 64 Years | 330 (59.4%) | $136,618 |
| 65+ Years | 118 (21.2%) | $63,929 |
| Total | 556 (100.0%) | $128,750 |
Poverty in Knightsen
Income Below Poverty by Sex and Age in Knightsen
With 2.3% poverty level for males and 4.6% for females among the residents of Knightsen, 18 to 24 year old males and 25 to 34 year old females are the most vulnerable to poverty, with 14 males (46.7%) and 16 females (16.0%) in their respective age groups living below the poverty level.
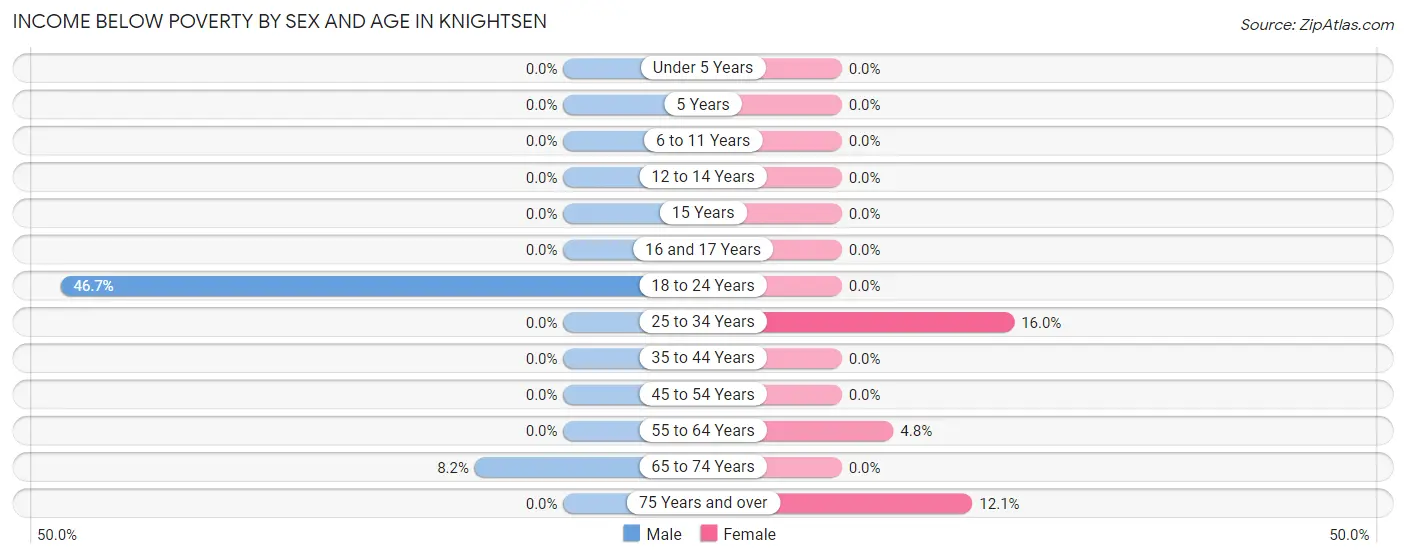
| Age Bracket | Male | Female |
| Under 5 Years | 0 (0.0%) | 0 (0.0%) |
| 5 Years | 0 (0.0%) | 0 (0.0%) |
| 6 to 11 Years | 0 (0.0%) | 0 (0.0%) |
| 12 to 14 Years | 0 (0.0%) | 0 (0.0%) |
| 15 Years | 0 (0.0%) | 0 (0.0%) |
| 16 and 17 Years | 0 (0.0%) | 0 (0.0%) |
| 18 to 24 Years | 14 (46.7%) | 0 (0.0%) |
| 25 to 34 Years | 0 (0.0%) | 16 (16.0%) |
| 35 to 44 Years | 0 (0.0%) | 0 (0.0%) |
| 45 to 54 Years | 0 (0.0%) | 0 (0.0%) |
| 55 to 64 Years | 0 (0.0%) | 8 (4.8%) |
| 65 to 74 Years | 6 (8.2%) | 0 (0.0%) |
| 75 Years and over | 0 (0.0%) | 12 (12.1%) |
| Total | 20 (2.3%) | 36 (4.6%) |
Income Above Poverty by Sex and Age in Knightsen
According to the poverty statistics in Knightsen, males aged under 5 years and females aged under 5 years are the age groups that are most secure financially, with 100.0% of males and 100.0% of females in these age groups living above the poverty line.
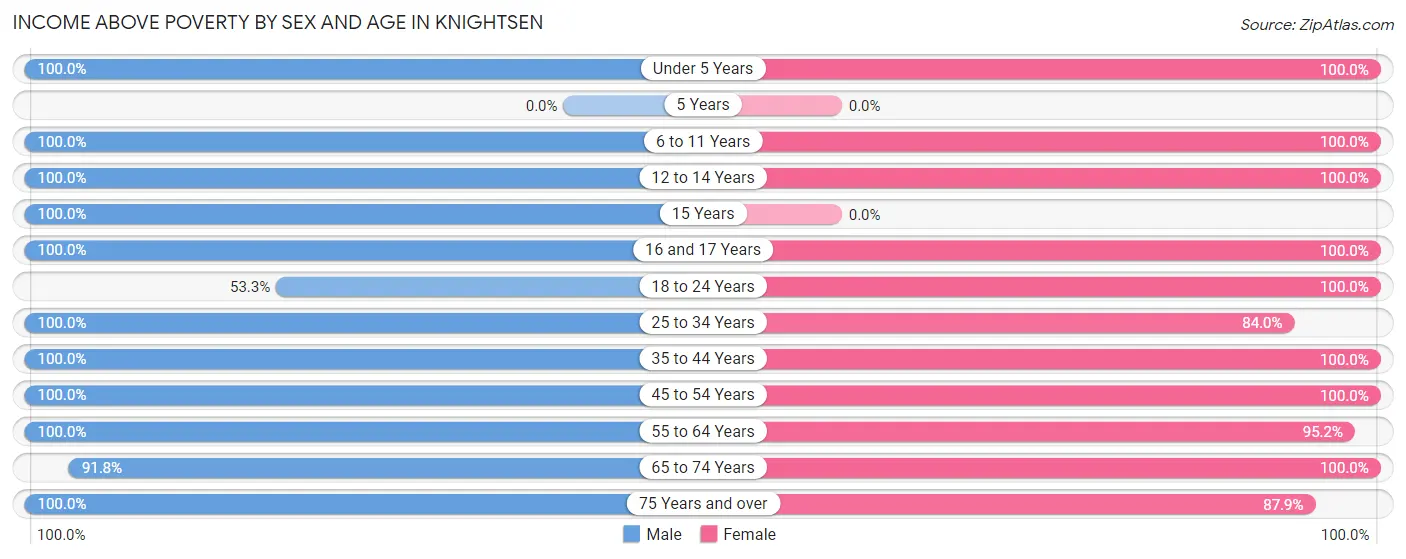
| Age Bracket | Male | Female |
| Under 5 Years | 144 (100.0%) | 62 (100.0%) |
| 5 Years | 0 (0.0%) | 0 (0.0%) |
| 6 to 11 Years | 10 (100.0%) | 56 (100.0%) |
| 12 to 14 Years | 5 (100.0%) | 6 (100.0%) |
| 15 Years | 6 (100.0%) | 0 (0.0%) |
| 16 and 17 Years | 15 (100.0%) | 56 (100.0%) |
| 18 to 24 Years | 16 (53.3%) | 36 (100.0%) |
| 25 to 34 Years | 132 (100.0%) | 84 (84.0%) |
| 35 to 44 Years | 122 (100.0%) | 80 (100.0%) |
| 45 to 54 Years | 149 (100.0%) | 69 (100.0%) |
| 55 to 64 Years | 144 (100.0%) | 159 (95.2%) |
| 65 to 74 Years | 67 (91.8%) | 56 (100.0%) |
| 75 Years and over | 29 (100.0%) | 87 (87.9%) |
| Total | 839 (97.7%) | 751 (95.4%) |
Income Below Poverty Among Married-Couple Families in Knightsen
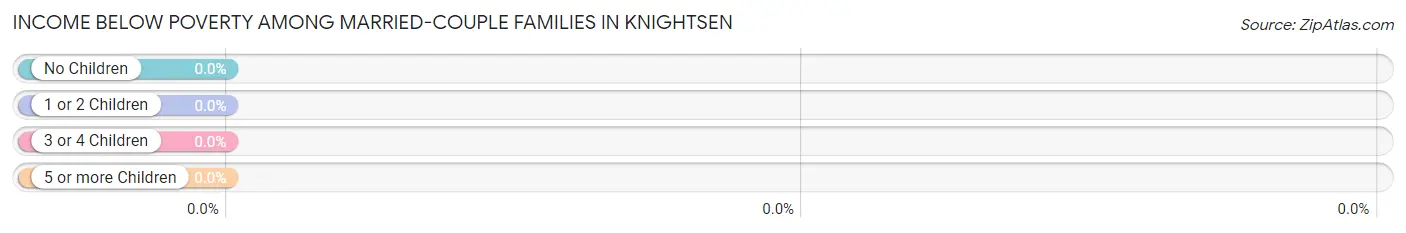
| Children | Above Poverty | Below Poverty |
| No Children | 235 (100.0%) | 0 (0.0%) |
| 1 or 2 Children | 173 (100.0%) | 0 (0.0%) |
| 3 or 4 Children | 0 (0.0%) | 0 (0.0%) |
| 5 or more Children | 6 (100.0%) | 0 (0.0%) |
| Total | 414 (100.0%) | 0 (0.0%) |
Income Below Poverty Among Single-Parent Households in Knightsen
| Children | Single Father | Single Mother |
| No Children | 0 (0.0%) | 0 (0.0%) |
| 1 or 2 Children | 0 (0.0%) | 0 (0.0%) |
| 3 or 4 Children | 0 (0.0%) | 0 (0.0%) |
| 5 or more Children | 0 (0.0%) | 0 (0.0%) |
| Total | 0 (0.0%) | 0 (0.0%) |
Income Below Poverty Among Married-Couple vs Single-Parent Households in Knightsen
| Children | Married-Couple Families | Single-Parent Households |
| No Children | 0 (0.0%) | 0 (0.0%) |
| 1 or 2 Children | 0 (0.0%) | 0 (0.0%) |
| 3 or 4 Children | 0 (0.0%) | 0 (0.0%) |
| 5 or more Children | 0 (0.0%) | 0 (0.0%) |
| Total | 0 (0.0%) | 0 (0.0%) |
Race in Knightsen
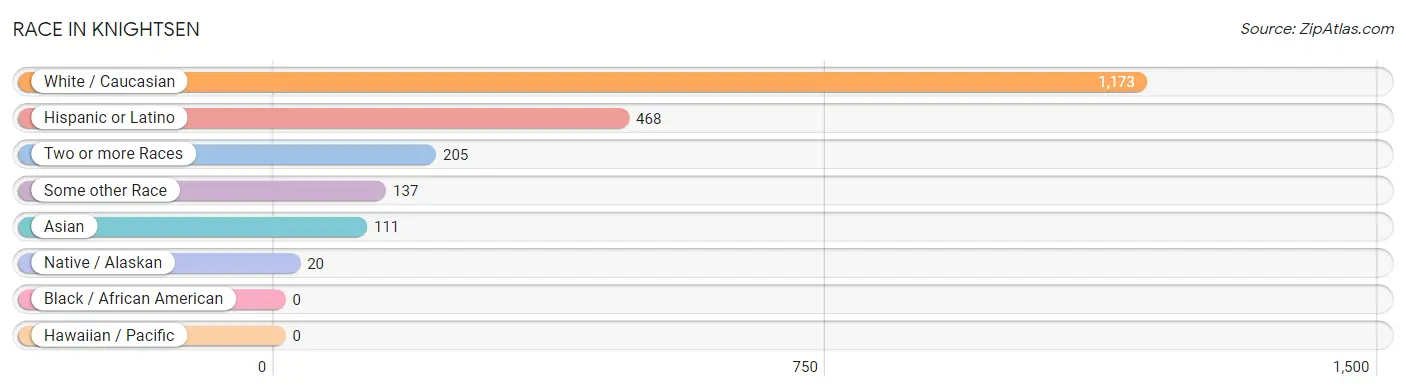
The most populous races in Knightsen are White / Caucasian (1,173 | 71.3%), Hispanic or Latino (468 | 28.4%), and Two or more Races (205 | 12.4%).
| Race | # Population | % Population |
| Asian | 111 | 6.7% |
| Black / African American | 0 | 0.0% |
| Hawaiian / Pacific | 0 | 0.0% |
| Hispanic or Latino | 468 | 28.4% |
| Native / Alaskan | 20 | 1.2% |
| White / Caucasian | 1,173 | 71.3% |
| Two or more Races | 205 | 12.4% |
| Some other Race | 137 | 8.3% |
| Total | 1,646 | 100.0% |
Ancestry in Knightsen
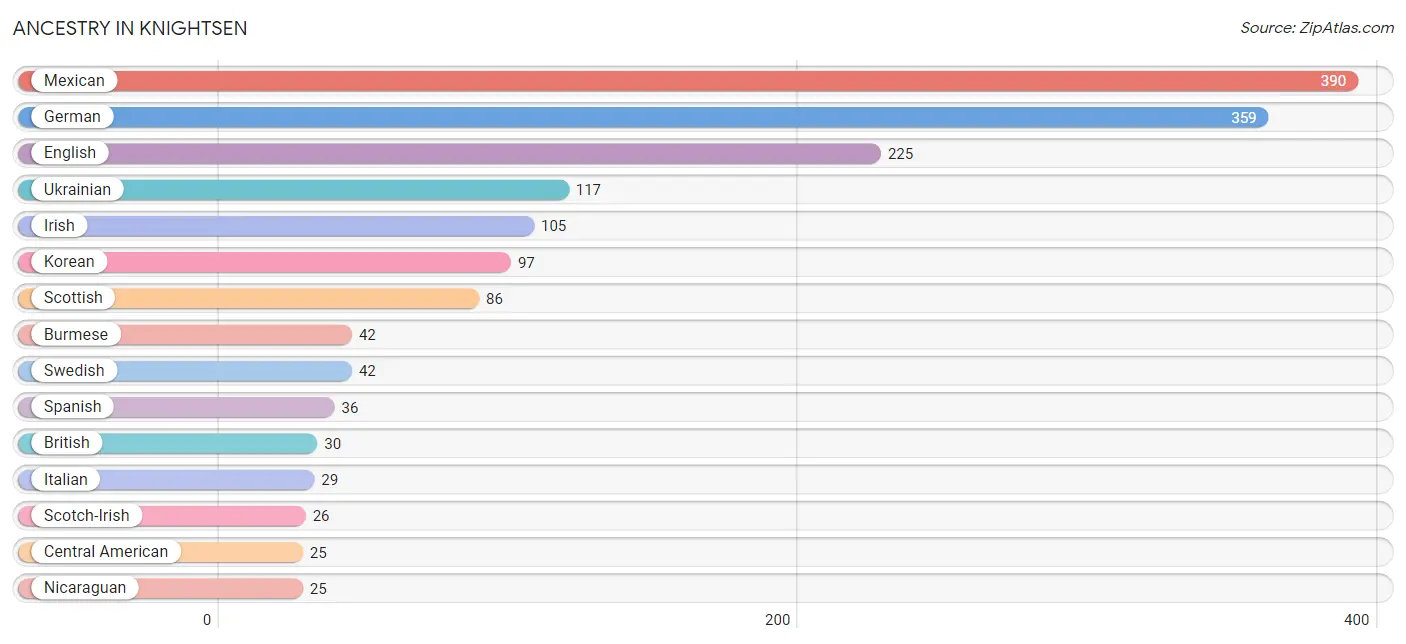
The most populous ancestries reported in Knightsen are Mexican (390 | 23.7%), German (359 | 21.8%), English (225 | 13.7%), Ukrainian (117 | 7.1%), and Irish (105 | 6.4%), together accounting for 72.7% of all Knightsen residents.
| Ancestry | # Population | % Population |
| American | 16 | 1.0% |
| British | 30 | 1.8% |
| Burmese | 42 | 2.5% |
| Central American | 25 | 1.5% |
| Cherokee | 6 | 0.4% |
| Danish | 5 | 0.3% |
| English | 225 | 13.7% |
| French | 17 | 1.0% |
| German | 359 | 21.8% |
| Hungarian | 14 | 0.9% |
| Irish | 105 | 6.4% |
| Italian | 29 | 1.8% |
| Korean | 97 | 5.9% |
| Macedonian | 6 | 0.4% |
| Mexican | 390 | 23.7% |
| Mexican American Indian | 20 | 1.2% |
| Nicaraguan | 25 | 1.5% |
| Northern European | 6 | 0.4% |
| Peruvian | 17 | 1.0% |
| Polish | 15 | 0.9% |
| Scotch-Irish | 26 | 1.6% |
| Scottish | 86 | 5.2% |
| Serbian | 6 | 0.4% |
| South American | 17 | 1.0% |
| Spanish | 36 | 2.2% |
| Swedish | 42 | 2.5% |
| Swiss | 15 | 0.9% |
| Ukrainian | 117 | 7.1% |
| Welsh | 8 | 0.5% | View All 29 Rows |
Immigrants in Knightsen
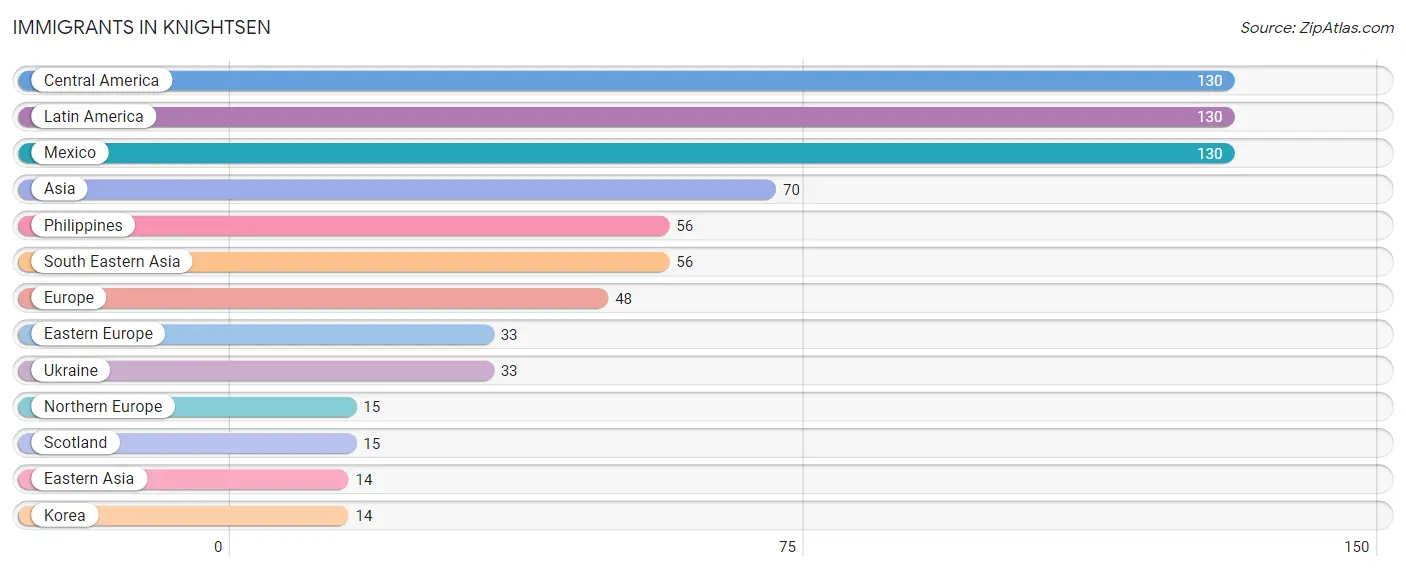
The most numerous immigrant groups reported in Knightsen came from Central America (130 | 7.9%), Latin America (130 | 7.9%), Mexico (130 | 7.9%), Asia (70 | 4.3%), and Philippines (56 | 3.4%), together accounting for 31.4% of all Knightsen residents.
| Immigration Origin | # Population | % Population |
| Asia | 70 | 4.3% |
| Central America | 130 | 7.9% |
| Eastern Asia | 14 | 0.9% |
| Eastern Europe | 33 | 2.0% |
| Europe | 48 | 2.9% |
| Korea | 14 | 0.9% |
| Latin America | 130 | 7.9% |
| Mexico | 130 | 7.9% |
| Northern Europe | 15 | 0.9% |
| Philippines | 56 | 3.4% |
| Scotland | 15 | 0.9% |
| South Eastern Asia | 56 | 3.4% |
| Ukraine | 33 | 2.0% | View All 13 Rows |
Sex and Age in Knightsen
Sex and Age in Knightsen
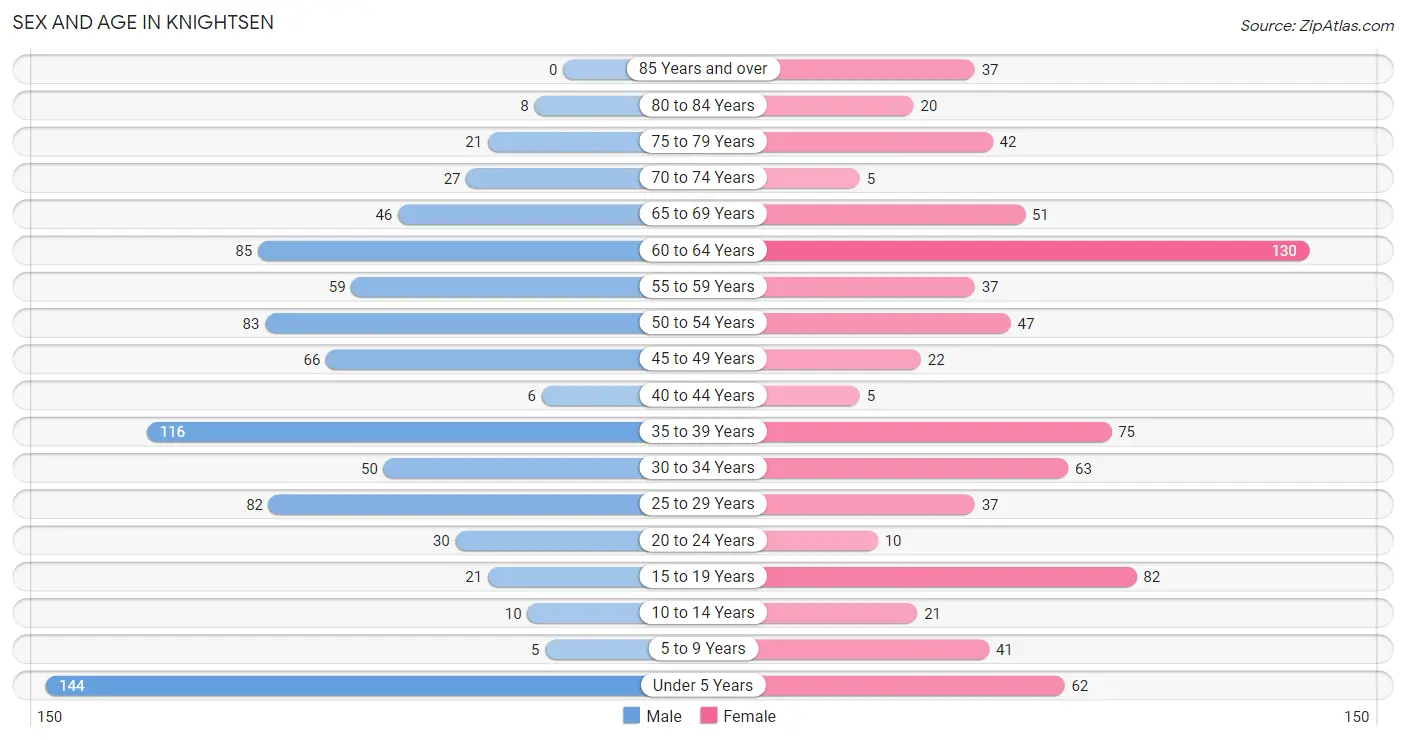
The most populous age groups in Knightsen are Under 5 Years (144 | 16.8%) for men and 60 to 64 Years (130 | 16.5%) for women.
| Age Bracket | Male | Female |
| Under 5 Years | 144 (16.8%) | 62 (7.9%) |
| 5 to 9 Years | 5 (0.6%) | 41 (5.2%) |
| 10 to 14 Years | 10 (1.2%) | 21 (2.7%) |
| 15 to 19 Years | 21 (2.4%) | 82 (10.4%) |
| 20 to 24 Years | 30 (3.5%) | 10 (1.3%) |
| 25 to 29 Years | 82 (9.6%) | 37 (4.7%) |
| 30 to 34 Years | 50 (5.8%) | 63 (8.0%) |
| 35 to 39 Years | 116 (13.5%) | 75 (9.5%) |
| 40 to 44 Years | 6 (0.7%) | 5 (0.6%) |
| 45 to 49 Years | 66 (7.7%) | 22 (2.8%) |
| 50 to 54 Years | 83 (9.7%) | 47 (6.0%) |
| 55 to 59 Years | 59 (6.9%) | 37 (4.7%) |
| 60 to 64 Years | 85 (9.9%) | 130 (16.5%) |
| 65 to 69 Years | 46 (5.4%) | 51 (6.5%) |
| 70 to 74 Years | 27 (3.1%) | 5 (0.6%) |
| 75 to 79 Years | 21 (2.4%) | 42 (5.3%) |
| 80 to 84 Years | 8 (0.9%) | 20 (2.5%) |
| 85 Years and over | 0 (0.0%) | 37 (4.7%) |
| Total | 859 (100.0%) | 787 (100.0%) |
Families and Households in Knightsen
Median Family Size in Knightsen
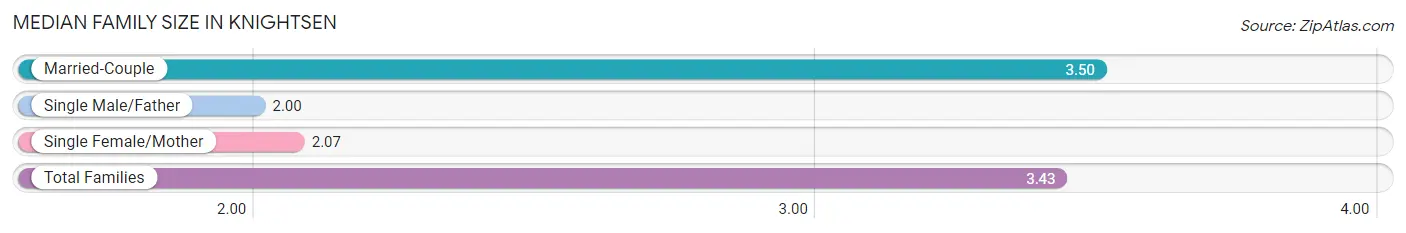
The median family size in Knightsen is 3.43 persons per family, with married-couple families (414 | 95.4%) accounting for the largest median family size of 3.5 persons per family. On the other hand, single male/father families (5 | 1.1%) represent the smallest median family size with 2.00 persons per family.
| Family Type | # Families | Family Size |
| Married-Couple | 414 (95.4%) | 3.50 |
| Single Male/Father | 5 (1.1%) | 2.00 |
| Single Female/Mother | 15 (3.5%) | 2.07 |
| Total Families | 434 (100.0%) | 3.43 |
Median Household Size in Knightsen
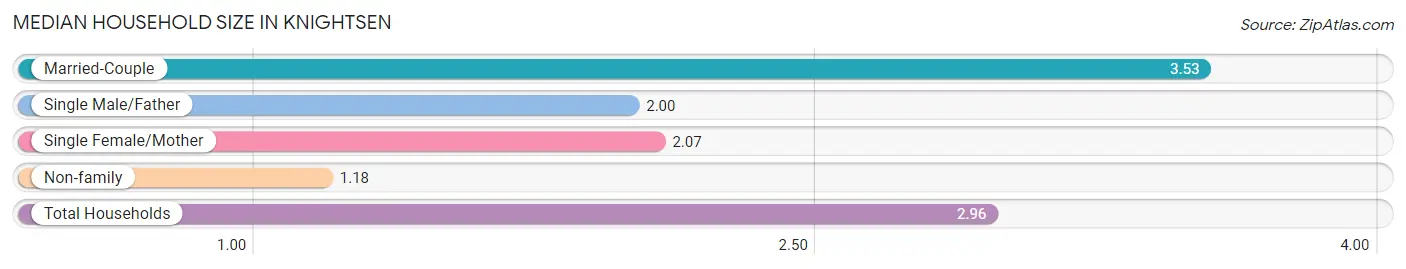
The median household size in Knightsen is 2.96 persons per household, with married-couple households (414 | 74.5%) accounting for the largest median household size of 3.53 persons per household. non-family households (122 | 21.9%) represent the smallest median household size with 1.18 persons per household.
| Household Type | # Households | Household Size |
| Married-Couple | 414 (74.5%) | 3.53 |
| Single Male/Father | 5 (0.9%) | 2.00 |
| Single Female/Mother | 15 (2.7%) | 2.07 |
| Non-family | 122 (21.9%) | 1.18 |
| Total Households | 556 (100.0%) | 2.96 |
Household Size by Marriage Status in Knightsen
Out of a total of 556 households in Knightsen, 434 (78.1%) are family households, while 122 (21.9%) are nonfamily households. The most numerous type of family households are 4-person households, comprising 181, and the most common type of nonfamily households are 1-person households, comprising 99.
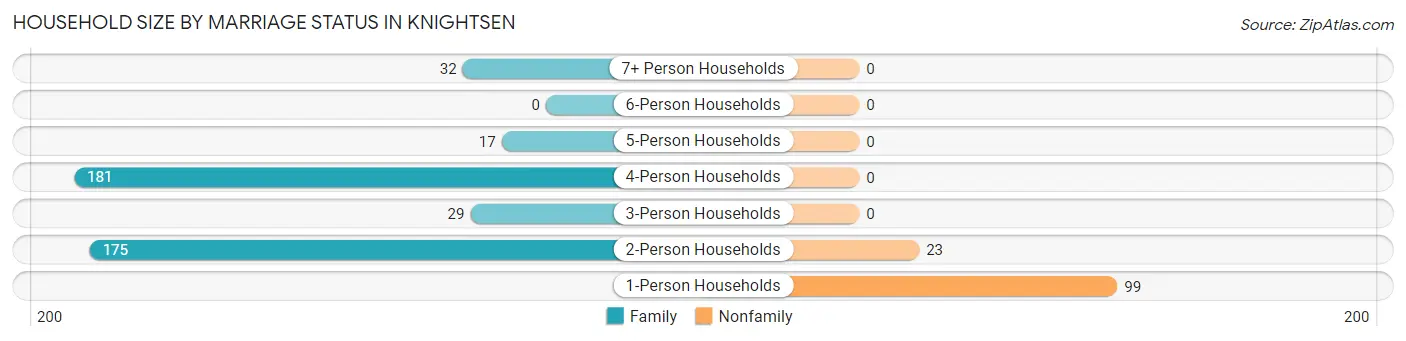
| Household Size | Family Households | Nonfamily Households |
| 1-Person Households | - | 99 (17.8%) |
| 2-Person Households | 175 (31.5%) | 23 (4.1%) |
| 3-Person Households | 29 (5.2%) | 0 (0.0%) |
| 4-Person Households | 181 (32.6%) | 0 (0.0%) |
| 5-Person Households | 17 (3.1%) | 0 (0.0%) |
| 6-Person Households | 0 (0.0%) | 0 (0.0%) |
| 7+ Person Households | 32 (5.8%) | 0 (0.0%) |
| Total | 434 (78.1%) | 122 (21.9%) |
Female Fertility in Knightsen
Fertility by Age in Knightsen
Average fertility rate in Knightsen is 48.0 births per 1,000 women. Women in the age bracket of 20 to 34 years have the highest fertility rate with 127.0 births per 1,000 women. Women in the age bracket of 20 to 34 years acount for 100.0% of all women with births.
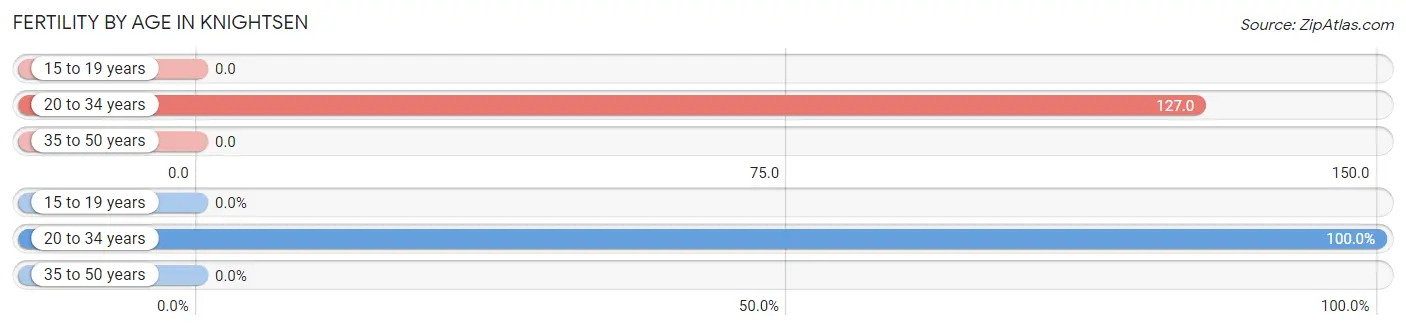
| Age Bracket | Women with Births | Births / 1,000 Women |
| 15 to 19 years | 0 (0.0%) | 0.0 |
| 20 to 34 years | 14 (100.0%) | 127.0 |
| 35 to 50 years | 0 (0.0%) | 0.0 |
| Total | 14 (100.0%) | 48.0 |
Fertility by Age by Marriage Status in Knightsen
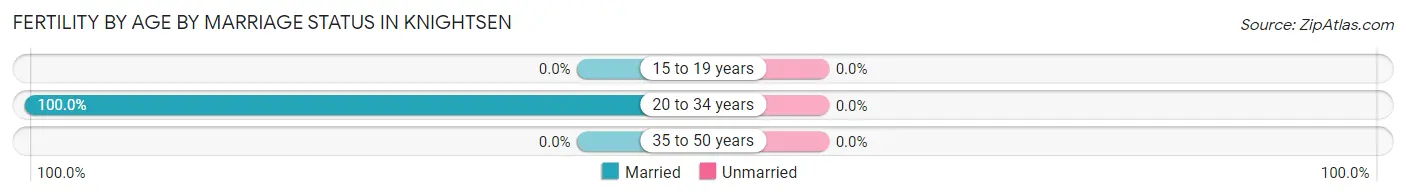
| Age Bracket | Married | Unmarried |
| 15 to 19 years | 0 (0.0%) | 0 (0.0%) |
| 20 to 34 years | 14 (100.0%) | 0 (0.0%) |
| 35 to 50 years | 0 (0.0%) | 0 (0.0%) |
| Total | 14 (100.0%) | 0 (0.0%) |
Fertility by Education in Knightsen
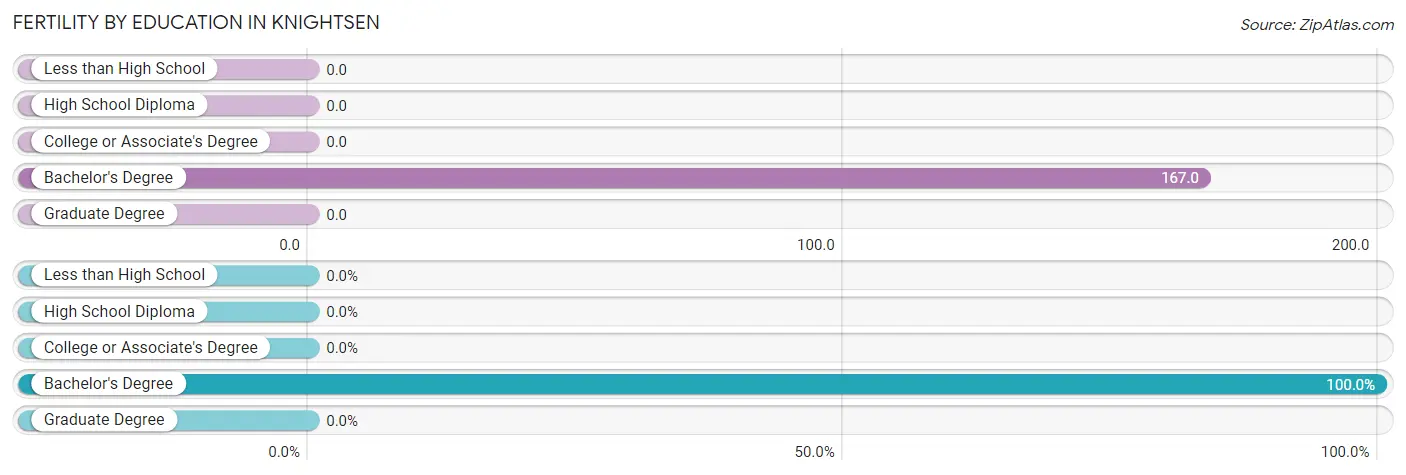
| Educational Attainment | Women with Births | Births / 1,000 Women |
| Less than High School | 0 (0.0%) | 0.0 |
| High School Diploma | 0 (0.0%) | 0.0 |
| College or Associate's Degree | 0 (0.0%) | 0.0 |
| Bachelor's Degree | 14 (100.0%) | 167.0 |
| Graduate Degree | 0 (0.0%) | 0.0 |
| Total | 14 (100.0%) | 48.0 |
Fertility by Education by Marriage Status in Knightsen
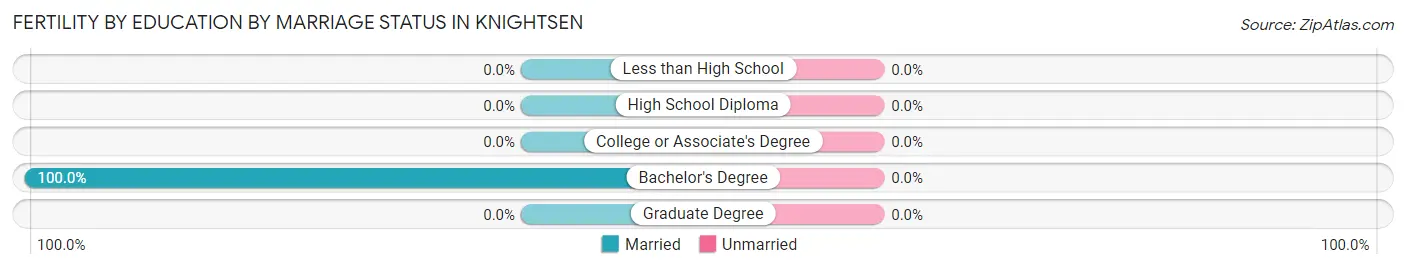
| Educational Attainment | Married | Unmarried |
| Less than High School | 0 (0.0%) | 0 (0.0%) |
| High School Diploma | 0 (0.0%) | 0 (0.0%) |
| College or Associate's Degree | 0 (0.0%) | 0 (0.0%) |
| Bachelor's Degree | 14 (100.0%) | 0 (0.0%) |
| Graduate Degree | 0 (0.0%) | 0 (0.0%) |
| Total | 14 (100.0%) | 0 (0.0%) |
Employment Characteristics in Knightsen
Employment by Class of Employer in Knightsen
Among the 701 employed individuals in Knightsen, private company employees (433 | 61.8%), not-for-profit organizations (85 | 12.1%), and self-employed (incorporated) (60 | 8.6%) make up the most common classes of employment.
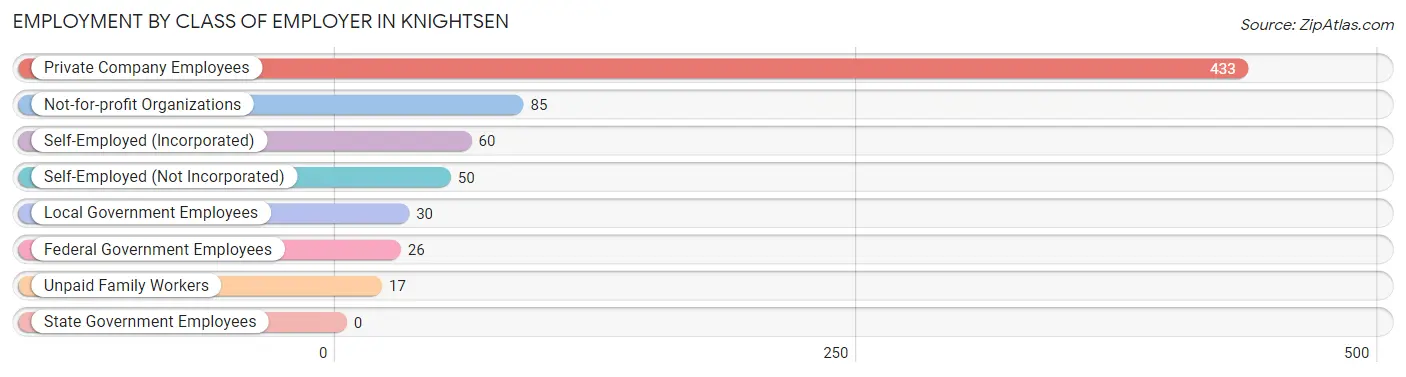
| Employer Class | # Employees | % Employees |
| Private Company Employees | 433 | 61.8% |
| Self-Employed (Incorporated) | 60 | 8.6% |
| Self-Employed (Not Incorporated) | 50 | 7.1% |
| Not-for-profit Organizations | 85 | 12.1% |
| Local Government Employees | 30 | 4.3% |
| State Government Employees | 0 | 0.0% |
| Federal Government Employees | 26 | 3.7% |
| Unpaid Family Workers | 17 | 2.4% |
| Total | 701 | 100.0% |
Employment Status by Age in Knightsen
According to the labor force statistics for Knightsen, out of the total population over 16 years of age (1,357), 59.8% or 811 individuals are in the labor force, with 6.5% or 53 of them unemployed. The age group with the highest labor force participation rate is 20 to 24 years, with 100.0% or 40 individuals in the labor force. Within the labor force, the 65 to 74 years age range has the highest percentage of unemployed individuals, with 24.2% or 15 of them being unemployed.
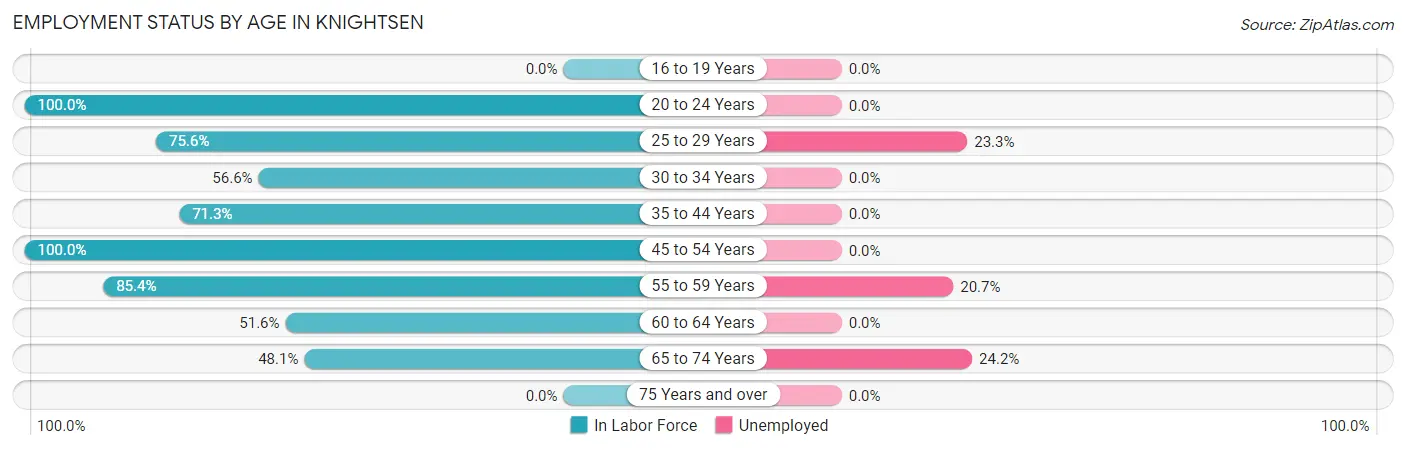
| Age Bracket | In Labor Force | Unemployed |
| 16 to 19 Years | 0 (0.0%) | 0 (0.0%) |
| 20 to 24 Years | 40 (100.0%) | 0 (0.0%) |
| 25 to 29 Years | 90 (75.6%) | 21 (23.3%) |
| 30 to 34 Years | 64 (56.6%) | 0 (0.0%) |
| 35 to 44 Years | 144 (71.3%) | 0 (0.0%) |
| 45 to 54 Years | 218 (100.0%) | 0 (0.0%) |
| 55 to 59 Years | 82 (85.4%) | 17 (20.7%) |
| 60 to 64 Years | 111 (51.6%) | 0 (0.0%) |
| 65 to 74 Years | 62 (48.1%) | 15 (24.2%) |
| 75 Years and over | 0 (0.0%) | 0 (0.0%) |
| Total | 811 (59.8%) | 53 (6.5%) |
Employment Status by Educational Attainment in Knightsen
According to labor force statistics for Knightsen, 73.6% of individuals (709) out of the total population between 25 and 64 years of age (963) are in the labor force, with 5.4% or 38 of them being unemployed. The group with the highest labor force participation rate are those with the educational attainment of high school diploma, with 79.9% or 234 individuals in the labor force. Within the labor force, individuals with bachelor's degree or higher education have the highest percentage of unemployment, with 12.7% or 21 of them being unemployed.
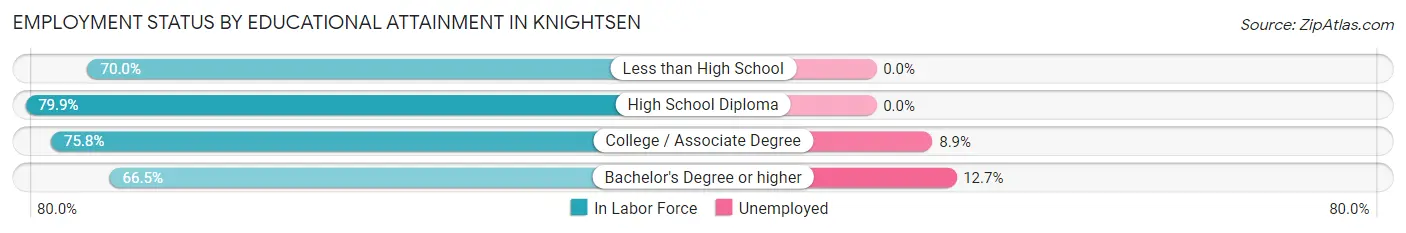
| Educational Attainment | In Labor Force | Unemployed |
| Less than High School | 119 (70.0%) | 0 (0.0%) |
| High School Diploma | 234 (79.9%) | 0 (0.0%) |
| College / Associate Degree | 191 (75.8%) | 22 (8.9%) |
| Bachelor's Degree or higher | 165 (66.5%) | 31 (12.7%) |
| Total | 709 (73.6%) | 52 (5.4%) |
Employment Occupations by Sex in Knightsen
Management, Business, Science and Arts Occupations
The most common Management, Business, Science and Arts occupations in Knightsen are Community & Social Service (69 | 9.1%), Business & Financial (42 | 5.5%), Management (41 | 5.4%), Education Instruction & Library (40 | 5.3%), and Computers, Engineering & Science (33 | 4.3%).
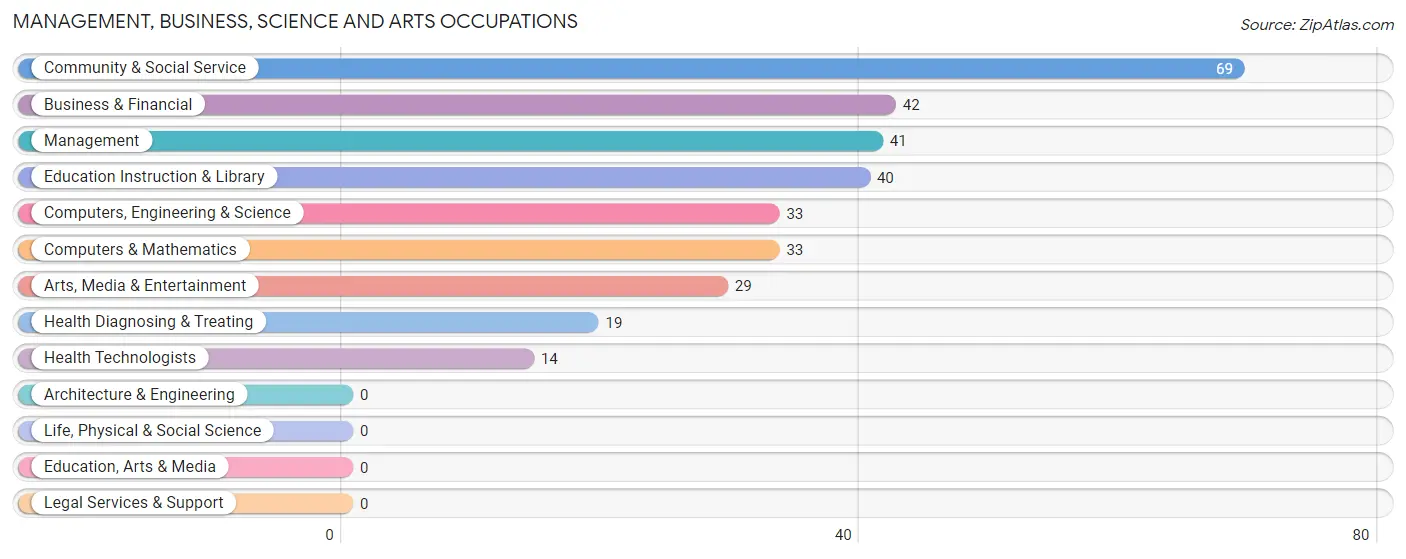
Management, Business, Science and Arts Occupations by Sex
Within the Management, Business, Science and Arts occupations in Knightsen, the most male-oriented occupations are Computers, Engineering & Science (100.0%), Computers & Mathematics (100.0%), and Business & Financial (59.5%), while the most female-oriented occupations are Community & Social Service (100.0%), Education Instruction & Library (100.0%), and Arts, Media & Entertainment (100.0%).

| Occupation | Male | Female |
| Management | 17 (41.5%) | 24 (58.5%) |
| Business & Financial | 25 (59.5%) | 17 (40.5%) |
| Computers, Engineering & Science | 33 (100.0%) | 0 (0.0%) |
| Computers & Mathematics | 33 (100.0%) | 0 (0.0%) |
| Architecture & Engineering | 0 (0.0%) | 0 (0.0%) |
| Life, Physical & Social Science | 0 (0.0%) | 0 (0.0%) |
| Community & Social Service | 0 (0.0%) | 69 (100.0%) |
| Education, Arts & Media | 0 (0.0%) | 0 (0.0%) |
| Legal Services & Support | 0 (0.0%) | 0 (0.0%) |
| Education Instruction & Library | 0 (0.0%) | 40 (100.0%) |
| Arts, Media & Entertainment | 0 (0.0%) | 29 (100.0%) |
| Health Diagnosing & Treating | 0 (0.0%) | 19 (100.0%) |
| Health Technologists | 0 (0.0%) | 14 (100.0%) |
| Total (Category) | 75 (36.8%) | 129 (63.2%) |
| Total (Overall) | 489 (64.5%) | 269 (35.5%) |
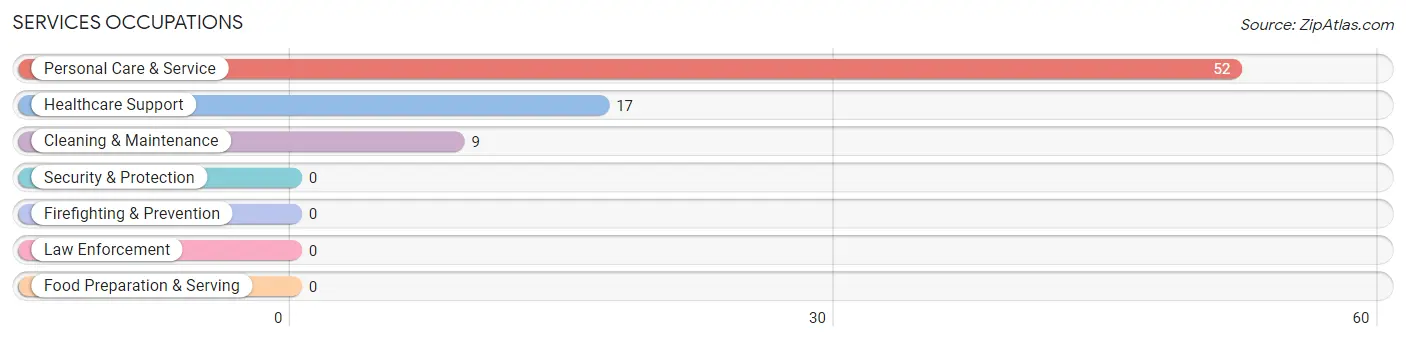
Services Occupations
The most common Services occupations in Knightsen are Personal Care & Service (52 | 6.9%), Healthcare Support (17 | 2.2%), and Cleaning & Maintenance (9 | 1.2%).
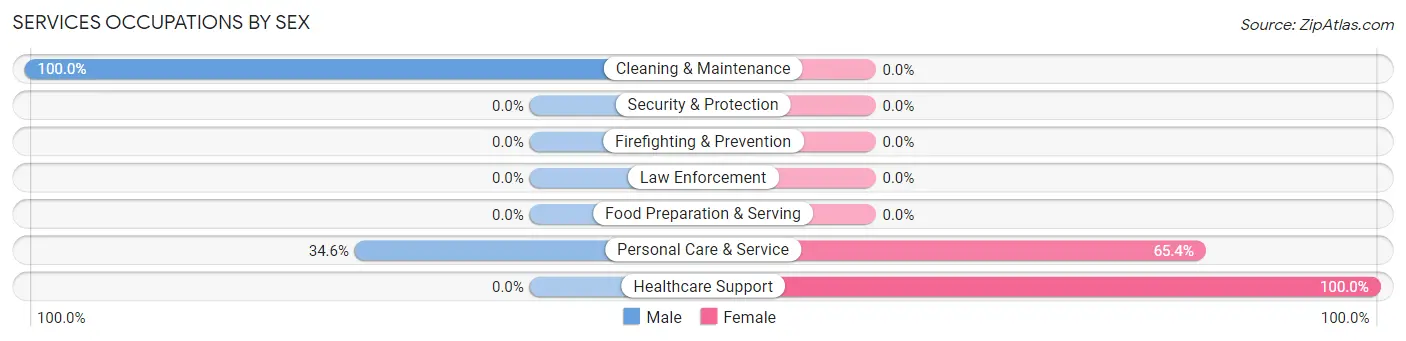
Services Occupations by Sex
Within the Services occupations in Knightsen, the most male-oriented occupations are Cleaning & Maintenance (100.0%), and Personal Care & Service (34.6%), while the most female-oriented occupations are Healthcare Support (100.0%), and Personal Care & Service (65.4%).
| Occupation | Male | Female |
| Healthcare Support | 0 (0.0%) | 17 (100.0%) |
| Security & Protection | 0 (0.0%) | 0 (0.0%) |
| Firefighting & Prevention | 0 (0.0%) | 0 (0.0%) |
| Law Enforcement | 0 (0.0%) | 0 (0.0%) |
| Food Preparation & Serving | 0 (0.0%) | 0 (0.0%) |
| Cleaning & Maintenance | 9 (100.0%) | 0 (0.0%) |
| Personal Care & Service | 18 (34.6%) | 34 (65.4%) |
| Total (Category) | 27 (34.6%) | 51 (65.4%) |
| Total (Overall) | 489 (64.5%) | 269 (35.5%) |
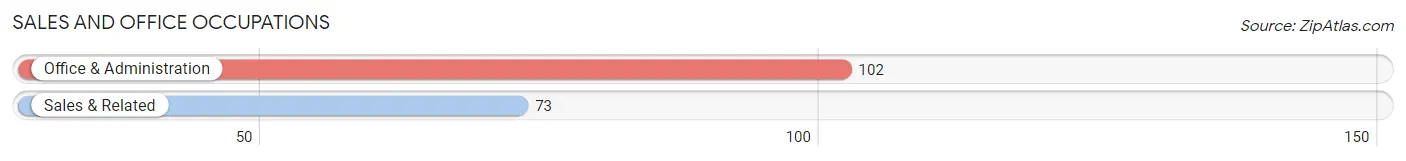
Sales and Office Occupations
The most common Sales and Office occupations in Knightsen are Office & Administration (102 | 13.5%), and Sales & Related (73 | 9.6%).
Sales and Office Occupations by Sex
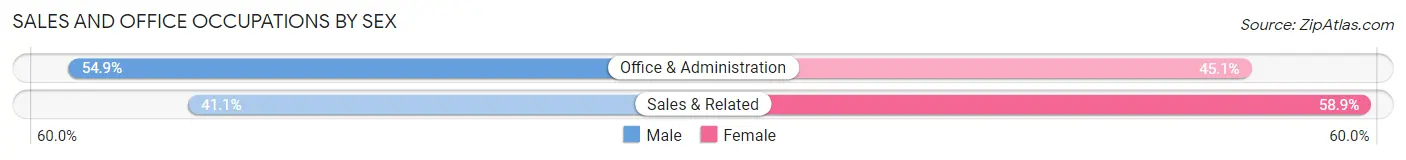
| Occupation | Male | Female |
| Sales & Related | 30 (41.1%) | 43 (58.9%) |
| Office & Administration | 56 (54.9%) | 46 (45.1%) |
| Total (Category) | 86 (49.1%) | 89 (50.9%) |
| Total (Overall) | 489 (64.5%) | 269 (35.5%) |
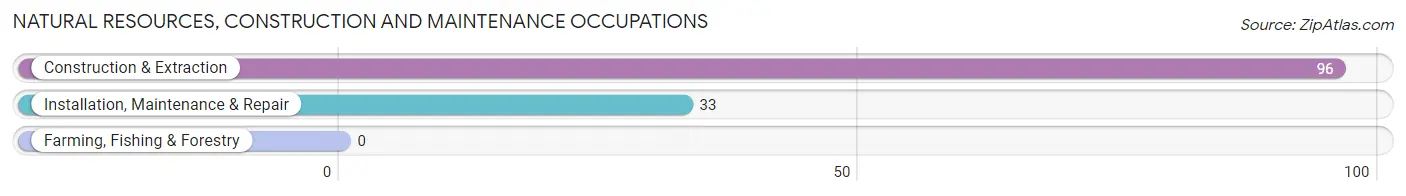
Natural Resources, Construction and Maintenance Occupations
The most common Natural Resources, Construction and Maintenance occupations in Knightsen are Construction & Extraction (96 | 12.7%), and Installation, Maintenance & Repair (33 | 4.3%).
Natural Resources, Construction and Maintenance Occupations by Sex
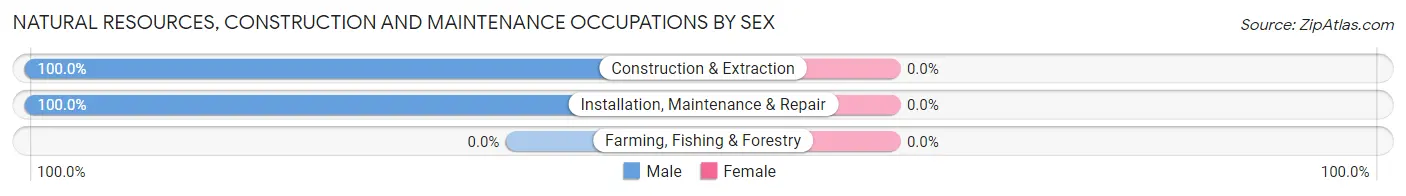
| Occupation | Male | Female |
| Farming, Fishing & Forestry | 0 (0.0%) | 0 (0.0%) |
| Construction & Extraction | 96 (100.0%) | 0 (0.0%) |
| Installation, Maintenance & Repair | 33 (100.0%) | 0 (0.0%) |
| Total (Category) | 129 (100.0%) | 0 (0.0%) |
| Total (Overall) | 489 (64.5%) | 269 (35.5%) |
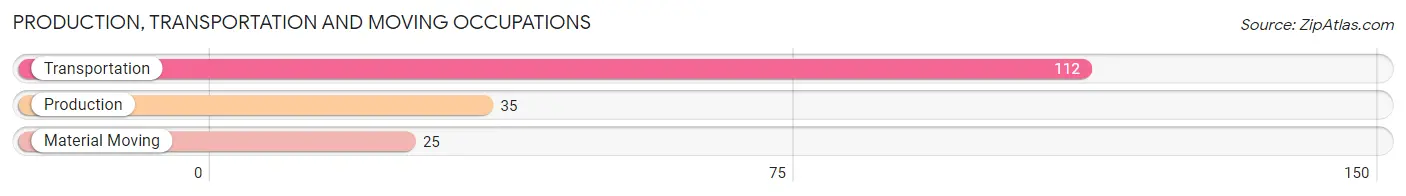
Production, Transportation and Moving Occupations
The most common Production, Transportation and Moving occupations in Knightsen are Transportation (112 | 14.8%), Production (35 | 4.6%), and Material Moving (25 | 3.3%).
Production, Transportation and Moving Occupations by Sex
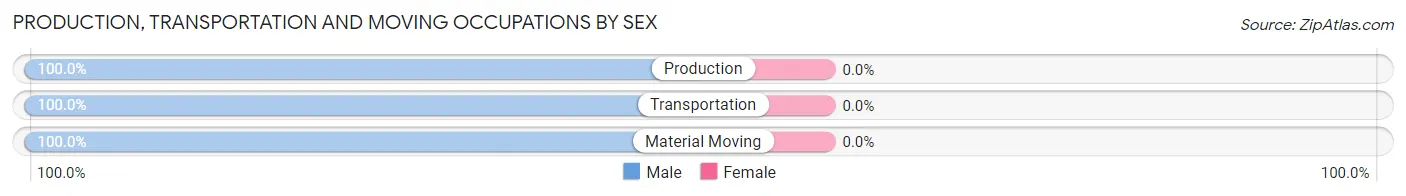
| Occupation | Male | Female |
| Production | 35 (100.0%) | 0 (0.0%) |
| Transportation | 112 (100.0%) | 0 (0.0%) |
| Material Moving | 25 (100.0%) | 0 (0.0%) |
| Total (Category) | 172 (100.0%) | 0 (0.0%) |
| Total (Overall) | 489 (64.5%) | 269 (35.5%) |
Employment Industries by Sex in Knightsen
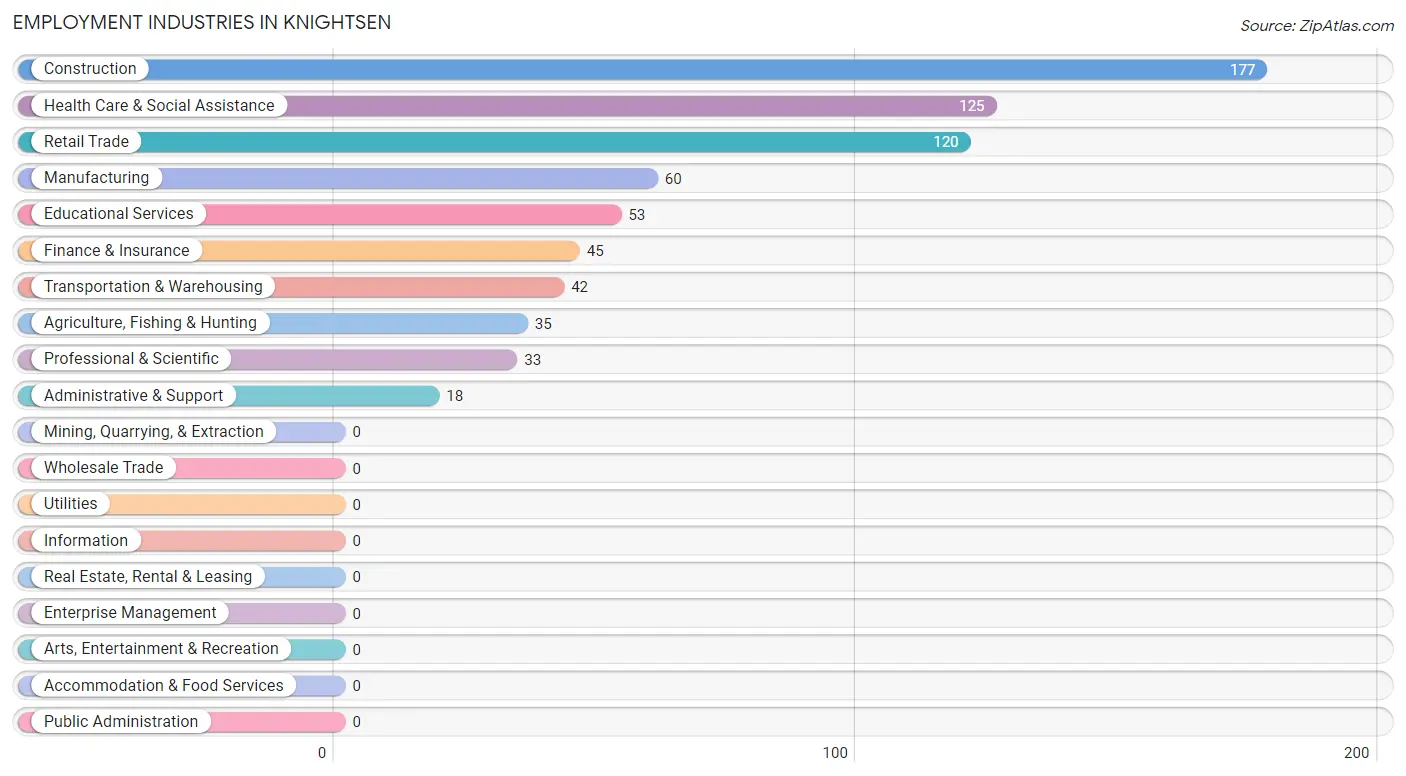
Employment Industries in Knightsen
The major employment industries in Knightsen include Construction (177 | 23.4%), Health Care & Social Assistance (125 | 16.5%), Retail Trade (120 | 15.8%), Manufacturing (60 | 7.9%), and Educational Services (53 | 7.0%).
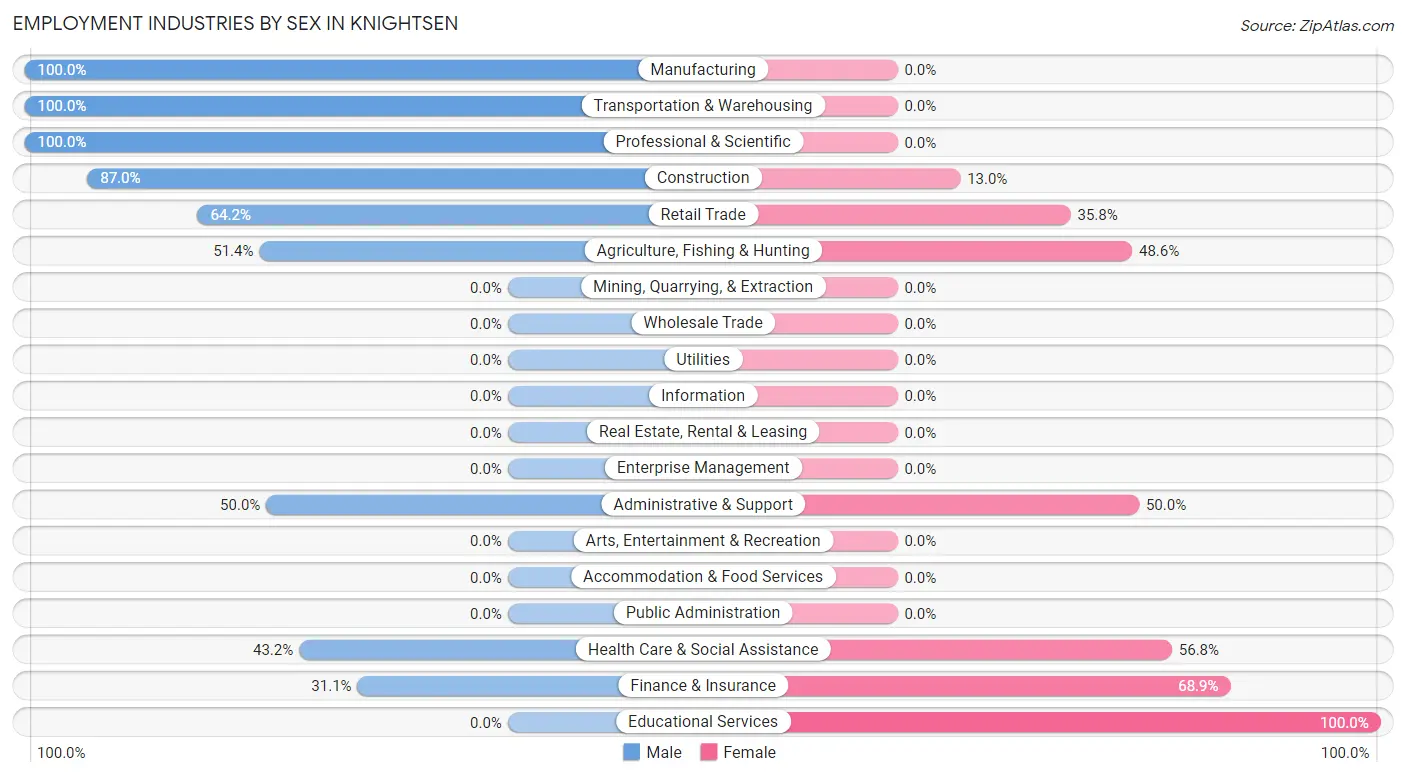
Employment Industries by Sex in Knightsen
The Knightsen industries that see more men than women are Manufacturing (100.0%), Transportation & Warehousing (100.0%), and Professional & Scientific (100.0%), whereas the industries that tend to have a higher number of women are Educational Services (100.0%), Finance & Insurance (68.9%), and Health Care & Social Assistance (56.8%).
| Industry | Male | Female |
| Agriculture, Fishing & Hunting | 18 (51.4%) | 17 (48.6%) |
| Mining, Quarrying, & Extraction | 0 (0.0%) | 0 (0.0%) |
| Construction | 154 (87.0%) | 23 (13.0%) |
| Manufacturing | 60 (100.0%) | 0 (0.0%) |
| Wholesale Trade | 0 (0.0%) | 0 (0.0%) |
| Retail Trade | 77 (64.2%) | 43 (35.8%) |
| Transportation & Warehousing | 42 (100.0%) | 0 (0.0%) |
| Utilities | 0 (0.0%) | 0 (0.0%) |
| Information | 0 (0.0%) | 0 (0.0%) |
| Finance & Insurance | 14 (31.1%) | 31 (68.9%) |
| Real Estate, Rental & Leasing | 0 (0.0%) | 0 (0.0%) |
| Professional & Scientific | 33 (100.0%) | 0 (0.0%) |
| Enterprise Management | 0 (0.0%) | 0 (0.0%) |
| Administrative & Support | 9 (50.0%) | 9 (50.0%) |
| Educational Services | 0 (0.0%) | 53 (100.0%) |
| Health Care & Social Assistance | 54 (43.2%) | 71 (56.8%) |
| Arts, Entertainment & Recreation | 0 (0.0%) | 0 (0.0%) |
| Accommodation & Food Services | 0 (0.0%) | 0 (0.0%) |
| Public Administration | 0 (0.0%) | 0 (0.0%) |
| Total | 489 (64.5%) | 269 (35.5%) |
Education in Knightsen
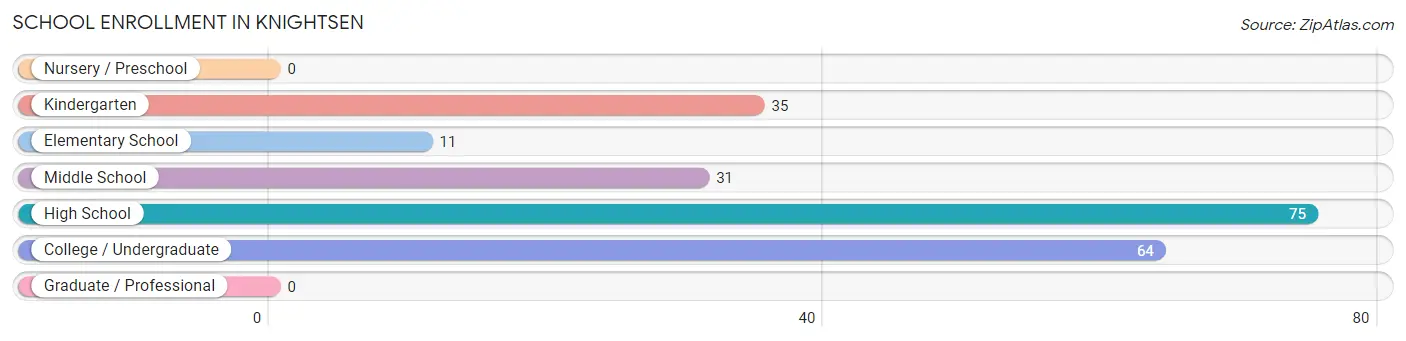
School Enrollment in Knightsen
The most common levels of schooling among the 216 students in Knightsen are high school (75 | 34.7%), college / undergraduate (64 | 29.6%), and kindergarten (35 | 16.2%).
| School Level | # Students | % Students |
| Nursery / Preschool | 0 | 0.0% |
| Kindergarten | 35 | 16.2% |
| Elementary School | 11 | 5.1% |
| Middle School | 31 | 14.3% |
| High School | 75 | 34.7% |
| College / Undergraduate | 64 | 29.6% |
| Graduate / Professional | 0 | 0.0% |
| Total | 216 | 100.0% |
School Enrollment by Age by Funding Source in Knightsen
Out of a total of 216 students who are enrolled in schools in Knightsen, 48 (22.2%) attend a private institution, while the remaining 168 (77.8%) are enrolled in public schools. The age group of 25 to 34 year olds has the highest likelihood of being enrolled in private schools, with 16 (100.0% in the age bracket) enrolled. Conversely, the age group of 5 to 9 year old has the lowest likelihood of being enrolled in a private school, with 46 (100.0% in the age bracket) attending a public institution.
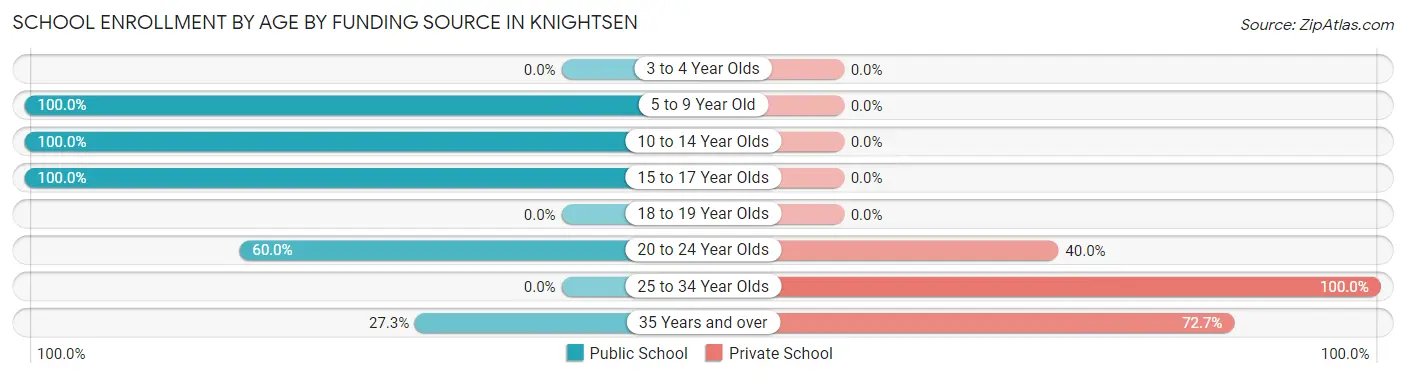
| Age Bracket | Public School | Private School |
| 3 to 4 Year Olds | 0 (0.0%) | 0 (0.0%) |
| 5 to 9 Year Old | 46 (100.0%) | 0 (0.0%) |
| 10 to 14 Year Olds | 31 (100.0%) | 0 (0.0%) |
| 15 to 17 Year Olds | 61 (100.0%) | 0 (0.0%) |
| 18 to 19 Year Olds | 0 (0.0%) | 0 (0.0%) |
| 20 to 24 Year Olds | 24 (60.0%) | 16 (40.0%) |
| 25 to 34 Year Olds | 0 (0.0%) | 16 (100.0%) |
| 35 Years and over | 6 (27.3%) | 16 (72.7%) |
| Total | 168 (77.8%) | 48 (22.2%) |
Educational Attainment by Field of Study in Knightsen
Business (89 | 25.8%), psychology (73 | 21.2%), liberal arts & history (54 | 15.7%), education (34 | 9.9%), and computers & mathematics (33 | 9.6%) are the most common fields of study among 345 individuals in Knightsen who have obtained a bachelor's degree or higher.
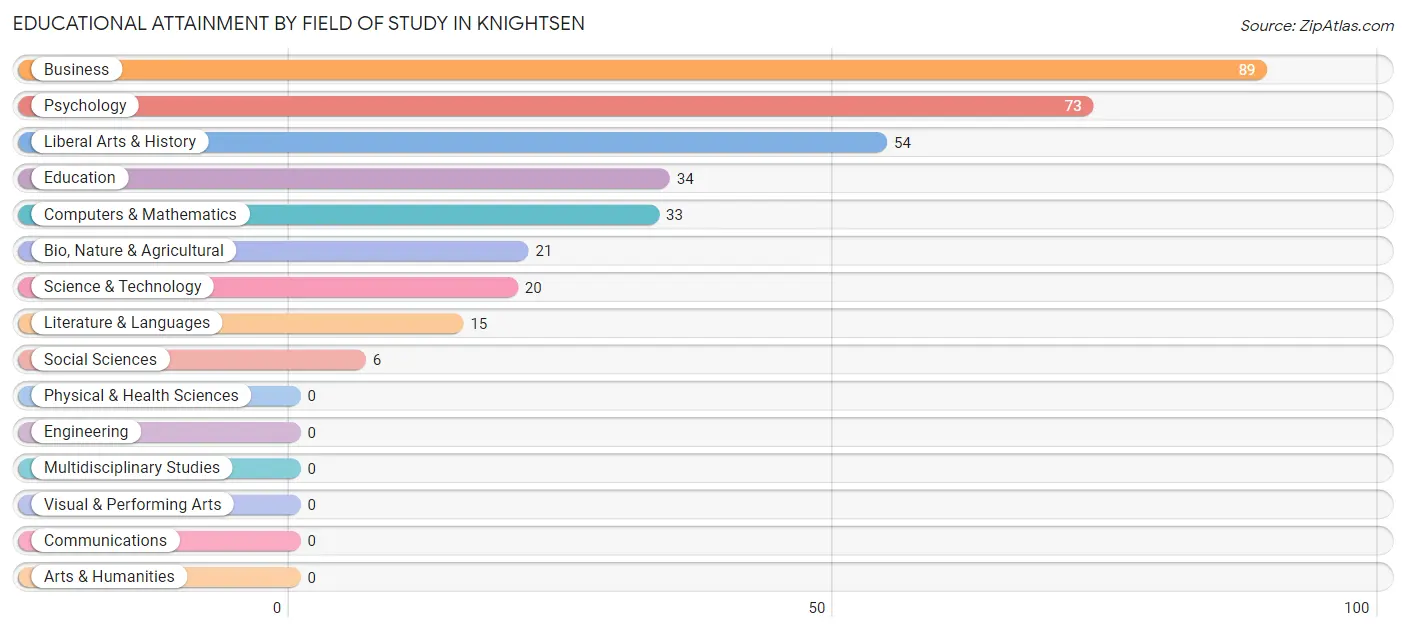
| Field of Study | # Graduates | % Graduates |
| Computers & Mathematics | 33 | 9.6% |
| Bio, Nature & Agricultural | 21 | 6.1% |
| Physical & Health Sciences | 0 | 0.0% |
| Psychology | 73 | 21.2% |
| Social Sciences | 6 | 1.7% |
| Engineering | 0 | 0.0% |
| Multidisciplinary Studies | 0 | 0.0% |
| Science & Technology | 20 | 5.8% |
| Business | 89 | 25.8% |
| Education | 34 | 9.9% |
| Literature & Languages | 15 | 4.3% |
| Liberal Arts & History | 54 | 15.7% |
| Visual & Performing Arts | 0 | 0.0% |
| Communications | 0 | 0.0% |
| Arts & Humanities | 0 | 0.0% |
| Total | 345 | 100.0% |
Transportation & Commute in Knightsen
Vehicle Availability by Sex in Knightsen
The most prevalent vehicle ownership categories in Knightsen are males with 2 vehicles (225, accounting for 48.0%) and females with 2 vehicles (88, making up 97.0%).
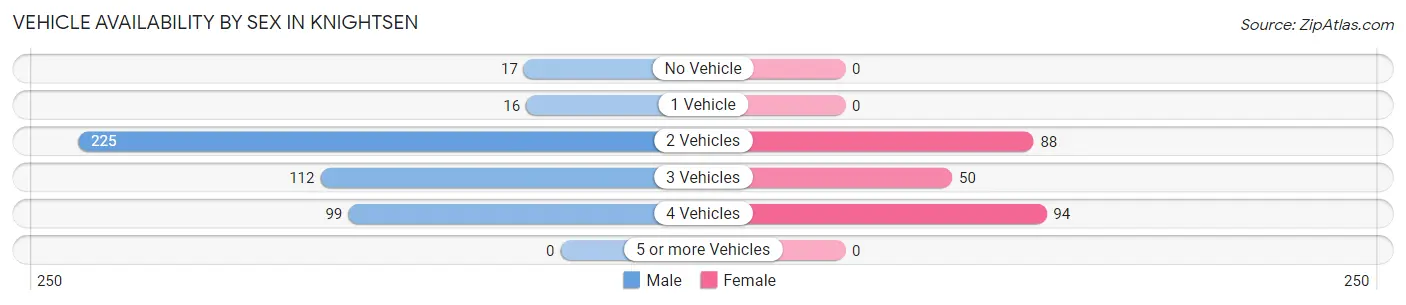
| Vehicles Available | Male | Female |
| No Vehicle | 17 (3.6%) | 0 (0.0%) |
| 1 Vehicle | 16 (3.4%) | 0 (0.0%) |
| 2 Vehicles | 225 (48.0%) | 88 (37.9%) |
| 3 Vehicles | 112 (23.9%) | 50 (21.5%) |
| 4 Vehicles | 99 (21.1%) | 94 (40.5%) |
| 5 or more Vehicles | 0 (0.0%) | 0 (0.0%) |
| Total | 469 (100.0%) | 232 (100.0%) |
Commute Time in Knightsen
The most frequently occuring commute durations in Knightsen are 90 or more minutes (106 commuters, 18.1%), 60 to 89 minutes (100 commuters, 17.1%), and 30 to 34 minutes (95 commuters, 16.2%).
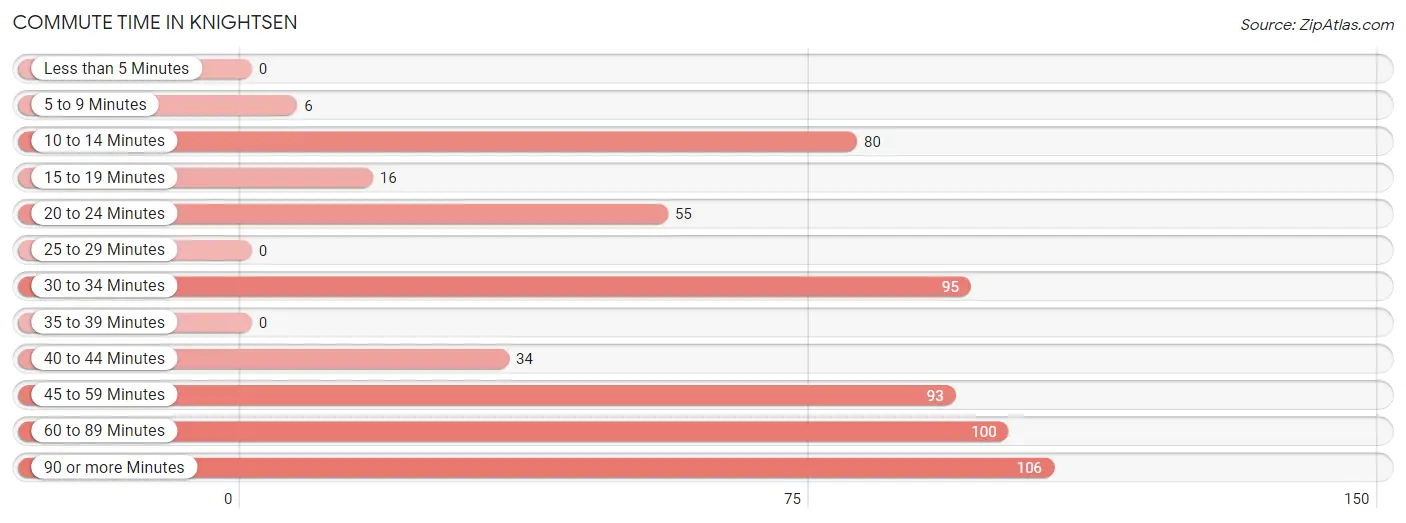
| Commute Time | # Commuters | % Commuters |
| Less than 5 Minutes | 0 | 0.0% |
| 5 to 9 Minutes | 6 | 1.0% |
| 10 to 14 Minutes | 80 | 13.7% |
| 15 to 19 Minutes | 16 | 2.7% |
| 20 to 24 Minutes | 55 | 9.4% |
| 25 to 29 Minutes | 0 | 0.0% |
| 30 to 34 Minutes | 95 | 16.2% |
| 35 to 39 Minutes | 0 | 0.0% |
| 40 to 44 Minutes | 34 | 5.8% |
| 45 to 59 Minutes | 93 | 15.9% |
| 60 to 89 Minutes | 100 | 17.1% |
| 90 or more Minutes | 106 | 18.1% |
Commute Time by Sex in Knightsen
The most common commute times in Knightsen are 60 to 89 minutes (100 commuters, 23.3%) for males and 90 or more minutes (50 commuters, 32.3%) for females.
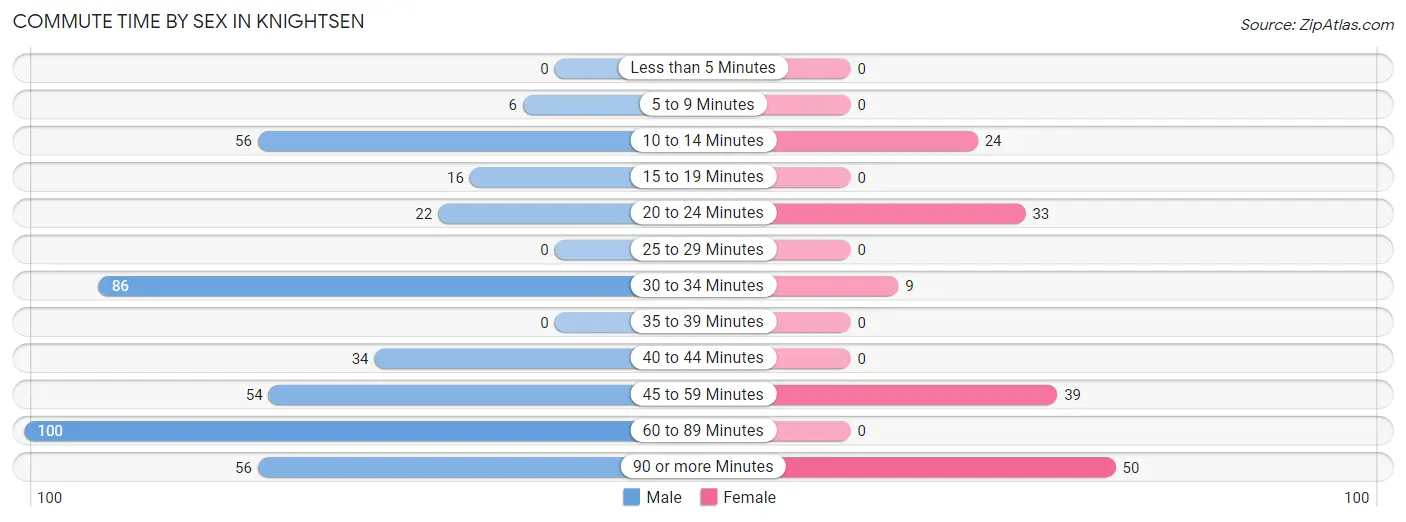
| Commute Time | Male | Female |
| Less than 5 Minutes | 0 (0.0%) | 0 (0.0%) |
| 5 to 9 Minutes | 6 (1.4%) | 0 (0.0%) |
| 10 to 14 Minutes | 56 (13.0%) | 24 (15.5%) |
| 15 to 19 Minutes | 16 (3.7%) | 0 (0.0%) |
| 20 to 24 Minutes | 22 (5.1%) | 33 (21.3%) |
| 25 to 29 Minutes | 0 (0.0%) | 0 (0.0%) |
| 30 to 34 Minutes | 86 (20.0%) | 9 (5.8%) |
| 35 to 39 Minutes | 0 (0.0%) | 0 (0.0%) |
| 40 to 44 Minutes | 34 (7.9%) | 0 (0.0%) |
| 45 to 59 Minutes | 54 (12.6%) | 39 (25.2%) |
| 60 to 89 Minutes | 100 (23.3%) | 0 (0.0%) |
| 90 or more Minutes | 56 (13.0%) | 50 (32.3%) |
Time of Departure to Work by Sex in Knightsen
The most frequent times of departure to work in Knightsen are 7:30 AM to 7:59 AM (131, 30.5%) for males and 9:00 AM to 9:59 AM (55, 35.5%) for females.
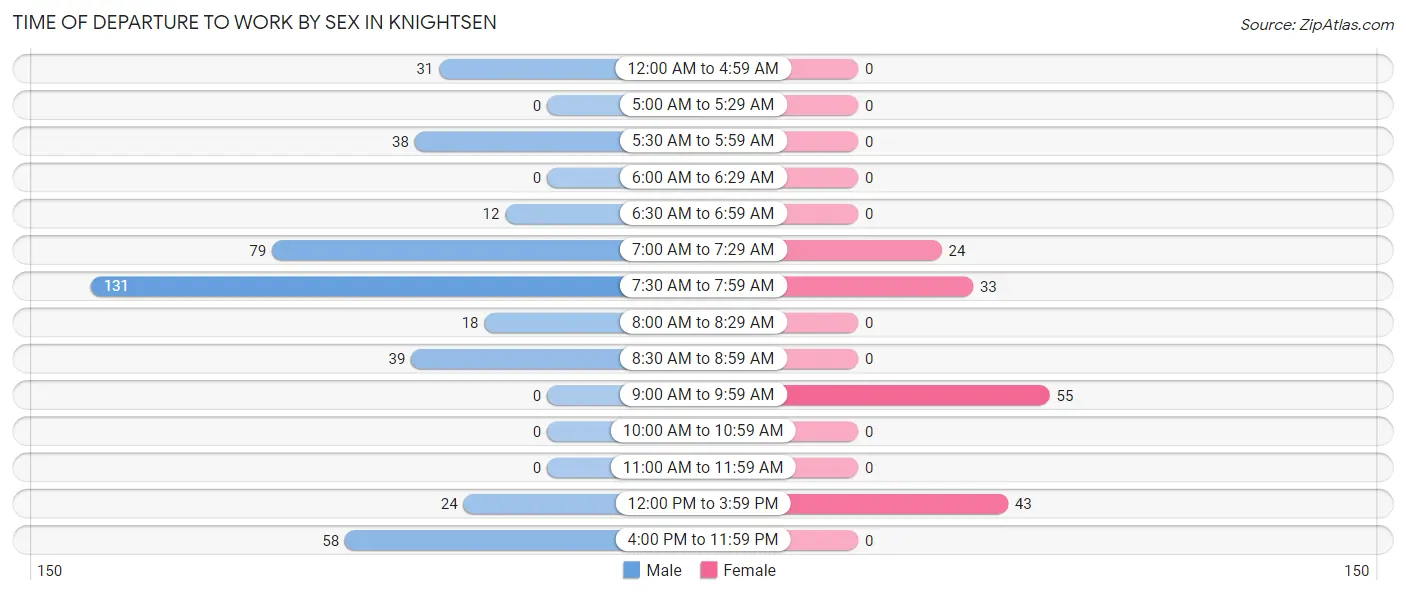
| Time of Departure | Male | Female |
| 12:00 AM to 4:59 AM | 31 (7.2%) | 0 (0.0%) |
| 5:00 AM to 5:29 AM | 0 (0.0%) | 0 (0.0%) |
| 5:30 AM to 5:59 AM | 38 (8.8%) | 0 (0.0%) |
| 6:00 AM to 6:29 AM | 0 (0.0%) | 0 (0.0%) |
| 6:30 AM to 6:59 AM | 12 (2.8%) | 0 (0.0%) |
| 7:00 AM to 7:29 AM | 79 (18.4%) | 24 (15.5%) |
| 7:30 AM to 7:59 AM | 131 (30.5%) | 33 (21.3%) |
| 8:00 AM to 8:29 AM | 18 (4.2%) | 0 (0.0%) |
| 8:30 AM to 8:59 AM | 39 (9.1%) | 0 (0.0%) |
| 9:00 AM to 9:59 AM | 0 (0.0%) | 55 (35.5%) |
| 10:00 AM to 10:59 AM | 0 (0.0%) | 0 (0.0%) |
| 11:00 AM to 11:59 AM | 0 (0.0%) | 0 (0.0%) |
| 12:00 PM to 3:59 PM | 24 (5.6%) | 43 (27.7%) |
| 4:00 PM to 11:59 PM | 58 (13.5%) | 0 (0.0%) |
| Total | 430 (100.0%) | 155 (100.0%) |
Housing Occupancy in Knightsen
Occupancy by Ownership in Knightsen
Of the total 556 dwellings in Knightsen, owner-occupied units account for 522 (93.9%), while renter-occupied units make up 34 (6.1%).
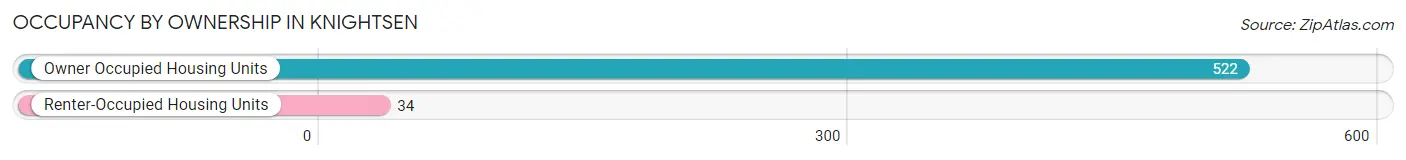
| Occupancy | # Housing Units | % Housing Units |
| Owner Occupied Housing Units | 522 | 93.9% |
| Renter-Occupied Housing Units | 34 | 6.1% |
| Total Occupied Housing Units | 556 | 100.0% |
Occupancy by Household Size in Knightsen
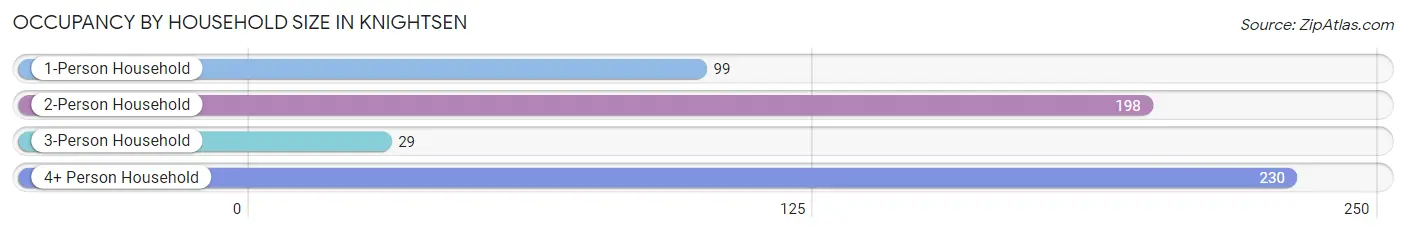
| Household Size | # Housing Units | % Housing Units |
| 1-Person Household | 99 | 17.8% |
| 2-Person Household | 198 | 35.6% |
| 3-Person Household | 29 | 5.2% |
| 4+ Person Household | 230 | 41.4% |
| Total Housing Units | 556 | 100.0% |
Occupancy by Ownership by Household Size in Knightsen
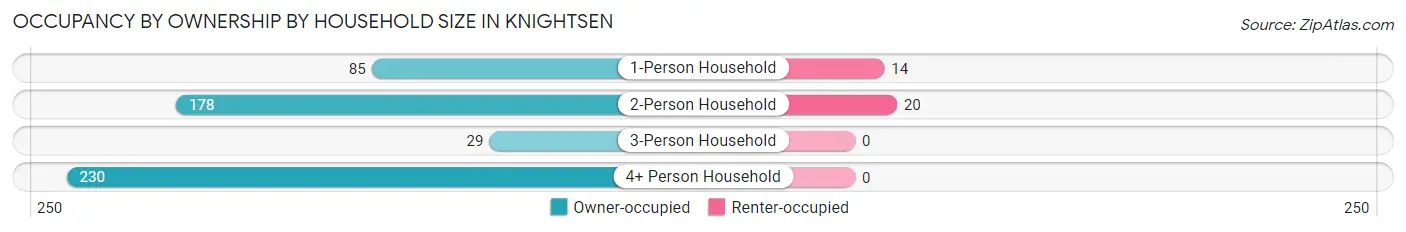
| Household Size | Owner-occupied | Renter-occupied |
| 1-Person Household | 85 (85.9%) | 14 (14.1%) |
| 2-Person Household | 178 (89.9%) | 20 (10.1%) |
| 3-Person Household | 29 (100.0%) | 0 (0.0%) |
| 4+ Person Household | 230 (100.0%) | 0 (0.0%) |
| Total Housing Units | 522 (93.9%) | 34 (6.1%) |
Occupancy by Educational Attainment in Knightsen
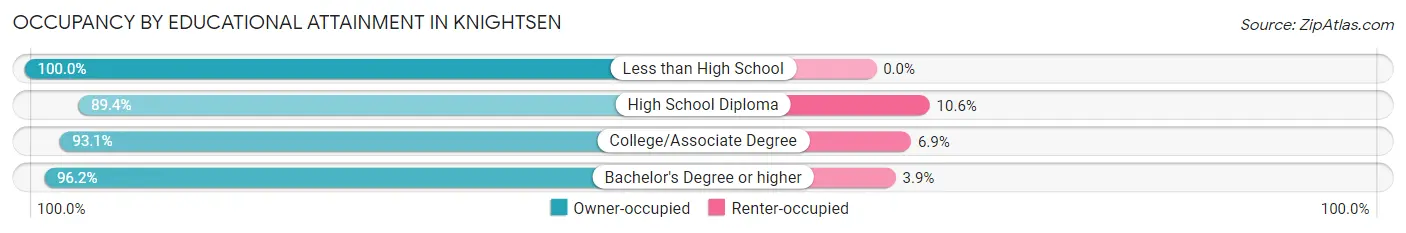
| Household Size | Owner-occupied | Renter-occupied |
| Less than High School | 65 (100.0%) | 0 (0.0%) |
| High School Diploma | 118 (89.4%) | 14 (10.6%) |
| College/Associate Degree | 189 (93.1%) | 14 (6.9%) |
| Bachelor's Degree or higher | 150 (96.2%) | 6 (3.8%) |
Occupancy by Age of Householder in Knightsen
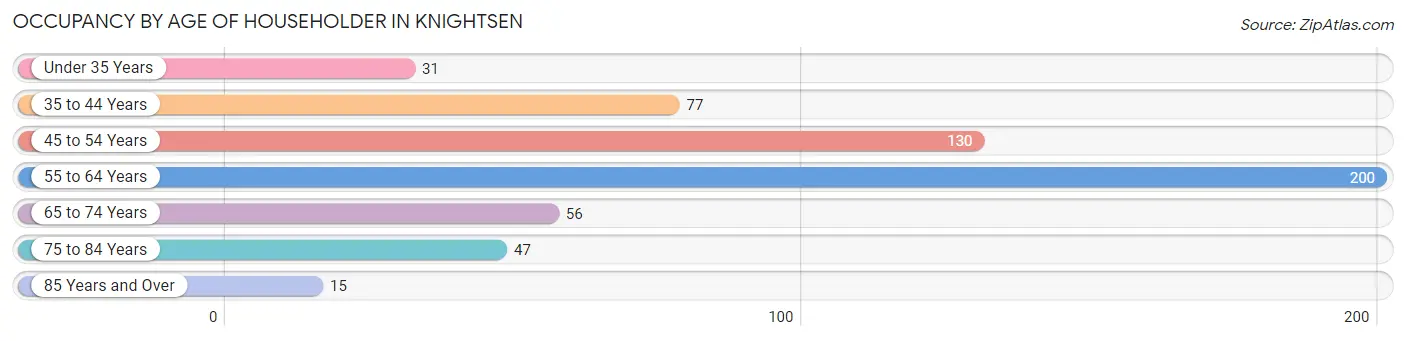
| Age Bracket | # Households | % Households |
| Under 35 Years | 31 | 5.6% |
| 35 to 44 Years | 77 | 13.9% |
| 45 to 54 Years | 130 | 23.4% |
| 55 to 64 Years | 200 | 36.0% |
| 65 to 74 Years | 56 | 10.1% |
| 75 to 84 Years | 47 | 8.5% |
| 85 Years and Over | 15 | 2.7% |
| Total | 556 | 100.0% |
Housing Finances in Knightsen
Median Income by Occupancy in Knightsen
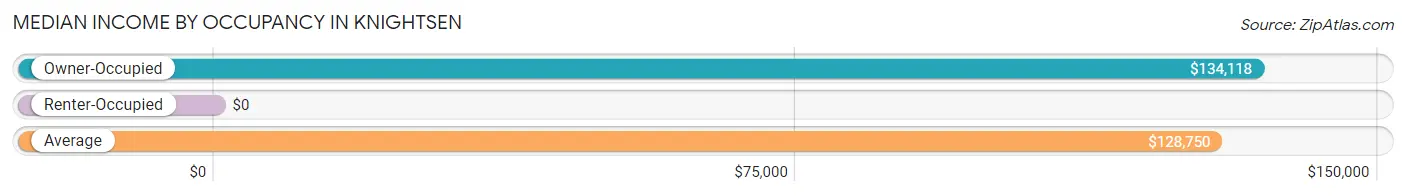
| Occupancy Type | # Households | Median Income |
| Owner-Occupied | 522 (93.9%) | $134,118 |
| Renter-Occupied | 34 (6.1%) | $0 |
| Average | 556 (100.0%) | $128,750 |
Occupancy by Householder Income Bracket in Knightsen
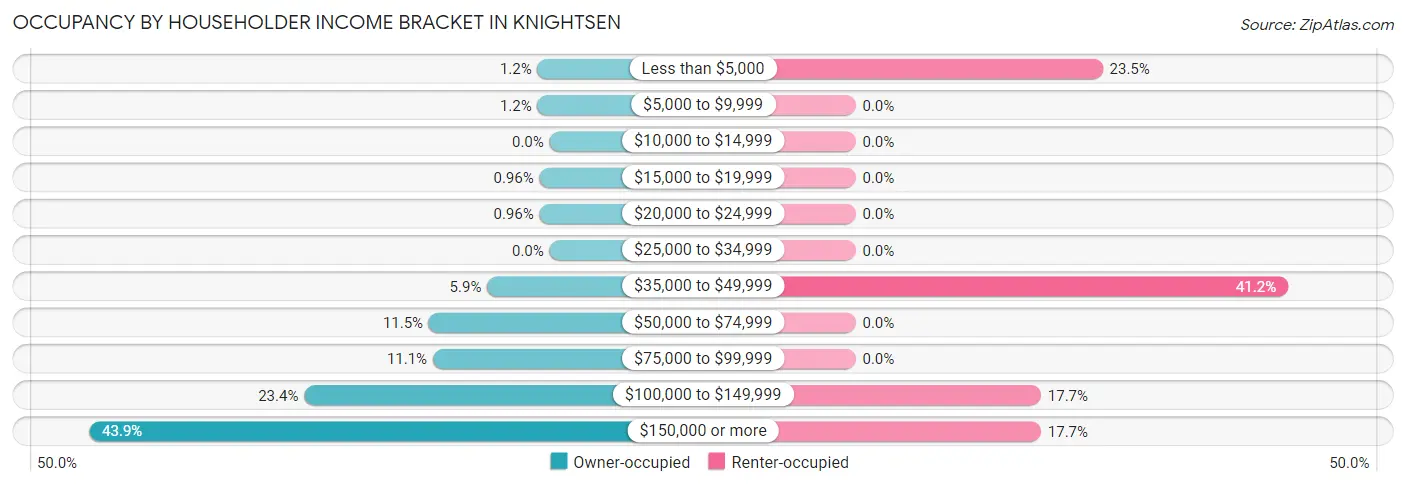
| Income Bracket | Owner-occupied | Renter-occupied |
| Less than $5,000 | 6 (1.1%) | 8 (23.5%) |
| $5,000 to $9,999 | 6 (1.1%) | 0 (0.0%) |
| $10,000 to $14,999 | 0 (0.0%) | 0 (0.0%) |
| $15,000 to $19,999 | 5 (1.0%) | 0 (0.0%) |
| $20,000 to $24,999 | 5 (1.0%) | 0 (0.0%) |
| $25,000 to $34,999 | 0 (0.0%) | 0 (0.0%) |
| $35,000 to $49,999 | 31 (5.9%) | 14 (41.2%) |
| $50,000 to $74,999 | 60 (11.5%) | 0 (0.0%) |
| $75,000 to $99,999 | 58 (11.1%) | 0 (0.0%) |
| $100,000 to $149,999 | 122 (23.4%) | 6 (17.6%) |
| $150,000 or more | 229 (43.9%) | 6 (17.6%) |
| Total | 522 (100.0%) | 34 (100.0%) |
Monthly Housing Cost Tiers in Knightsen
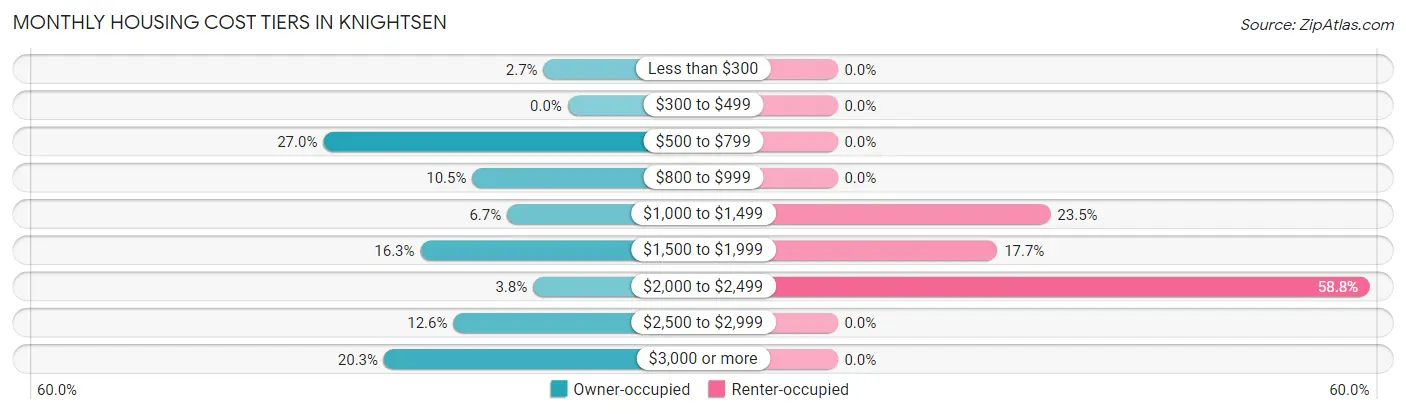
| Monthly Cost | Owner-occupied | Renter-occupied |
| Less than $300 | 14 (2.7%) | 0 (0.0%) |
| $300 to $499 | 0 (0.0%) | 0 (0.0%) |
| $500 to $799 | 141 (27.0%) | 0 (0.0%) |
| $800 to $999 | 55 (10.5%) | 0 (0.0%) |
| $1,000 to $1,499 | 35 (6.7%) | 8 (23.5%) |
| $1,500 to $1,999 | 85 (16.3%) | 6 (17.6%) |
| $2,000 to $2,499 | 20 (3.8%) | 20 (58.8%) |
| $2,500 to $2,999 | 66 (12.6%) | 0 (0.0%) |
| $3,000 or more | 106 (20.3%) | 0 (0.0%) |
| Total | 522 (100.0%) | 34 (100.0%) |
Physical Housing Characteristics in Knightsen
Housing Structures in Knightsen
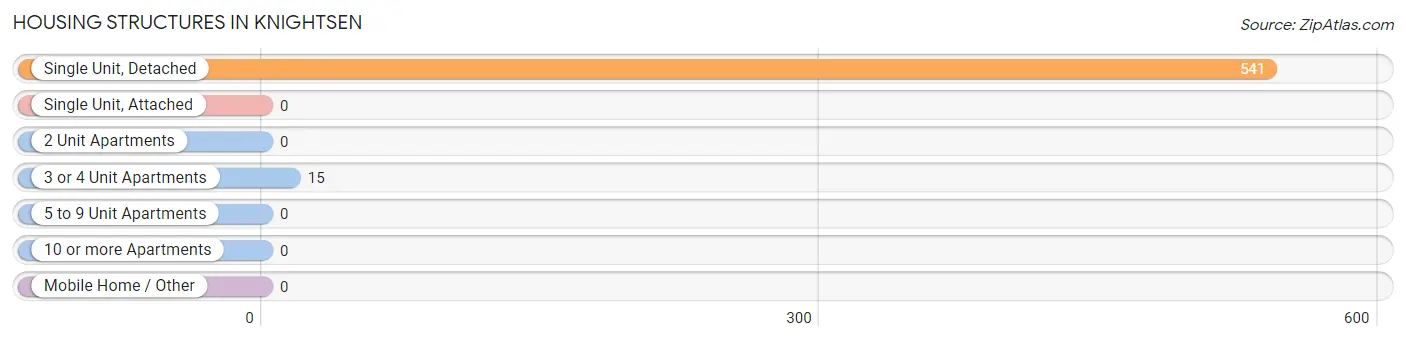
| Structure Type | # Housing Units | % Housing Units |
| Single Unit, Detached | 541 | 97.3% |
| Single Unit, Attached | 0 | 0.0% |
| 2 Unit Apartments | 0 | 0.0% |
| 3 or 4 Unit Apartments | 15 | 2.7% |
| 5 to 9 Unit Apartments | 0 | 0.0% |
| 10 or more Apartments | 0 | 0.0% |
| Mobile Home / Other | 0 | 0.0% |
| Total | 556 | 100.0% |
Housing Structures by Occupancy in Knightsen
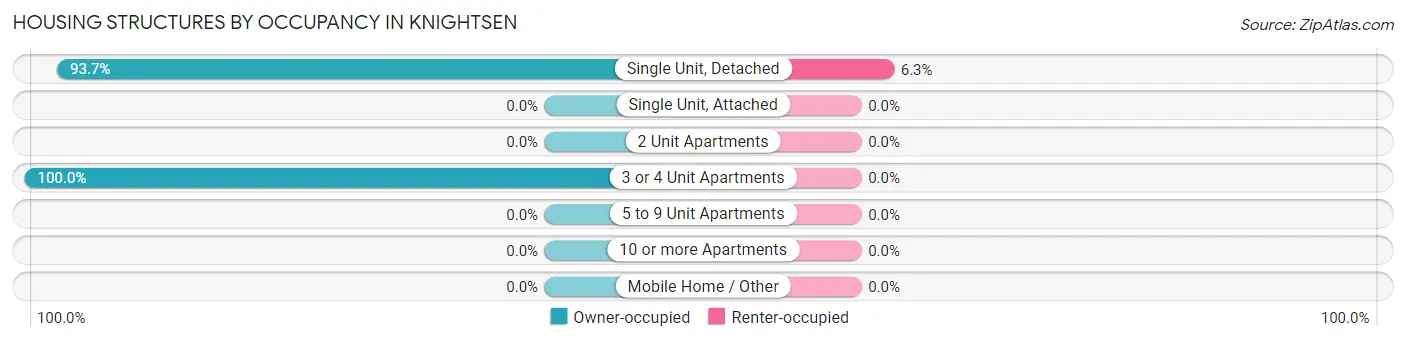
| Structure Type | Owner-occupied | Renter-occupied |
| Single Unit, Detached | 507 (93.7%) | 34 (6.3%) |
| Single Unit, Attached | 0 (0.0%) | 0 (0.0%) |
| 2 Unit Apartments | 0 (0.0%) | 0 (0.0%) |
| 3 or 4 Unit Apartments | 15 (100.0%) | 0 (0.0%) |
| 5 to 9 Unit Apartments | 0 (0.0%) | 0 (0.0%) |
| 10 or more Apartments | 0 (0.0%) | 0 (0.0%) |
| Mobile Home / Other | 0 (0.0%) | 0 (0.0%) |
| Total | 522 (93.9%) | 34 (6.1%) |
Housing Structures by Number of Rooms in Knightsen
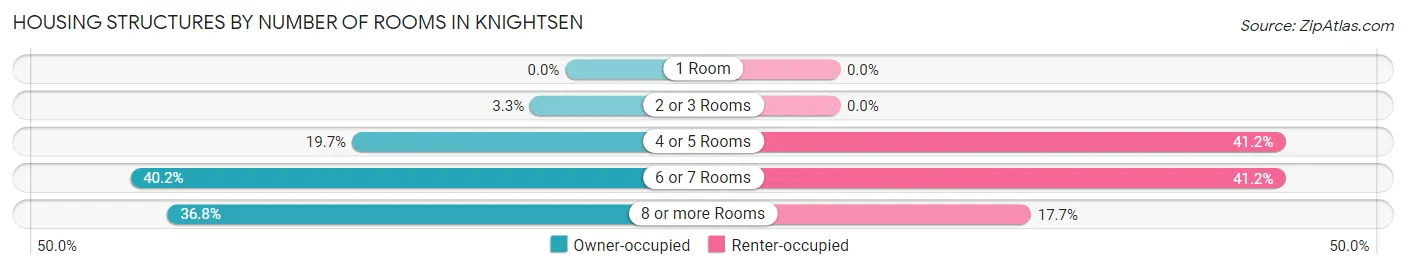
| Number of Rooms | Owner-occupied | Renter-occupied |
| 1 Room | 0 (0.0%) | 0 (0.0%) |
| 2 or 3 Rooms | 17 (3.3%) | 0 (0.0%) |
| 4 or 5 Rooms | 103 (19.7%) | 14 (41.2%) |
| 6 or 7 Rooms | 210 (40.2%) | 14 (41.2%) |
| 8 or more Rooms | 192 (36.8%) | 6 (17.6%) |
| Total | 522 (100.0%) | 34 (100.0%) |
Housing Structure by Heating Type in Knightsen
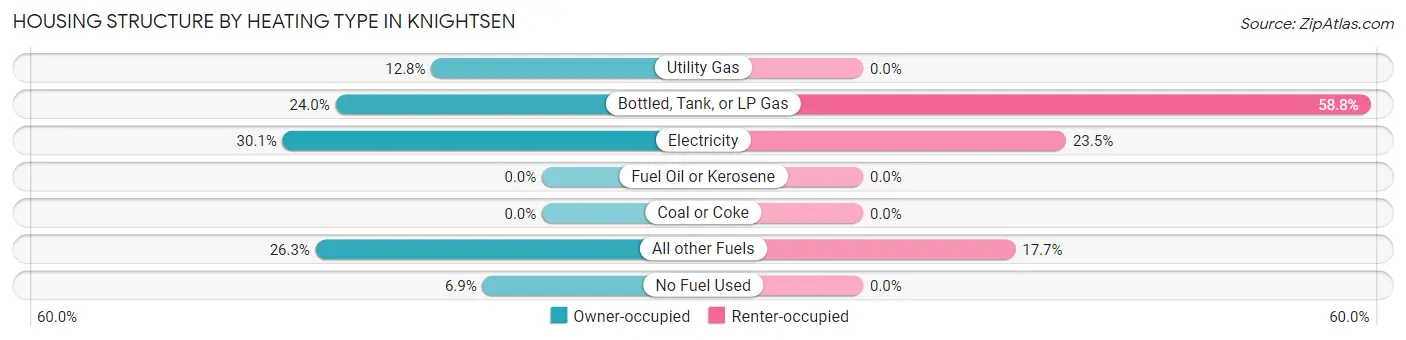
| Heating Type | Owner-occupied | Renter-occupied |
| Utility Gas | 67 (12.8%) | 0 (0.0%) |
| Bottled, Tank, or LP Gas | 125 (23.9%) | 20 (58.8%) |
| Electricity | 157 (30.1%) | 8 (23.5%) |
| Fuel Oil or Kerosene | 0 (0.0%) | 0 (0.0%) |
| Coal or Coke | 0 (0.0%) | 0 (0.0%) |
| All other Fuels | 137 (26.3%) | 6 (17.6%) |
| No Fuel Used | 36 (6.9%) | 0 (0.0%) |
| Total | 522 (100.0%) | 34 (100.0%) |
Household Vehicle Usage in Knightsen
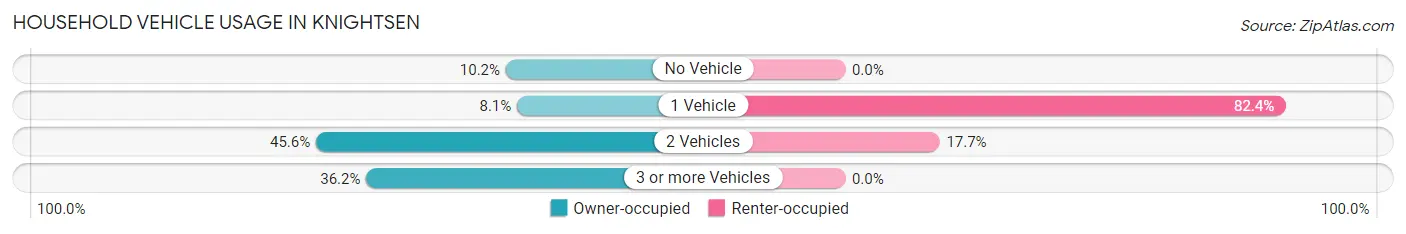
| Vehicles per Household | Owner-occupied | Renter-occupied |
| No Vehicle | 53 (10.2%) | 0 (0.0%) |
| 1 Vehicle | 42 (8.1%) | 28 (82.4%) |
| 2 Vehicles | 238 (45.6%) | 6 (17.6%) |
| 3 or more Vehicles | 189 (36.2%) | 0 (0.0%) |
| Total | 522 (100.0%) | 34 (100.0%) |
Real Estate & Mortgages in Knightsen
Real Estate and Mortgage Overview in Knightsen
| Characteristic | Without Mortgage | With Mortgage |
| Housing Units | 248 | 274 |
| Median Property Value | $1,032,300 | $737,700 |
| Median Household Income | $165,926 | $85 |
| Monthly Housing Costs | $764 | $106 |
| Real Estate Taxes | $3,234 | $6 |
Property Value by Mortgage Status in Knightsen
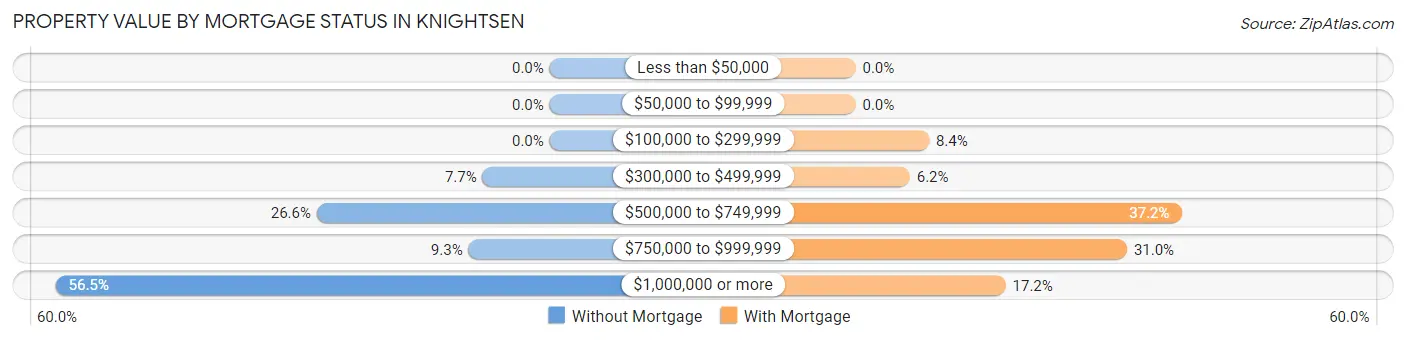
| Property Value | Without Mortgage | With Mortgage |
| Less than $50,000 | 0 (0.0%) | 0 (0.0%) |
| $50,000 to $99,999 | 0 (0.0%) | 0 (0.0%) |
| $100,000 to $299,999 | 0 (0.0%) | 23 (8.4%) |
| $300,000 to $499,999 | 19 (7.7%) | 17 (6.2%) |
| $500,000 to $749,999 | 66 (26.6%) | 102 (37.2%) |
| $750,000 to $999,999 | 23 (9.3%) | 85 (31.0%) |
| $1,000,000 or more | 140 (56.5%) | 47 (17.2%) |
| Total | 248 (100.0%) | 274 (100.0%) |
Household Income by Mortgage Status in Knightsen
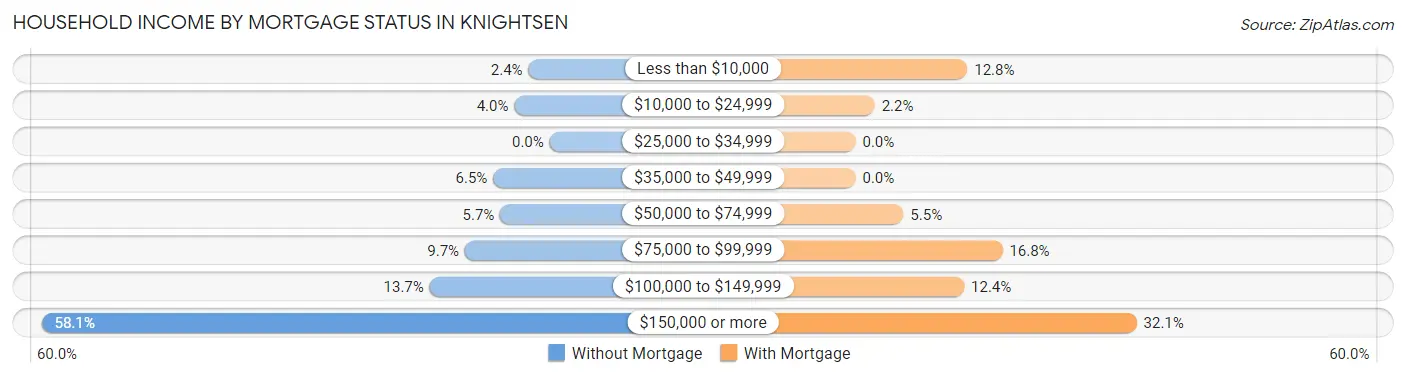
| Household Income | Without Mortgage | With Mortgage |
| Less than $10,000 | 6 (2.4%) | 35 (12.8%) |
| $10,000 to $24,999 | 10 (4.0%) | 6 (2.2%) |
| $25,000 to $34,999 | 0 (0.0%) | 0 (0.0%) |
| $35,000 to $49,999 | 16 (6.5%) | 0 (0.0%) |
| $50,000 to $74,999 | 14 (5.7%) | 15 (5.5%) |
| $75,000 to $99,999 | 24 (9.7%) | 46 (16.8%) |
| $100,000 to $149,999 | 34 (13.7%) | 34 (12.4%) |
| $150,000 or more | 144 (58.1%) | 88 (32.1%) |
| Total | 248 (100.0%) | 274 (100.0%) |
Property Value to Household Income Ratio in Knightsen
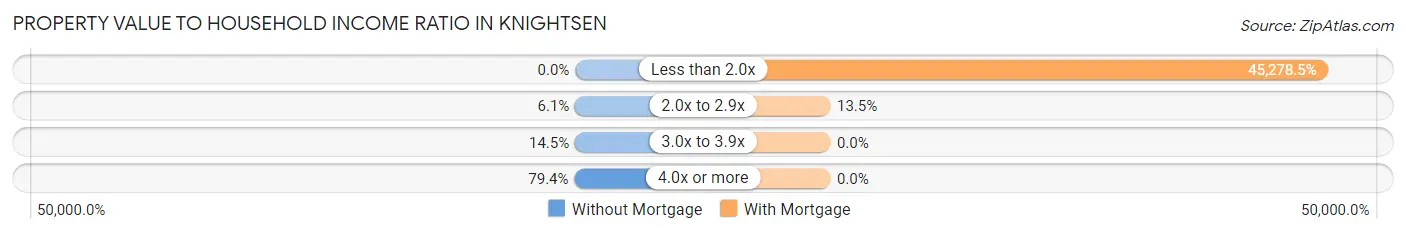
| Value-to-Income Ratio | Without Mortgage | With Mortgage |
| Less than 2.0x | 0 (0.0%) | 124,063 (45,278.5%) |
| 2.0x to 2.9x | 15 (6.0%) | 37 (13.5%) |
| 3.0x to 3.9x | 36 (14.5%) | 0 (0.0%) |
| 4.0x or more | 197 (79.4%) | 0 (0.0%) |
| Total | 248 (100.0%) | 274 (100.0%) |
Real Estate Taxes by Mortgage Status in Knightsen
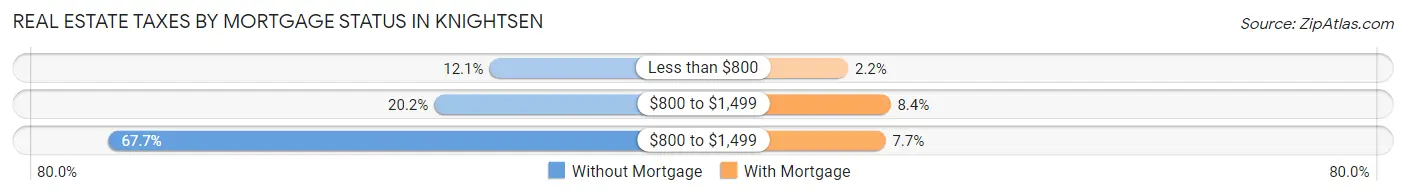
| Property Taxes | Without Mortgage | With Mortgage |
| Less than $800 | 30 (12.1%) | 6 (2.2%) |
| $800 to $1,499 | 50 (20.2%) | 23 (8.4%) |
| $800 to $1,499 | 168 (67.7%) | 21 (7.7%) |
| Total | 248 (100.0%) | 274 (100.0%) |
Health & Disability in Knightsen
Health Insurance Coverage by Age in Knightsen
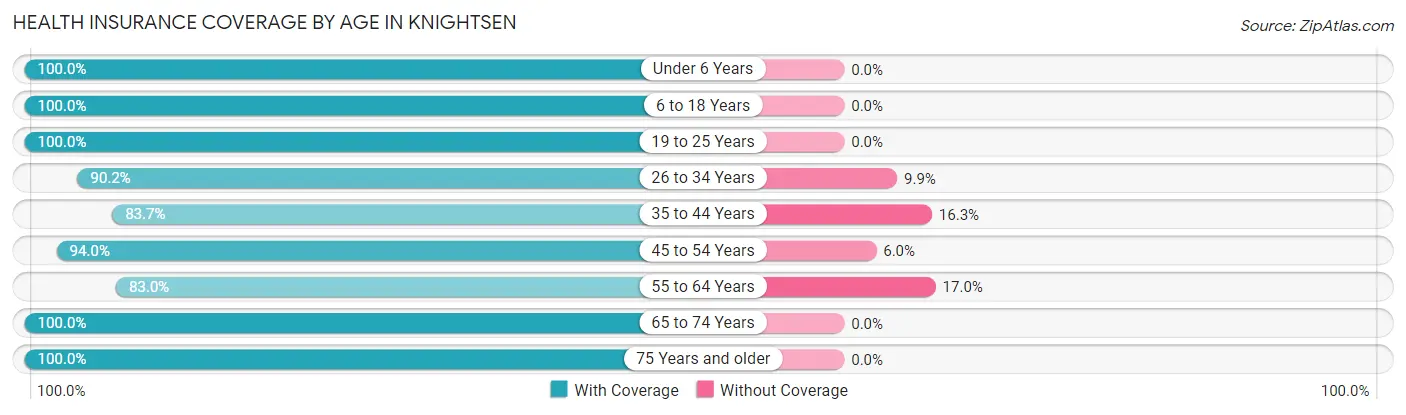
| Age Bracket | With Coverage | Without Coverage |
| Under 6 Years | 206 (100.0%) | 0 (0.0%) |
| 6 to 18 Years | 154 (100.0%) | 0 (0.0%) |
| 19 to 25 Years | 95 (100.0%) | 0 (0.0%) |
| 26 to 34 Years | 183 (90.1%) | 20 (9.9%) |
| 35 to 44 Years | 169 (83.7%) | 33 (16.3%) |
| 45 to 54 Years | 205 (94.0%) | 13 (6.0%) |
| 55 to 64 Years | 258 (83.0%) | 53 (17.0%) |
| 65 to 74 Years | 129 (100.0%) | 0 (0.0%) |
| 75 Years and older | 128 (100.0%) | 0 (0.0%) |
| Total | 1,527 (92.8%) | 119 (7.2%) |
Health Insurance Coverage by Citizenship Status in Knightsen
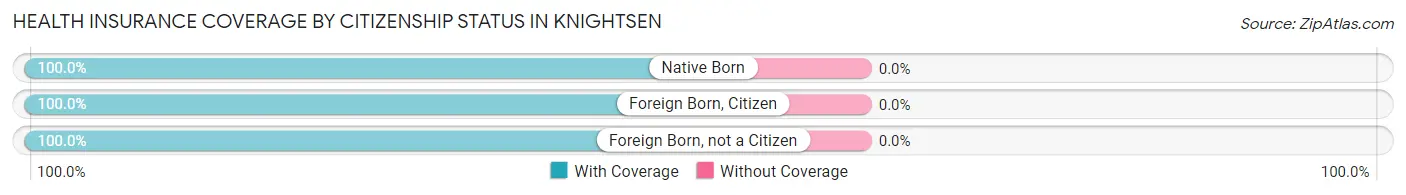
| Citizenship Status | With Coverage | Without Coverage |
| Native Born | 206 (100.0%) | 0 (0.0%) |
| Foreign Born, Citizen | 154 (100.0%) | 0 (0.0%) |
| Foreign Born, not a Citizen | 95 (100.0%) | 0 (0.0%) |
Health Insurance Coverage by Household Income in Knightsen
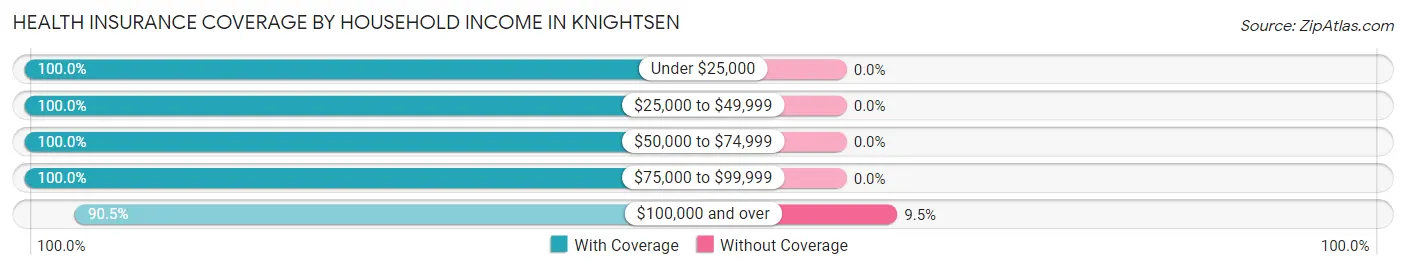
| Household Income | With Coverage | Without Coverage |
| Under $25,000 | 36 (100.0%) | 0 (0.0%) |
| $25,000 to $49,999 | 76 (100.0%) | 0 (0.0%) |
| $50,000 to $74,999 | 150 (100.0%) | 0 (0.0%) |
| $75,000 to $99,999 | 127 (100.0%) | 0 (0.0%) |
| $100,000 and over | 1,138 (90.5%) | 119 (9.5%) |
Public vs Private Health Insurance Coverage by Age in Knightsen
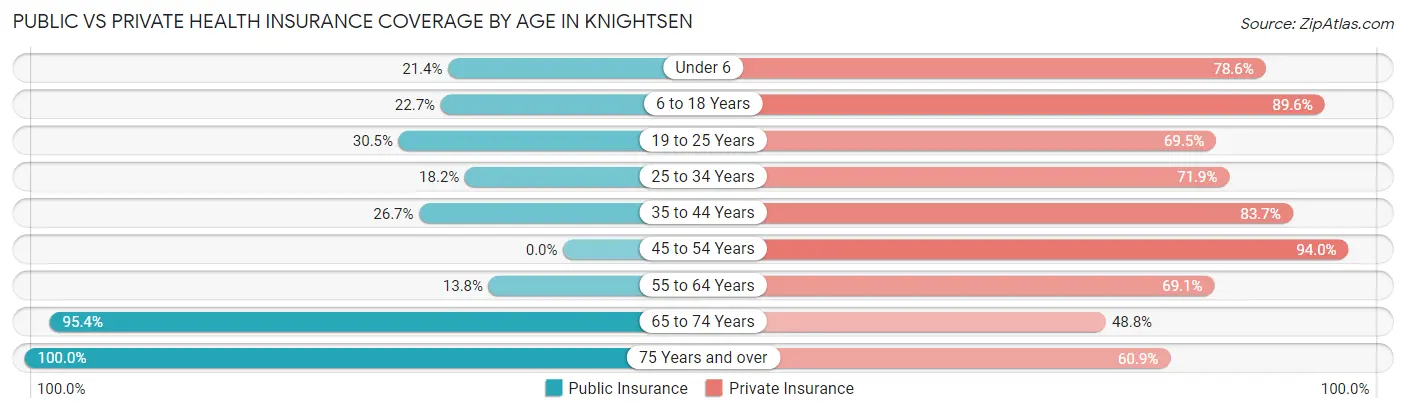
| Age Bracket | Public Insurance | Private Insurance |
| Under 6 | 44 (21.4%) | 162 (78.6%) |
| 6 to 18 Years | 35 (22.7%) | 138 (89.6%) |
| 19 to 25 Years | 29 (30.5%) | 66 (69.5%) |
| 25 to 34 Years | 37 (18.2%) | 146 (71.9%) |
| 35 to 44 Years | 54 (26.7%) | 169 (83.7%) |
| 45 to 54 Years | 0 (0.0%) | 205 (94.0%) |
| 55 to 64 Years | 43 (13.8%) | 215 (69.1%) |
| 65 to 74 Years | 123 (95.4%) | 63 (48.8%) |
| 75 Years and over | 128 (100.0%) | 78 (60.9%) |
| Total | 493 (29.9%) | 1,242 (75.5%) |
Disability Status by Sex by Age in Knightsen
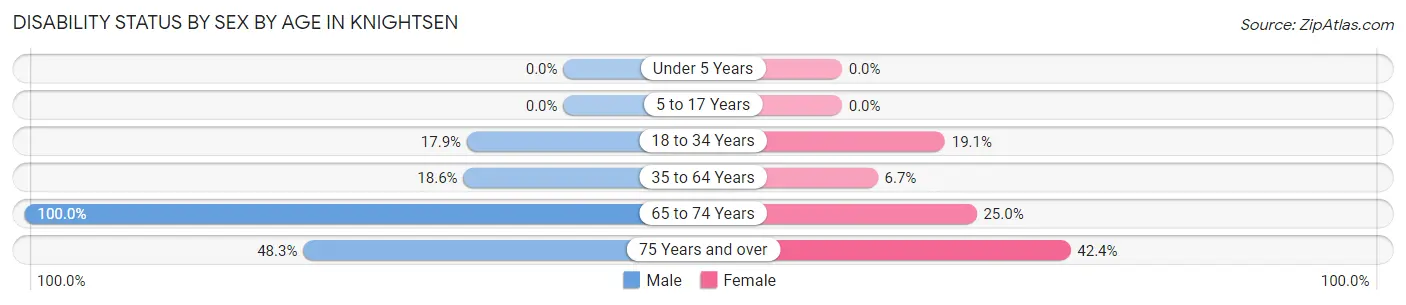
| Age Bracket | Male | Female |
| Under 5 Years | 0 (0.0%) | 0 (0.0%) |
| 5 to 17 Years | 0 (0.0%) | 0 (0.0%) |
| 18 to 34 Years | 29 (17.9%) | 26 (19.1%) |
| 35 to 64 Years | 77 (18.5%) | 21 (6.7%) |
| 65 to 74 Years | 73 (100.0%) | 14 (25.0%) |
| 75 Years and over | 14 (48.3%) | 42 (42.4%) |
Disability Class by Sex by Age in Knightsen
Disability Class: Hearing Difficulty
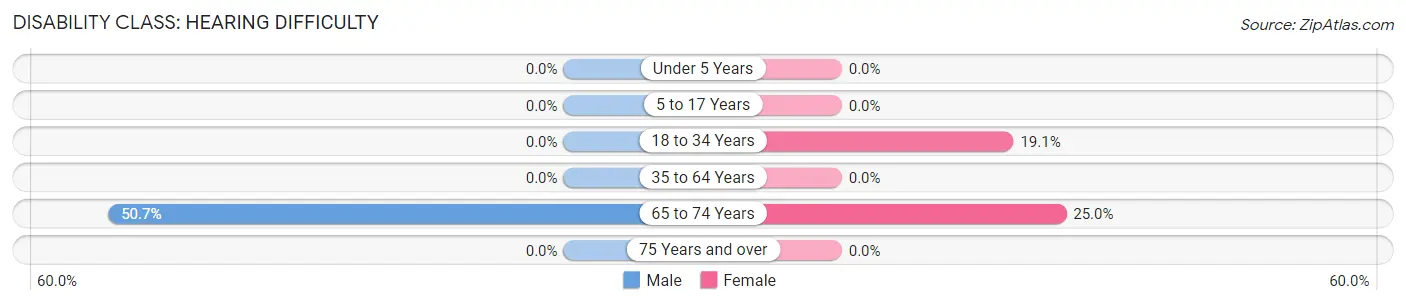
| Age Bracket | Male | Female |
| Under 5 Years | 0 (0.0%) | 0 (0.0%) |
| 5 to 17 Years | 0 (0.0%) | 0 (0.0%) |
| 18 to 34 Years | 0 (0.0%) | 26 (19.1%) |
| 35 to 64 Years | 0 (0.0%) | 0 (0.0%) |
| 65 to 74 Years | 37 (50.7%) | 14 (25.0%) |
| 75 Years and over | 0 (0.0%) | 0 (0.0%) |
Disability Class: Vision Difficulty
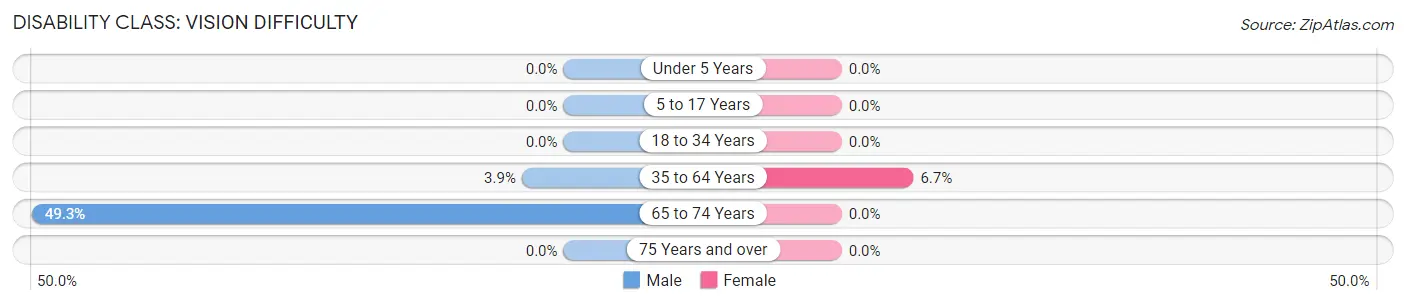
| Age Bracket | Male | Female |
| Under 5 Years | 0 (0.0%) | 0 (0.0%) |
| 5 to 17 Years | 0 (0.0%) | 0 (0.0%) |
| 18 to 34 Years | 0 (0.0%) | 0 (0.0%) |
| 35 to 64 Years | 16 (3.9%) | 21 (6.7%) |
| 65 to 74 Years | 36 (49.3%) | 0 (0.0%) |
| 75 Years and over | 0 (0.0%) | 0 (0.0%) |
Disability Class: Cognitive Difficulty
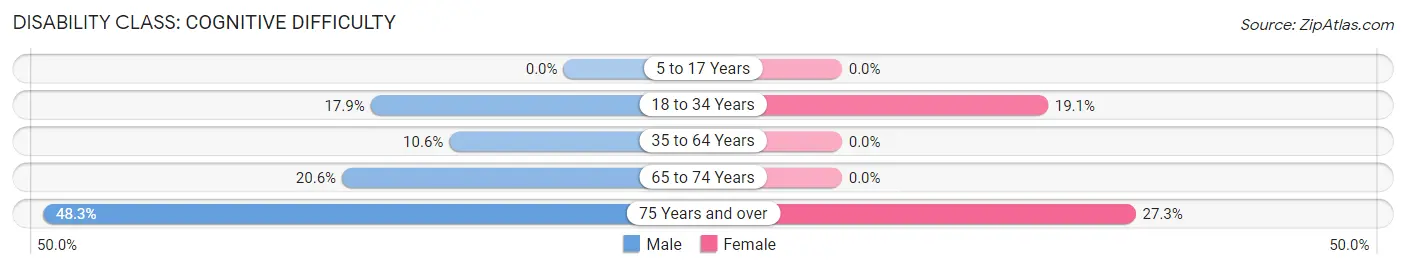
| Age Bracket | Male | Female |
| 5 to 17 Years | 0 (0.0%) | 0 (0.0%) |
| 18 to 34 Years | 29 (17.9%) | 26 (19.1%) |
| 35 to 64 Years | 44 (10.6%) | 0 (0.0%) |
| 65 to 74 Years | 15 (20.5%) | 0 (0.0%) |
| 75 Years and over | 14 (48.3%) | 27 (27.3%) |
Disability Class: Ambulatory Difficulty
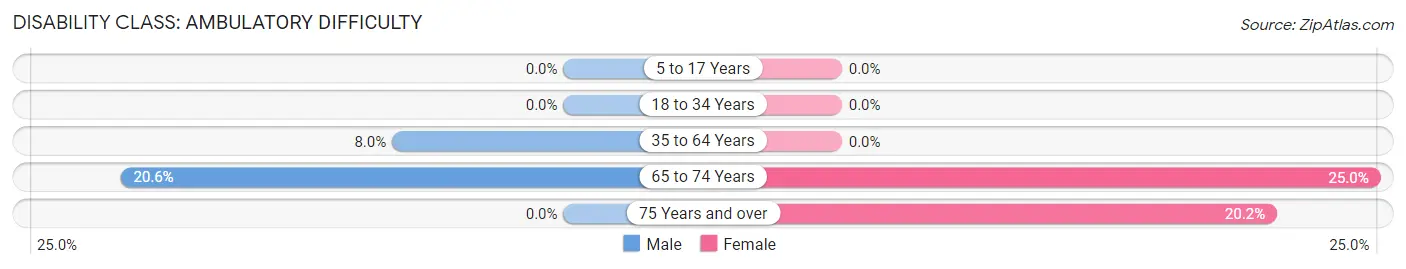
| Age Bracket | Male | Female |
| 5 to 17 Years | 0 (0.0%) | 0 (0.0%) |
| 18 to 34 Years | 0 (0.0%) | 0 (0.0%) |
| 35 to 64 Years | 33 (8.0%) | 0 (0.0%) |
| 65 to 74 Years | 15 (20.5%) | 14 (25.0%) |
| 75 Years and over | 0 (0.0%) | 20 (20.2%) |
Disability Class: Self-Care Difficulty
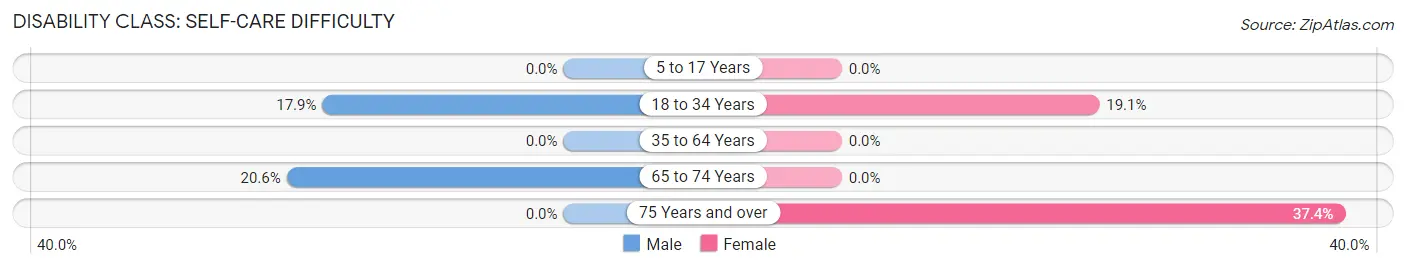
| Age Bracket | Male | Female |
| 5 to 17 Years | 0 (0.0%) | 0 (0.0%) |
| 18 to 34 Years | 29 (17.9%) | 26 (19.1%) |
| 35 to 64 Years | 0 (0.0%) | 0 (0.0%) |
| 65 to 74 Years | 15 (20.5%) | 0 (0.0%) |
| 75 Years and over | 0 (0.0%) | 37 (37.4%) |
Technology Access in Knightsen
Computing Device Access in Knightsen
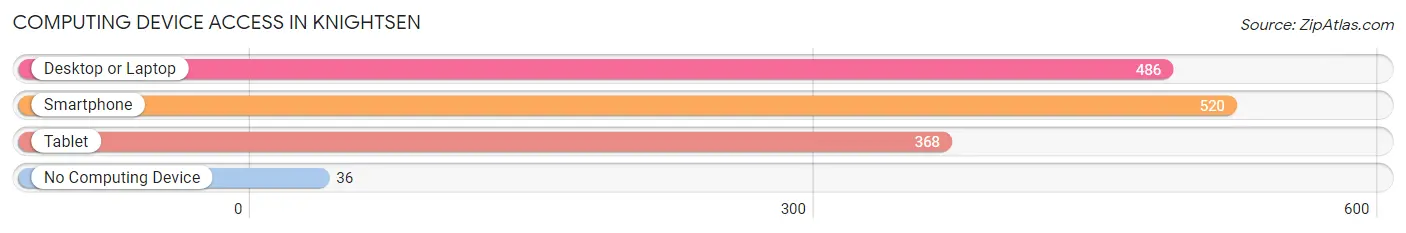
| Device Type | # Households | % Households |
| Desktop or Laptop | 486 | 87.4% |
| Smartphone | 520 | 93.5% |
| Tablet | 368 | 66.2% |
| No Computing Device | 36 | 6.5% |
| Total | 556 | 100.0% |
Internet Access in Knightsen
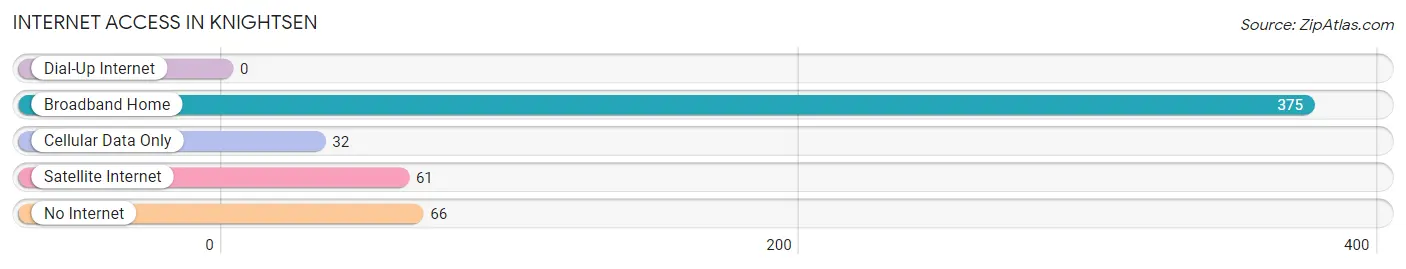
| Internet Type | # Households | % Households |
| Dial-Up Internet | 0 | 0.0% |
| Broadband Home | 375 | 67.4% |
| Cellular Data Only | 32 | 5.8% |
| Satellite Internet | 61 | 11.0% |
| No Internet | 66 | 11.9% |
| Total | 556 | 100.0% |
Knightsen Summary
Knightsen is an unincorporated community located in Contra Costa County, California. It is situated in the East Bay region of the San Francisco Bay Area, approximately 25 miles east of Oakland. The population of Knightsen was estimated to be 1,890 in 2019.
History
The area now known as Knightsen was originally inhabited by the Ohlone people, who lived in the area for thousands of years before the arrival of Europeans. The first Europeans to settle in the area were Spanish missionaries, who established a mission in nearby San Jose in 1777.
In the mid-1800s, the area was settled by ranchers and farmers, who established small farms and ranches. The town of Knightsen was founded in 1878 by William Knight, who purchased a large tract of land in the area. The town was named after him and was originally a small farming community.
Geography
Knightsen is located in the East Bay region of the San Francisco Bay Area, approximately 25 miles east of Oakland. It is situated in the foothills of the Diablo Range, at an elevation of approximately 200 feet. The town is bordered by the cities of Brentwood to the north, Discovery Bay to the east, and Byron to the south.
The climate in Knightsen is Mediterranean, with hot, dry summers and mild, wet winters. The average annual temperature is approximately 60°F, with an average high of 75°F in the summer and an average low of 45°F in the winter.
Economy
The economy of Knightsen is largely based on agriculture and ranching. The town is home to several small farms and ranches, which produce a variety of crops and livestock. The town is also home to several small businesses, including a gas station, a grocery store, and a few restaurants.
Demographics
As of 2019, the population of Knightsen was estimated to be 1,890. The racial makeup of the town was 79.3% White, 8.2% Hispanic or Latino, 6.2% Asian, 4.2% African American, and 2.1% other. The median household income was $90,945, and the median home value was $637,500.
Conclusion
Knightsen is a small unincorporated community located in Contra Costa County, California. It is situated in the East Bay region of the San Francisco Bay Area, approximately 25 miles east of Oakland. The town was founded in 1878 and is home to several small farms and ranches, as well as a few small businesses. The population of Knightsen was estimated to be 1,890 in 2019, and the median household income was $90,945.
Common Questions
What is Per Capita Income in Knightsen?
Per Capita income in Knightsen is $50,613.
What is the Median Family Income in Knightsen?
Median Family Income in Knightsen is $133,269.
What is the Median Household income in Knightsen?
Median Household Income in Knightsen is $128,750.
What is Income or Wage Gap in Knightsen?
Income or Wage Gap in Knightsen is 52.7%.
Women in Knightsen earn 47.3 cents for every dollar earned by a man.
What is Inequality or Gini Index in Knightsen?
Inequality or Gini Index in Knightsen is 0.35.
What is the Total Population of Knightsen?
Total Population of Knightsen is 1,646.
What is the Total Male Population of Knightsen?
Total Male Population of Knightsen is 859.
What is the Total Female Population of Knightsen?
Total Female Population of Knightsen is 787.
What is the Ratio of Males per 100 Females in Knightsen?
There are 109.15 Males per 100 Females in Knightsen.
What is the Ratio of Females per 100 Males in Knightsen?
There are 91.62 Females per 100 Males in Knightsen.
What is the Median Population Age in Knightsen?
Median Population Age in Knightsen is 39.5 Years.
What is the Average Family Size in Knightsen
Average Family Size in Knightsen is 3.4 People.
What is the Average Household Size in Knightsen
Average Household Size in Knightsen is 3.0 People.
How Large is the Labor Force in Knightsen?
There are 811 People in the Labor Forcein in Knightsen.
What is the Percentage of People in the Labor Force in Knightsen?
59.8% of People are in the Labor Force in Knightsen.
What is the Unemployment Rate in Knightsen?
Unemployment Rate in Knightsen is 6.5%.