Cities with the Highest Percentage of Households Heated without Fuel in Massachusetts
RELATED REPORTS & OPTIONS
Fuel-less Heating
Massachusetts
Compare Cities
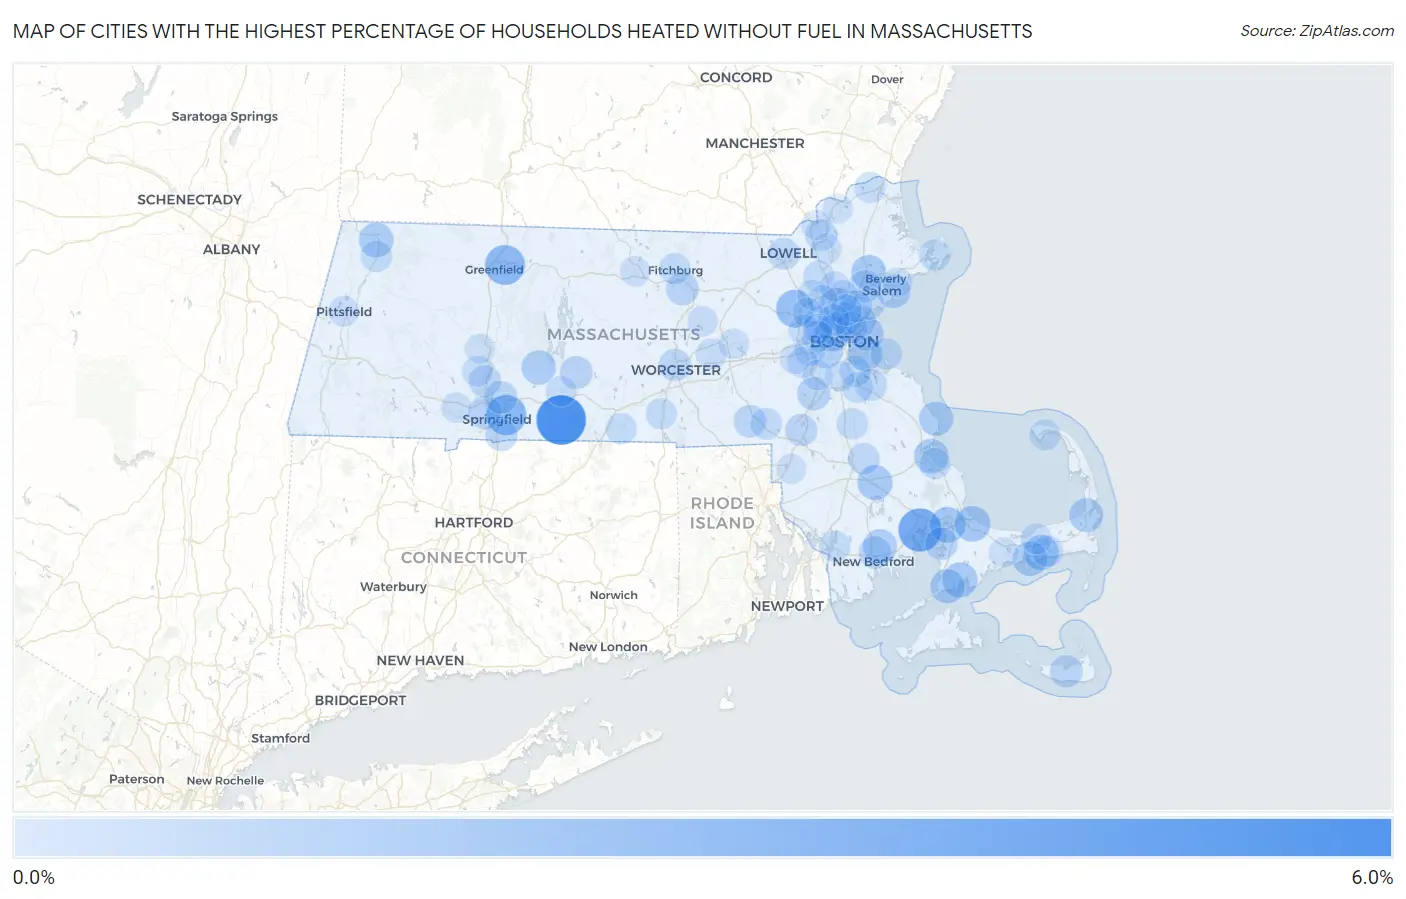
Map of Cities with the Highest Percentage of Households Heated without Fuel in Massachusetts
0.0%
6.0%
Cities with the Highest Percentage of Households Heated without Fuel in Massachusetts
| City | Fuel-less Heating | vs State | vs National | |
| 1. | Monson Center | 5.9% | 0.60%(+5.30)#1 | 1.2%(+4.70)#909 |
| 2. | Weweantic | 4.0% | 0.60%(+3.40)#2 | 1.2%(+2.80)#1,278 |
| 3. | Springfield | 3.1% | 0.60%(+2.50)#3 | 1.2%(+1.90)#1,554 |
| 4. | Turners Falls | 3.0% | 0.60%(+2.40)#4 | 1.2%(+1.80)#1,630 |
| 5. | Hanscom Afb | 2.4% | 0.60%(+1.80)#5 | 1.2%(+1.20)#2,030 |
| 6. | Buzzards Bay | 1.8% | 0.60%(+1.20)#6 | 1.2%(+0.600)#2,763 |
| 7. | Sandwich | 1.8% | 0.60%(+1.20)#7 | 1.2%(+0.600)#2,764 |
| 8. | Cambridge | 1.7% | 0.60%(+1.10)#8 | 1.2%(+0.500)#2,865 |
| 9. | Danvers | 1.6% | 0.60%(+1.000)#9 | 1.2%(+0.400)#3,031 |
| 10. | South Yarmouth | 1.6% | 0.60%(+1.000)#10 | 1.2%(+0.400)#3,060 |
| 11. | Middleborough Center | 1.6% | 0.60%(+1.000)#11 | 1.2%(+0.400)#3,076 |
| 12. | East Falmouth | 1.6% | 0.60%(+1.000)#12 | 1.2%(+0.400)#3,080 |
| 13. | Boston | 1.5% | 0.60%(+0.900)#13 | 1.2%(+0.300)#3,209 |
| 14. | North Adams | 1.5% | 0.60%(+0.900)#14 | 1.2%(+0.300)#3,254 |
| 15. | West Yarmouth | 1.5% | 0.60%(+0.900)#15 | 1.2%(+0.300)#3,283 |
| 16. | North Plymouth | 1.5% | 0.60%(+0.900)#16 | 1.2%(+0.300)#3,301 |
| 17. | Winthrop Town | 1.4% | 0.60%(+0.800)#17 | 1.2%(+0.200)#3,456 |
| 18. | Ocean Bluff Brant Rock | 1.4% | 0.60%(+0.800)#18 | 1.2%(+0.200)#3,527 |
| 19. | Falmouth | 1.4% | 0.60%(+0.800)#19 | 1.2%(+0.200)#3,533 |
| 20. | Belchertown | 1.4% | 0.60%(+0.800)#20 | 1.2%(+0.200)#3,558 |
| 21. | Somerville | 1.3% | 0.60%(+0.700)#21 | 1.2%(+0.100)#3,654 |
| 22. | Stoneham | 1.3% | 0.60%(+0.700)#22 | 1.2%(+0.100)#3,683 |
| 23. | Acushnet Center | 1.3% | 0.60%(+0.700)#23 | 1.2%(+0.100)#3,785 |
| 24. | Orleans | 1.3% | 0.60%(+0.700)#24 | 1.2%(+0.100)#3,819 |
| 25. | Brookline | 1.2% | 0.60%(+0.600)#25 | 1.2%(=0.000)#3,908 |
| 26. | Salem | 1.2% | 0.60%(+0.600)#26 | 1.2%(=0.000)#3,916 |
| 27. | Norwood | 1.1% | 0.60%(+0.500)#27 | 1.2%(-0.100)#4,217 |
| 28. | West Springfield Town | 1.1% | 0.60%(+0.500)#28 | 1.2%(-0.100)#4,224 |
| 29. | Leominster | 1.0% | 0.60%(+0.400)#29 | 1.2%(-0.200)#4,541 |
| 30. | Amherst | 1.0% | 0.60%(+0.400)#30 | 1.2%(-0.200)#4,549 |
| 31. | Ware | 1.0% | 0.60%(+0.400)#31 | 1.2%(-0.200)#4,677 |
| 32. | New Bedford | 0.90% | 0.60%(+0.300)#32 | 1.2%(-0.300)#4,924 |
| 33. | Chicopee | 0.90% | 0.60%(+0.300)#33 | 1.2%(-0.300)#4,943 |
| 34. | Peabody | 0.90% | 0.60%(+0.300)#34 | 1.2%(-0.300)#4,945 |
| 35. | Nantucket | 0.90% | 0.60%(+0.300)#35 | 1.2%(-0.300)#5,064 |
| 36. | Bellingham | 0.90% | 0.60%(+0.300)#36 | 1.2%(-0.300)#5,129 |
| 37. | Pocasset | 0.90% | 0.60%(+0.300)#37 | 1.2%(-0.300)#5,194 |
| 38. | Worcester | 0.80% | 0.60%(+0.200)#38 | 1.2%(-0.400)#5,336 |
| 39. | Malden | 0.80% | 0.60%(+0.200)#39 | 1.2%(-0.400)#5,365 |
| 40. | Revere | 0.80% | 0.60%(+0.200)#40 | 1.2%(-0.400)#5,370 |
| 41. | Arlington | 0.80% | 0.60%(+0.200)#41 | 1.2%(-0.400)#5,382 |
| 42. | Holyoke | 0.80% | 0.60%(+0.200)#42 | 1.2%(-0.400)#5,390 |
| 43. | Longmeadow | 0.80% | 0.60%(+0.200)#43 | 1.2%(-0.400)#5,463 |
| 44. | Foxborough | 0.80% | 0.60%(+0.200)#44 | 1.2%(-0.400)#5,558 |
| 45. | Lowell | 0.70% | 0.60%(+0.100)#45 | 1.2%(-0.500)#5,878 |
| 46. | Lynn | 0.70% | 0.60%(+0.100)#46 | 1.2%(-0.500)#5,883 |
| 47. | Lawrence | 0.70% | 0.60%(+0.100)#47 | 1.2%(-0.500)#5,888 |
| 48. | Weymouth Town | 0.70% | 0.60%(+0.100)#48 | 1.2%(-0.500)#5,912 |
| 49. | Chelsea | 0.70% | 0.60%(+0.100)#49 | 1.2%(-0.500)#5,929 |
| 50. | Saugus | 0.70% | 0.60%(+0.100)#50 | 1.2%(-0.500)#5,962 |
| 51. | Bridgewater Town | 0.70% | 0.60%(+0.100)#51 | 1.2%(-0.500)#5,963 |
| 52. | Wakefield | 0.70% | 0.60%(+0.100)#52 | 1.2%(-0.500)#5,971 |
| 53. | Greenfield | 0.70% | 0.60%(+0.100)#53 | 1.2%(-0.500)#6,018 |
| 54. | Brockton | 0.60% | 0.60%(=0.000)#54 | 1.2%(-0.600)#6,470 |
| 55. | Quincy | 0.60% | 0.60%(=0.000)#55 | 1.2%(-0.600)#6,471 |
| 56. | Medford | 0.60% | 0.60%(=0.000)#56 | 1.2%(-0.600)#6,490 |
| 57. | Fitchburg | 0.60% | 0.60%(=0.000)#57 | 1.2%(-0.600)#6,518 |
| 58. | Franklin Town | 0.60% | 0.60%(=0.000)#58 | 1.2%(-0.600)#6,536 |
| 59. | Gloucester | 0.60% | 0.60%(=0.000)#59 | 1.2%(-0.600)#6,546 |
| 60. | Melrose | 0.60% | 0.60%(=0.000)#60 | 1.2%(-0.600)#6,547 |
| 61. | Hull | 0.60% | 0.60%(=0.000)#61 | 1.2%(-0.600)#6,702 |
| 62. | Adams | 0.60% | 0.60%(=0.000)#62 | 1.2%(-0.600)#6,784 |
| 63. | West Dennis | 0.60% | 0.60%(=0.000)#63 | 1.2%(-0.600)#6,861 |
| 64. | Fall River | 0.50% | 0.60%(-0.100)#64 | 1.2%(-0.700)#7,140 |
| 65. | Newton | 0.50% | 0.60%(-0.100)#65 | 1.2%(-0.700)#7,145 |
| 66. | Braintree Town | 0.50% | 0.60%(-0.100)#66 | 1.2%(-0.700)#7,215 |
| 67. | Watertown Town | 0.50% | 0.60%(-0.100)#67 | 1.2%(-0.700)#7,227 |
| 68. | Wilmington | 0.50% | 0.60%(-0.100)#68 | 1.2%(-0.700)#7,267 |
| 69. | Southbridge Town | 0.50% | 0.60%(-0.100)#69 | 1.2%(-0.700)#7,301 |
| 70. | Amesbury Town | 0.50% | 0.60%(-0.100)#70 | 1.2%(-0.700)#7,305 |
| 71. | Plymouth | 0.50% | 0.60%(-0.100)#71 | 1.2%(-0.700)#7,425 |
| 72. | Oxford | 0.50% | 0.60%(-0.100)#72 | 1.2%(-0.700)#7,476 |
| 73. | Provincetown | 0.50% | 0.60%(-0.100)#73 | 1.2%(-0.700)#7,534 |
| 74. | Waltham | 0.40% | 0.60%(-0.200)#74 | 1.2%(-0.800)#7,857 |
| 75. | Needham | 0.40% | 0.60%(-0.200)#75 | 1.2%(-0.800)#7,925 |
| 76. | Burlington | 0.40% | 0.60%(-0.200)#76 | 1.2%(-0.800)#7,950 |
| 77. | Easthampton Town | 0.40% | 0.60%(-0.200)#77 | 1.2%(-0.800)#8,016 |
| 78. | Palmer Town | 0.40% | 0.60%(-0.200)#78 | 1.2%(-0.800)#8,064 |
| 79. | Northborough | 0.40% | 0.60%(-0.200)#79 | 1.2%(-0.800)#8,171 |
| 80. | Yarmouth Port | 0.40% | 0.60%(-0.200)#80 | 1.2%(-0.800)#8,191 |
| 81. | Pittsfield | 0.30% | 0.60%(-0.300)#81 | 1.2%(-0.900)#8,522 |
| 82. | Marlborough | 0.30% | 0.60%(-0.300)#82 | 1.2%(-0.900)#8,527 |
| 83. | Westfield | 0.30% | 0.60%(-0.300)#83 | 1.2%(-0.900)#8,530 |
| 84. | Wellesley | 0.30% | 0.60%(-0.300)#84 | 1.2%(-0.900)#8,571 |
| 85. | Reading | 0.30% | 0.60%(-0.300)#85 | 1.2%(-0.900)#8,604 |
| 86. | Dedham | 0.30% | 0.60%(-0.300)#86 | 1.2%(-0.900)#8,609 |
| 87. | Gardner | 0.30% | 0.60%(-0.300)#87 | 1.2%(-0.900)#8,642 |
| 88. | Andover | 0.30% | 0.60%(-0.300)#88 | 1.2%(-0.900)#8,808 |
| 89. | Clinton | 0.30% | 0.60%(-0.300)#89 | 1.2%(-0.900)#8,882 |
| 90. | Haverhill | 0.20% | 0.60%(-0.400)#90 | 1.2%(-1.000)#9,105 |
| 91. | Methuen Town | 0.20% | 0.60%(-0.400)#91 | 1.2%(-1.000)#9,128 |
| 92. | Barnstable Town | 0.20% | 0.60%(-0.400)#92 | 1.2%(-1.000)#9,136 |
| 93. | Attleboro | 0.20% | 0.60%(-0.400)#93 | 1.2%(-1.000)#9,141 |
| 94. | Beverly | 0.20% | 0.60%(-0.400)#94 | 1.2%(-1.000)#9,152 |
| 95. | Woburn | 0.20% | 0.60%(-0.400)#95 | 1.2%(-1.000)#9,157 |
| 96. | Lexington | 0.20% | 0.60%(-0.400)#96 | 1.2%(-1.000)#9,178 |
| 97. | North Attleborough | 0.20% | 0.60%(-0.400)#97 | 1.2%(-1.000)#9,197 |
| 98. | Milton | 0.20% | 0.60%(-0.400)#98 | 1.2%(-1.000)#9,212 |
| 99. | Northampton | 0.20% | 0.60%(-0.400)#99 | 1.2%(-1.000)#9,213 |
| 100. | Belmont | 0.20% | 0.60%(-0.400)#100 | 1.2%(-1.000)#9,223 |
Common Questions
What are the Top 10 Cities with the Highest Percentage of Households Heated without Fuel in Massachusetts?
Top 10 Cities with the Highest Percentage of Households Heated without Fuel in Massachusetts are:
#1
5.9%
#2
4.0%
#3
3.1%
#4
3.0%
#5
2.4%
#6
1.8%
#7
1.8%
#8
1.7%
#9
1.6%
#10
1.6%
What city has the Highest Percentage of Households Heated without Fuel in Massachusetts?
Monson Center has the Highest Percentage of Households Heated without Fuel in Massachusetts with 5.9%.
What is the Percentage of Households Heated without Fuel in the State of Massachusetts?
Percentage of Households Heated without Fuel in Massachusetts is 0.60%.
What is the Percentage of Households Heated without Fuel in the United States?
Percentage of Households Heated without Fuel in the United States is 1.2%.