Cities with the Highest Percentage of Households Heated without Fuel in Pennsylvania
RELATED REPORTS & OPTIONS
Fuel-less Heating
Pennsylvania
Compare Cities
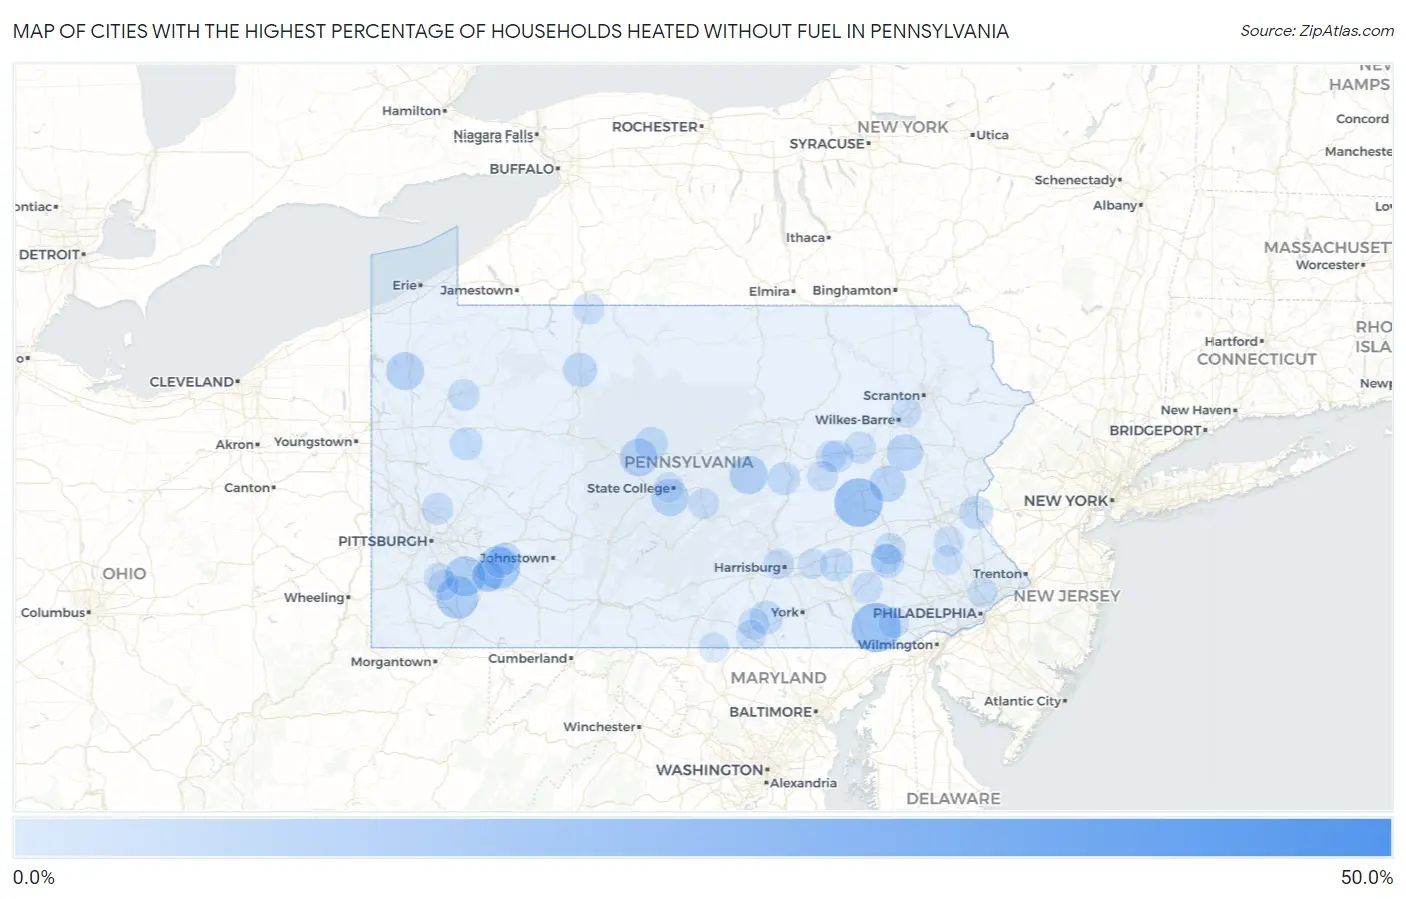
Map of Cities with the Highest Percentage of Households Heated without Fuel in Pennsylvania
0.0%
50.0%
Cities with the Highest Percentage of Households Heated without Fuel in Pennsylvania
| City | Fuel-less Heating | vs State | vs National | |
| 1. | Curryville | 43.8% | 0.50%(+43.3)#1 | 1.2%(+42.6)#440 |
| 2. | Wopsononock | 20.0% | 0.50%(+19.5)#2 | 1.2%(+18.8)#513 |
| 3. | Aaronsburg Cdp Washington County | 18.9% | 0.50%(+18.4)#3 | 1.2%(+17.7)#516 |
| 4. | Kirkwood | 17.4% | 0.50%(+16.9)#4 | 1.2%(+16.2)#531 |
| 5. | Seltzer | 16.7% | 0.50%(+16.2)#5 | 1.2%(+15.5)#537 |
| 6. | Hostetter | 12.3% | 0.50%(+11.8)#6 | 1.2%(+11.1)#592 |
| 7. | Star Junction | 11.7% | 0.50%(+11.2)#7 | 1.2%(+10.5)#602 |
| 8. | Wyano | 10.2% | 0.50%(+9.70)#8 | 1.2%(+9.00)#639 |
| 9. | Jacobus Borough | 9.9% | 0.50%(+9.40)#9 | 1.2%(+8.70)#647 |
| 10. | Orangeville Borough | 9.8% | 0.50%(+9.30)#10 | 1.2%(+8.60)#651 |
| 11. | Laurelton | 8.7% | 0.50%(+8.20)#11 | 1.2%(+7.50)#692 |
| 12. | Homewood At Martinsburg | 8.7% | 0.50%(+8.20)#12 | 1.2%(+7.50)#694 |
| 13. | Geneva | 8.3% | 0.50%(+7.80)#13 | 1.2%(+7.10)#712 |
| 14. | Kylertown | 8.0% | 0.50%(+7.50)#14 | 1.2%(+6.80)#734 |
| 15. | Pine Grove Mills | 7.8% | 0.50%(+7.30)#15 | 1.2%(+6.60)#739 |
| 16. | Hickory Hills | 7.2% | 0.50%(+6.70)#16 | 1.2%(+6.00)#772 |
| 17. | Hometown | 7.0% | 0.50%(+6.50)#17 | 1.2%(+5.80)#789 |
| 18. | Elgin Borough | 6.5% | 0.50%(+6.00)#18 | 1.2%(+5.30)#844 |
| 19. | Wilcox | 5.5% | 0.50%(+5.00)#19 | 1.2%(+4.30)#965 |
| 20. | Troutville Borough | 5.5% | 0.50%(+5.00)#20 | 1.2%(+4.30)#969 |
| 21. | Mont Alto Borough | 5.4% | 0.50%(+4.90)#21 | 1.2%(+4.20)#978 |
| 22. | Carmichaels Borough | 5.4% | 0.50%(+4.90)#22 | 1.2%(+4.20)#982 |
| 23. | Wyalusing Borough | 5.3% | 0.50%(+4.80)#23 | 1.2%(+4.10)#992 |
| 24. | Penndel Borough | 5.2% | 0.50%(+4.70)#24 | 1.2%(+4.00)#1,010 |
| 25. | Unionville Borough | 5.2% | 0.50%(+4.70)#25 | 1.2%(+4.00)#1,018 |
| 26. | Raubsville | 4.9% | 0.50%(+4.40)#26 | 1.2%(+3.70)#1,066 |
| 27. | Schellsburg Borough | 4.9% | 0.50%(+4.40)#27 | 1.2%(+3.70)#1,069 |
| 28. | Hampton | 4.8% | 0.50%(+4.30)#28 | 1.2%(+3.60)#1,085 |
| 29. | Montrose Manor | 4.8% | 0.50%(+4.30)#29 | 1.2%(+3.60)#1,090 |
| 30. | Pine Glen | 4.8% | 0.50%(+4.30)#30 | 1.2%(+3.60)#1,092 |
| 31. | Casselman Borough | 4.8% | 0.50%(+4.30)#31 | 1.2%(+3.60)#1,096 |
| 32. | Penbrook Borough | 4.5% | 0.50%(+4.00)#32 | 1.2%(+3.30)#1,149 |
| 33. | Quentin | 4.3% | 0.50%(+3.80)#33 | 1.2%(+3.10)#1,220 |
| 34. | Parker | 4.3% | 0.50%(+3.80)#34 | 1.2%(+3.10)#1,221 |
| 35. | Calumet | 4.2% | 0.50%(+3.70)#35 | 1.2%(+3.00)#1,242 |
| 36. | Kratzerville | 4.2% | 0.50%(+3.70)#36 | 1.2%(+3.00)#1,246 |
| 37. | Georgetown Cdp Lancaster County | 3.9% | 0.50%(+3.40)#37 | 1.2%(+2.70)#1,306 |
| 38. | Everett Borough | 3.8% | 0.50%(+3.30)#38 | 1.2%(+2.60)#1,334 |
| 39. | Bradenville | 3.8% | 0.50%(+3.30)#39 | 1.2%(+2.60)#1,345 |
| 40. | Langhorne Borough | 3.7% | 0.50%(+3.20)#40 | 1.2%(+2.50)#1,368 |
| 41. | Espy | 3.7% | 0.50%(+3.20)#41 | 1.2%(+2.50)#1,369 |
| 42. | Bakerstown | 3.6% | 0.50%(+3.10)#42 | 1.2%(+2.40)#1,397 |
| 43. | East Berwick | 3.6% | 0.50%(+3.10)#43 | 1.2%(+2.40)#1,401 |
| 44. | Mount Pocono Borough | 3.5% | 0.50%(+3.00)#44 | 1.2%(+2.30)#1,428 |
| 45. | Woodland Heights | 3.4% | 0.50%(+2.90)#45 | 1.2%(+2.20)#1,463 |
| 46. | Riverview Park | 3.3% | 0.50%(+2.80)#46 | 1.2%(+2.10)#1,493 |
| 47. | Spring City Borough | 3.3% | 0.50%(+2.80)#47 | 1.2%(+2.10)#1,494 |
| 48. | Blairsville Borough | 3.3% | 0.50%(+2.80)#48 | 1.2%(+2.10)#1,495 |
| 49. | Rockhill Borough | 3.3% | 0.50%(+2.80)#49 | 1.2%(+2.10)#1,514 |
| 50. | Smethport Borough | 3.2% | 0.50%(+2.70)#50 | 1.2%(+2.00)#1,542 |
| 51. | Rices Landing Borough | 3.2% | 0.50%(+2.70)#51 | 1.2%(+2.00)#1,550 |
| 52. | Jenkintown Borough | 3.1% | 0.50%(+2.60)#52 | 1.2%(+1.90)#1,573 |
| 53. | Norvelt | 3.1% | 0.50%(+2.60)#53 | 1.2%(+1.90)#1,585 |
| 54. | Foster Brook | 3.0% | 0.50%(+2.50)#54 | 1.2%(+1.80)#1,646 |
| 55. | Cochranville | 3.0% | 0.50%(+2.50)#55 | 1.2%(+1.80)#1,651 |
| 56. | Fernville | 2.9% | 0.50%(+2.40)#56 | 1.2%(+1.70)#1,695 |
| 57. | Mount Union Borough | 2.8% | 0.50%(+2.30)#57 | 1.2%(+1.60)#1,741 |
| 58. | Monessen | 2.7% | 0.50%(+2.20)#58 | 1.2%(+1.50)#1,779 |
| 59. | Elysburg | 2.7% | 0.50%(+2.20)#59 | 1.2%(+1.50)#1,789 |
| 60. | Hunterstown | 2.7% | 0.50%(+2.20)#60 | 1.2%(+1.50)#1,817 |
| 61. | Cherry Valley Borough | 2.7% | 0.50%(+2.20)#61 | 1.2%(+1.50)#1,827 |
| 62. | Church Hill | 2.6% | 0.50%(+2.10)#62 | 1.2%(+1.40)#1,867 |
| 63. | Enola | 2.5% | 0.50%(+2.00)#63 | 1.2%(+1.30)#1,932 |
| 64. | Lansford Borough | 2.5% | 0.50%(+2.00)#64 | 1.2%(+1.30)#1,942 |
| 65. | Lawson Heights | 2.5% | 0.50%(+2.00)#65 | 1.2%(+1.30)#1,949 |
| 66. | Mercersburg Borough | 2.5% | 0.50%(+2.00)#66 | 1.2%(+1.30)#1,952 |
| 67. | Farmersville | 2.5% | 0.50%(+2.00)#67 | 1.2%(+1.30)#1,965 |
| 68. | Rockwood Borough | 2.5% | 0.50%(+2.00)#68 | 1.2%(+1.30)#1,969 |
| 69. | West Wyomissing | 2.4% | 0.50%(+1.90)#69 | 1.2%(+1.20)#2,019 |
| 70. | Loganville Borough | 2.4% | 0.50%(+1.90)#70 | 1.2%(+1.20)#2,033 |
| 71. | Elverson Borough | 2.4% | 0.50%(+1.90)#71 | 1.2%(+1.20)#2,037 |
| 72. | Gordon Borough | 2.4% | 0.50%(+1.90)#72 | 1.2%(+1.20)#2,044 |
| 73. | Bechtelsville Borough | 2.4% | 0.50%(+1.90)#73 | 1.2%(+1.20)#2,046 |
| 74. | Adamsburg Borough | 2.4% | 0.50%(+1.90)#74 | 1.2%(+1.20)#2,078 |
| 75. | Lake Heritage | 2.3% | 0.50%(+1.80)#75 | 1.2%(+1.10)#2,112 |
| 76. | Inkerman | 2.3% | 0.50%(+1.80)#76 | 1.2%(+1.10)#2,134 |
| 77. | Leetsdale Borough | 2.3% | 0.50%(+1.80)#77 | 1.2%(+1.10)#2,139 |
| 78. | Beavertown Borough | 2.3% | 0.50%(+1.80)#78 | 1.2%(+1.10)#2,147 |
| 79. | Halifax Borough | 2.3% | 0.50%(+1.80)#79 | 1.2%(+1.10)#2,152 |
| 80. | Irwin Borough | 2.2% | 0.50%(+1.70)#80 | 1.2%(+1.00)#2,203 |
| 81. | Yardley Borough | 2.2% | 0.50%(+1.70)#81 | 1.2%(+1.00)#2,211 |
| 82. | Spinnerstown | 2.2% | 0.50%(+1.70)#82 | 1.2%(+1.00)#2,221 |
| 83. | Hershey | 2.1% | 0.50%(+1.60)#83 | 1.2%(+0.900)#2,302 |
| 84. | Lewisburg Borough | 2.1% | 0.50%(+1.60)#84 | 1.2%(+0.900)#2,328 |
| 85. | Bridgeville Borough | 2.1% | 0.50%(+1.60)#85 | 1.2%(+0.900)#2,329 |
| 86. | Monongahela | 2.1% | 0.50%(+1.60)#86 | 1.2%(+0.900)#2,333 |
| 87. | Ridgway Borough | 2.1% | 0.50%(+1.60)#87 | 1.2%(+0.900)#2,335 |
| 88. | Summit Hill Borough | 2.1% | 0.50%(+1.60)#88 | 1.2%(+0.900)#2,343 |
| 89. | Emporium Borough | 2.1% | 0.50%(+1.60)#89 | 1.2%(+0.900)#2,355 |
| 90. | Nottingham | 2.1% | 0.50%(+1.60)#90 | 1.2%(+0.900)#2,368 |
| 91. | Pen Mar | 2.1% | 0.50%(+1.60)#91 | 1.2%(+0.900)#2,373 |
| 92. | Avonmore Borough | 2.1% | 0.50%(+1.60)#92 | 1.2%(+0.900)#2,376 |
| 93. | Carlisle Borough | 2.0% | 0.50%(+1.50)#93 | 1.2%(+0.800)#2,420 |
| 94. | Park Forest Village | 2.0% | 0.50%(+1.50)#94 | 1.2%(+0.800)#2,436 |
| 95. | California Borough | 2.0% | 0.50%(+1.50)#95 | 1.2%(+0.800)#2,450 |
| 96. | Sinking Spring Borough | 2.0% | 0.50%(+1.50)#96 | 1.2%(+0.800)#2,458 |
| 97. | Wyncote | 2.0% | 0.50%(+1.50)#97 | 1.2%(+0.800)#2,463 |
| 98. | Cambridge Springs Borough | 2.0% | 0.50%(+1.50)#98 | 1.2%(+0.800)#2,478 |
| 99. | Woxall | 2.0% | 0.50%(+1.50)#99 | 1.2%(+0.800)#2,491 |
| 100. | Ulysses Borough | 2.0% | 0.50%(+1.50)#100 | 1.2%(+0.800)#2,508 |
Common Questions
What are the Top 10 Cities with the Highest Percentage of Households Heated without Fuel in Pennsylvania?
Top 10 Cities with the Highest Percentage of Households Heated without Fuel in Pennsylvania are:
#1
17.4%
#2
16.7%
#3
12.3%
#4
11.7%
#5
10.2%
#6
8.7%
#7
8.3%
#8
8.0%
#9
7.8%
#10
7.2%
What city has the Highest Percentage of Households Heated without Fuel in Pennsylvania?
Kirkwood has the Highest Percentage of Households Heated without Fuel in Pennsylvania with 17.4%.
What is the Percentage of Households Heated without Fuel in the State of Pennsylvania?
Percentage of Households Heated without Fuel in Pennsylvania is 0.50%.
What is the Percentage of Households Heated without Fuel in the United States?
Percentage of Households Heated without Fuel in the United States is 1.2%.