Cities with the Highest Percentage of Households Heated without Fuel in Illinois
RELATED REPORTS & OPTIONS
Fuel-less Heating
Illinois
Compare Cities
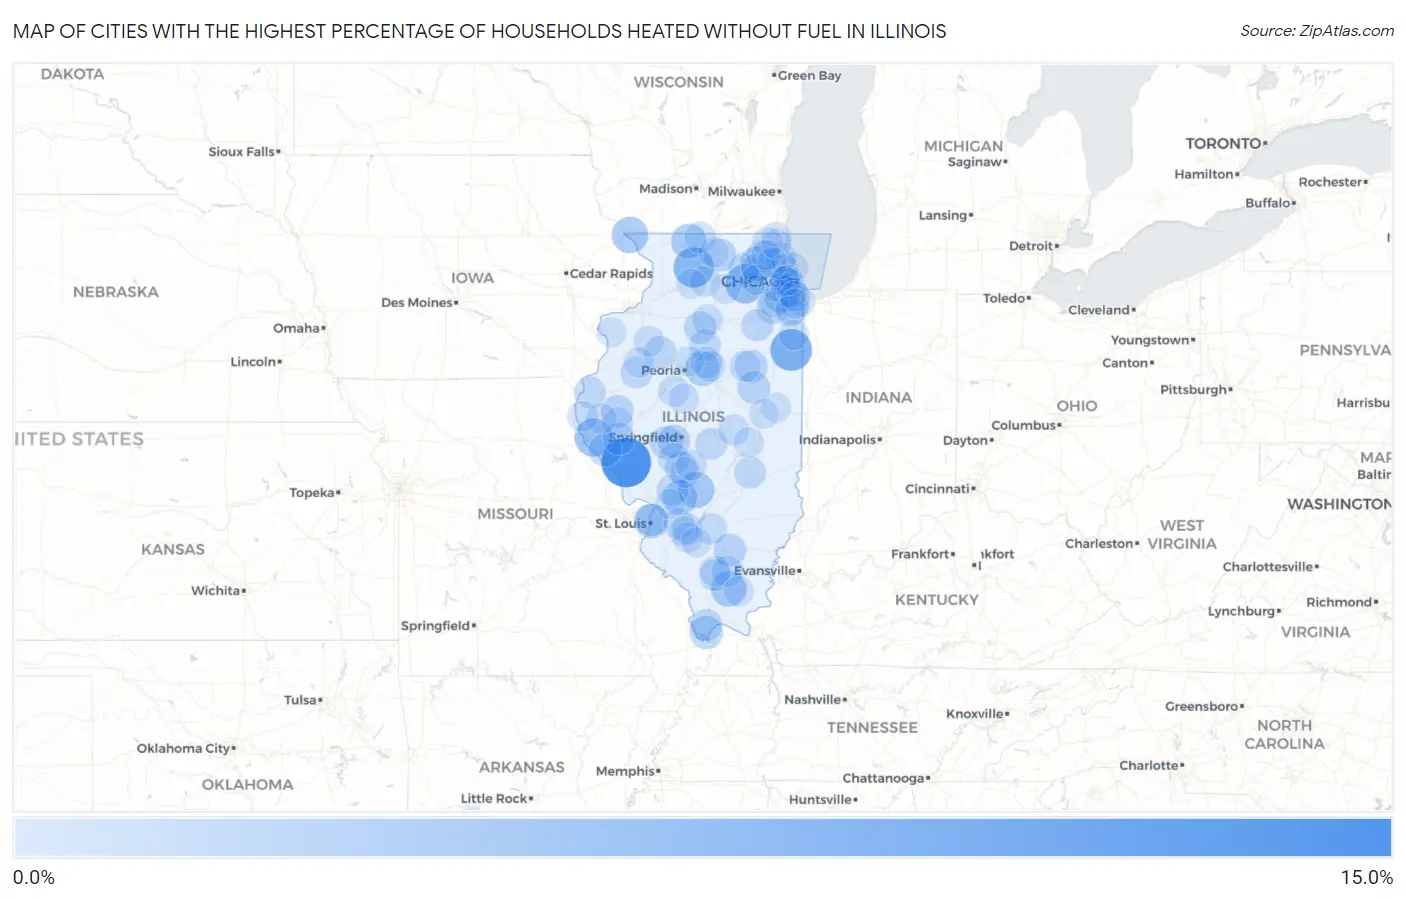
Map of Cities with the Highest Percentage of Households Heated without Fuel in Illinois
0.0%
15.0%
Cities with the Highest Percentage of Households Heated without Fuel in Illinois
| City | Fuel-less Heating | vs State | vs National | |
| 1. | Pearl | 13.8% | 0.80%(+13.0)#1 | 1.2%(+12.6)#568 |
| 2. | Papineau | 8.7% | 0.80%(+7.90)#2 | 1.2%(+7.50)#695 |
| 3. | Mount Morris | 7.7% | 0.80%(+6.90)#3 | 1.2%(+6.50)#746 |
| 4. | Kaneville | 7.0% | 0.80%(+6.20)#4 | 1.2%(+5.80)#791 |
| 5. | Plainville | 6.3% | 0.80%(+5.50)#5 | 1.2%(+5.10)#861 |
| 6. | Menominee | 5.2% | 0.80%(+4.40)#6 | 1.2%(+4.00)#1,015 |
| 7. | Coffeen | 5.0% | 0.80%(+4.20)#7 | 1.2%(+3.80)#1,052 |
| 8. | Crab Orchard | 4.9% | 0.80%(+4.10)#8 | 1.2%(+3.70)#1,070 |
| 9. | Dakota | 4.4% | 0.80%(+3.60)#9 | 1.2%(+3.20)#1,190 |
| 10. | West Dundee | 4.2% | 0.80%(+3.40)#10 | 1.2%(+3.00)#1,234 |
| 11. | New Douglas | 4.2% | 0.80%(+3.40)#11 | 1.2%(+3.00)#1,245 |
| 12. | Eureka | 4.1% | 0.80%(+3.30)#12 | 1.2%(+2.90)#1,256 |
| 13. | Brooklyn | 3.9% | 0.80%(+3.10)#13 | 1.2%(+2.70)#1,305 |
| 14. | Mounds | 3.4% | 0.80%(+2.60)#14 | 1.2%(+2.20)#1,467 |
| 15. | Palos Park | 3.3% | 0.80%(+2.50)#15 | 1.2%(+2.10)#1,490 |
| 16. | El Dara | 3.2% | 0.80%(+2.40)#16 | 1.2%(+2.00)#1,552 |
| 17. | New Berlin | 3.1% | 0.80%(+2.30)#17 | 1.2%(+1.90)#1,583 |
| 18. | Forrest | 3.0% | 0.80%(+2.20)#18 | 1.2%(+1.80)#1,647 |
| 19. | Curran | 3.0% | 0.80%(+2.20)#19 | 1.2%(+1.80)#1,654 |
| 20. | Gibson City | 2.9% | 0.80%(+2.10)#20 | 1.2%(+1.70)#1,674 |
| 21. | Cherry Valley | 2.9% | 0.80%(+2.10)#21 | 1.2%(+1.70)#1,676 |
| 22. | Opdyke | 2.9% | 0.80%(+2.10)#22 | 1.2%(+1.70)#1,697 |
| 23. | Camden | 2.9% | 0.80%(+2.10)#23 | 1.2%(+1.70)#1,704 |
| 24. | Venice | 2.8% | 0.80%(+2.00)#24 | 1.2%(+1.60)#1,744 |
| 25. | Williamsfield | 2.8% | 0.80%(+2.00)#25 | 1.2%(+1.60)#1,758 |
| 26. | Ingalls Park | 2.7% | 0.80%(+1.90)#26 | 1.2%(+1.50)#1,784 |
| 27. | Hennepin | 2.7% | 0.80%(+1.90)#27 | 1.2%(+1.50)#1,804 |
| 28. | Perry | 2.7% | 0.80%(+1.90)#28 | 1.2%(+1.50)#1,820 |
| 29. | Waggoner | 2.7% | 0.80%(+1.90)#29 | 1.2%(+1.50)#1,824 |
| 30. | Olympia Fields | 2.6% | 0.80%(+1.80)#30 | 1.2%(+1.40)#1,850 |
| 31. | Fox River Grove | 2.6% | 0.80%(+1.80)#31 | 1.2%(+1.40)#1,851 |
| 32. | Carbon Hill | 2.6% | 0.80%(+1.80)#32 | 1.2%(+1.40)#1,892 |
| 33. | Pulaski | 2.5% | 0.80%(+1.70)#33 | 1.2%(+1.30)#1,979 |
| 34. | Neoga | 2.4% | 0.80%(+1.60)#34 | 1.2%(+1.20)#2,038 |
| 35. | Blue Mound | 2.4% | 0.80%(+1.60)#35 | 1.2%(+1.20)#2,045 |
| 36. | Avon | 2.4% | 0.80%(+1.60)#36 | 1.2%(+1.20)#2,055 |
| 37. | Varna | 2.4% | 0.80%(+1.60)#37 | 1.2%(+1.20)#2,064 |
| 38. | Sawyerville | 2.4% | 0.80%(+1.60)#38 | 1.2%(+1.20)#2,073 |
| 39. | Elvaston | 2.4% | 0.80%(+1.60)#39 | 1.2%(+1.20)#2,074 |
| 40. | North Riverside | 2.3% | 0.80%(+1.50)#40 | 1.2%(+1.10)#2,095 |
| 41. | Roanoke | 2.3% | 0.80%(+1.50)#41 | 1.2%(+1.10)#2,118 |
| 42. | Zeigler | 2.3% | 0.80%(+1.50)#42 | 1.2%(+1.10)#2,131 |
| 43. | Burlington | 2.2% | 0.80%(+1.40)#43 | 1.2%(+1.00)#2,265 |
| 44. | Bridgeview | 2.1% | 0.80%(+1.30)#44 | 1.2%(+0.900)#2,300 |
| 45. | Virden | 2.1% | 0.80%(+1.30)#45 | 1.2%(+0.900)#2,341 |
| 46. | Durand | 2.1% | 0.80%(+1.30)#46 | 1.2%(+0.900)#2,367 |
| 47. | Central City | 2.1% | 0.80%(+1.30)#47 | 1.2%(+0.900)#2,374 |
| 48. | Hanaford | 2.1% | 0.80%(+1.30)#48 | 1.2%(+0.900)#2,396 |
| 49. | Clarendon Hills | 2.0% | 0.80%(+1.20)#49 | 1.2%(+0.800)#2,437 |
| 50. | Cerro Gordo | 2.0% | 0.80%(+1.20)#50 | 1.2%(+0.800)#2,489 |
| 51. | Fairbury | 1.9% | 0.80%(+1.10)#51 | 1.2%(+0.700)#2,599 |
| 52. | Manito | 1.9% | 0.80%(+1.10)#52 | 1.2%(+0.700)#2,629 |
| 53. | Prospect Heights | 1.8% | 0.80%(+1.00)#53 | 1.2%(+0.600)#2,711 |
| 54. | Christopher | 1.8% | 0.80%(+1.00)#54 | 1.2%(+0.600)#2,773 |
| 55. | Raymond | 1.8% | 0.80%(+1.00)#55 | 1.2%(+0.600)#2,810 |
| 56. | Morrisonville | 1.8% | 0.80%(+1.00)#56 | 1.2%(+0.600)#2,813 |
| 57. | Oneida | 1.8% | 0.80%(+1.00)#57 | 1.2%(+0.600)#2,825 |
| 58. | Dalzell | 1.8% | 0.80%(+1.00)#58 | 1.2%(+0.600)#2,830 |
| 59. | Secor | 1.8% | 0.80%(+1.00)#59 | 1.2%(+0.600)#2,850 |
| 60. | Old Mill Creek | 1.8% | 0.80%(+1.00)#60 | 1.2%(+0.600)#2,860 |
| 61. | Evanston | 1.7% | 0.80%(+0.900)#61 | 1.2%(+0.500)#2,868 |
| 62. | Park Ridge | 1.7% | 0.80%(+0.900)#62 | 1.2%(+0.500)#2,875 |
| 63. | Trenton | 1.7% | 0.80%(+0.900)#63 | 1.2%(+0.500)#2,939 |
| 64. | Mount Sterling | 1.7% | 0.80%(+0.900)#64 | 1.2%(+0.500)#2,948 |
| 65. | Camp Point | 1.7% | 0.80%(+0.900)#65 | 1.2%(+0.500)#2,961 |
| 66. | Germantown | 1.7% | 0.80%(+0.900)#66 | 1.2%(+0.500)#2,966 |
| 67. | Ashton | 1.7% | 0.80%(+0.900)#67 | 1.2%(+0.500)#2,976 |
| 68. | Ursa | 1.7% | 0.80%(+0.900)#68 | 1.2%(+0.500)#2,981 |
| 69. | Chicago | 1.6% | 0.80%(+0.800)#69 | 1.2%(+0.400)#3,008 |
| 70. | Riverwoods | 1.6% | 0.80%(+0.800)#70 | 1.2%(+0.400)#3,096 |
| 71. | Arthur | 1.6% | 0.80%(+0.800)#71 | 1.2%(+0.400)#3,125 |
| 72. | San Jose | 1.6% | 0.80%(+0.800)#72 | 1.2%(+0.400)#3,172 |
| 73. | Oak Park | 1.5% | 0.80%(+0.700)#73 | 1.2%(+0.300)#3,223 |
| 74. | Calumet City | 1.5% | 0.80%(+0.700)#74 | 1.2%(+0.300)#3,229 |
| 75. | Lockport | 1.5% | 0.80%(+0.700)#75 | 1.2%(+0.300)#3,235 |
| 76. | Geneva | 1.5% | 0.80%(+0.700)#76 | 1.2%(+0.300)#3,242 |
| 77. | Evergreen Park | 1.5% | 0.80%(+0.700)#77 | 1.2%(+0.300)#3,244 |
| 78. | Forest Park | 1.5% | 0.80%(+0.700)#78 | 1.2%(+0.300)#3,253 |
| 79. | Richton Park | 1.5% | 0.80%(+0.700)#79 | 1.2%(+0.300)#3,255 |
| 80. | Calumet Park | 1.5% | 0.80%(+0.700)#80 | 1.2%(+0.300)#3,272 |
| 81. | Abingdon | 1.5% | 0.80%(+0.700)#81 | 1.2%(+0.300)#3,313 |
| 82. | Momence | 1.5% | 0.80%(+0.700)#82 | 1.2%(+0.300)#3,318 |
| 83. | Long Lake | 1.5% | 0.80%(+0.700)#83 | 1.2%(+0.300)#3,322 |
| 84. | Carrier Mills | 1.5% | 0.80%(+0.700)#84 | 1.2%(+0.300)#3,349 |
| 85. | Okawville | 1.5% | 0.80%(+0.700)#85 | 1.2%(+0.300)#3,366 |
| 86. | Damiansville | 1.5% | 0.80%(+0.700)#86 | 1.2%(+0.300)#3,401 |
| 87. | Rockford | 1.4% | 0.80%(+0.600)#87 | 1.2%(+0.200)#3,421 |
| 88. | Elgin | 1.4% | 0.80%(+0.600)#88 | 1.2%(+0.200)#3,424 |
| 89. | Dixon | 1.4% | 0.80%(+0.600)#89 | 1.2%(+0.200)#3,460 |
| 90. | Gages Lake | 1.4% | 0.80%(+0.600)#90 | 1.2%(+0.200)#3,470 |
| 91. | Lake Barrington | 1.4% | 0.80%(+0.600)#91 | 1.2%(+0.200)#3,516 |
| 92. | Nashville | 1.4% | 0.80%(+0.600)#92 | 1.2%(+0.200)#3,548 |
| 93. | East Hazel Crest | 1.4% | 0.80%(+0.600)#93 | 1.2%(+0.200)#3,586 |
| 94. | Hamel | 1.4% | 0.80%(+0.600)#94 | 1.2%(+0.200)#3,603 |
| 95. | Shabbona | 1.4% | 0.80%(+0.600)#95 | 1.2%(+0.200)#3,614 |
| 96. | Joy | 1.4% | 0.80%(+0.600)#96 | 1.2%(+0.200)#3,627 |
| 97. | Bay View Gardens | 1.4% | 0.80%(+0.600)#97 | 1.2%(+0.200)#3,631 |
| 98. | Royal | 1.4% | 0.80%(+0.600)#98 | 1.2%(+0.200)#3,632 |
| 99. | Palatine | 1.3% | 0.80%(+0.500)#99 | 1.2%(+0.100)#3,656 |
| 100. | Urbana | 1.3% | 0.80%(+0.500)#100 | 1.2%(+0.100)#3,665 |
Common Questions
What are the Top 10 Cities with the Highest Percentage of Households Heated without Fuel in Illinois?
Top 10 Cities with the Highest Percentage of Households Heated without Fuel in Illinois are:
#1
13.8%
#2
8.7%
#3
7.7%
#4
7.0%
#5
6.3%
#6
5.2%
#7
5.0%
#8
4.9%
#9
4.4%
#10
4.2%
What city has the Highest Percentage of Households Heated without Fuel in Illinois?
Pearl has the Highest Percentage of Households Heated without Fuel in Illinois with 13.8%.
What is the Percentage of Households Heated without Fuel in the State of Illinois?
Percentage of Households Heated without Fuel in Illinois is 0.80%.
What is the Percentage of Households Heated without Fuel in the United States?
Percentage of Households Heated without Fuel in the United States is 1.2%.