Port Hueneme, CA Map & Demographics
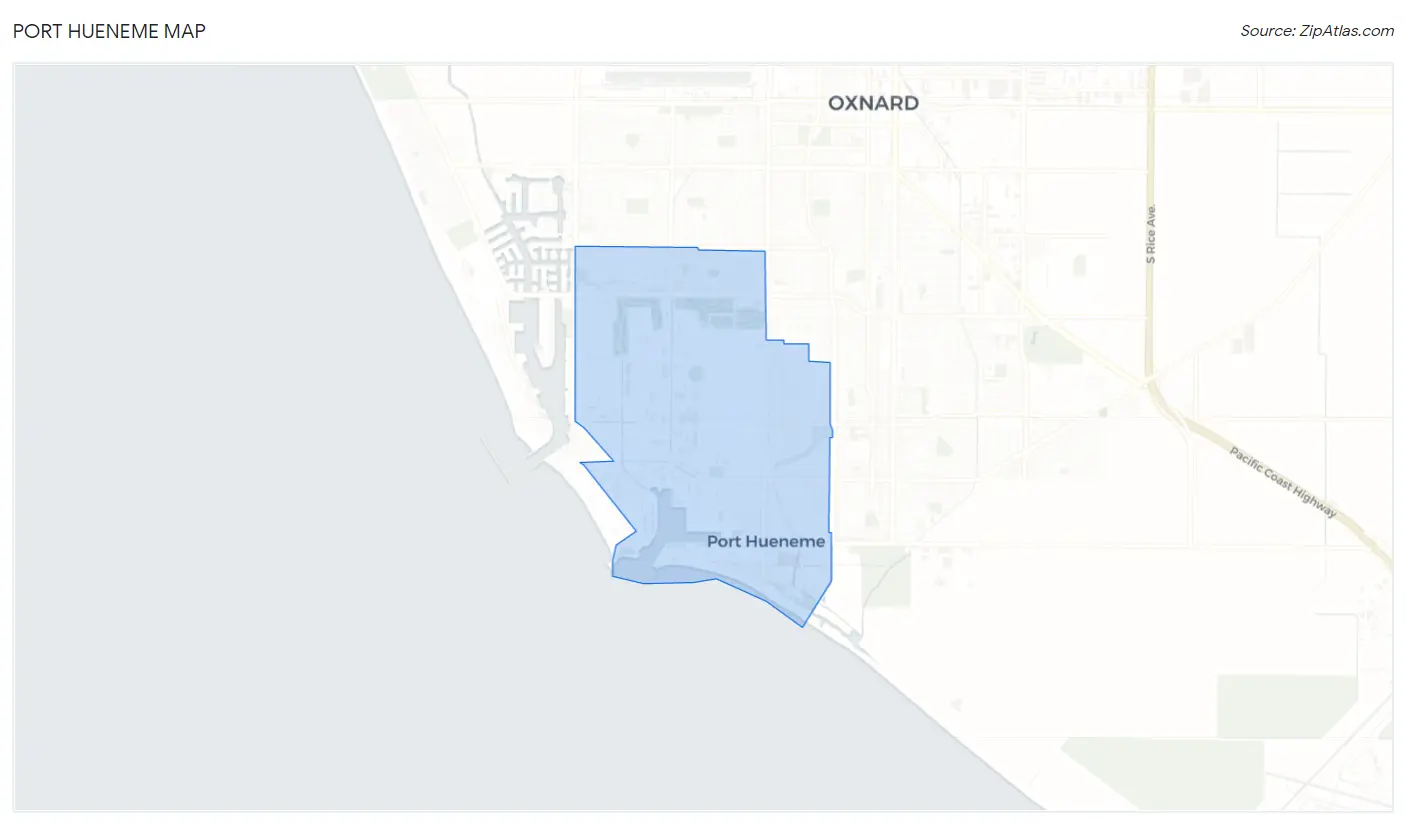
Port Hueneme Map
Port Hueneme Overview
$30,857
PER CAPITA INCOME
$83,007
AVG FAMILY INCOME
$71,695
AVG HOUSEHOLD INCOME
24.4%
WAGE / INCOME GAP [ % ]
75.6¢/ $1
WAGE / INCOME GAP [ $ ]
$11,721
FAMILY INCOME DEFICIT
0.39
INEQUALITY / GINI INDEX
21,847
TOTAL POPULATION
11,140
MALE POPULATION
10,707
FEMALE POPULATION
104.04
MALES / 100 FEMALES
96.11
FEMALES / 100 MALES
34.8
MEDIAN AGE
3.5
AVG FAMILY SIZE
3.0
AVG HOUSEHOLD SIZE
11,900
LABOR FORCE [ PEOPLE ]
69.2%
PERCENT IN LABOR FORCE
8.9%
UNEMPLOYMENT RATE
Port Hueneme Zip Codes
Port Hueneme Area Codes
Income in Port Hueneme
Income Overview in Port Hueneme
Per Capita Income in Port Hueneme is $30,857, while median incomes of families and households are $83,007 and $71,695 respectively.
| Characteristic | Number | Measure |
| Per Capita Income | 21,847 | $30,857 |
| Median Family Income | 4,916 | $83,007 |
| Mean Family Income | 4,916 | $88,266 |
| Median Household Income | 6,984 | $71,695 |
| Mean Household Income | 6,984 | $87,425 |
| Income Deficit | 4,916 | $11,721 |
| Wage / Income Gap (%) | 21,847 | 24.40% |
| Wage / Income Gap ($) | 21,847 | 75.60¢ per $1 |
| Gini / Inequality Index | 21,847 | 0.39 |
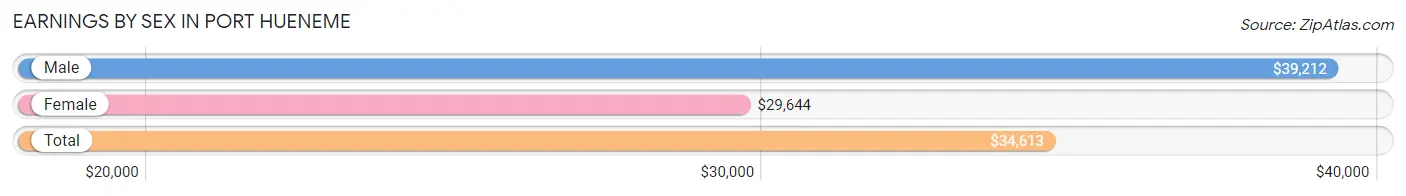
Earnings by Sex in Port Hueneme
Average Earnings in Port Hueneme are $34,613, $39,212 for men and $29,644 for women, a difference of 24.4%.
| Sex | Number | Average Earnings |
| Male | 6,755 (57.3%) | $39,212 |
| Female | 5,037 (42.7%) | $29,644 |
| Total | 11,792 (100.0%) | $34,613 |
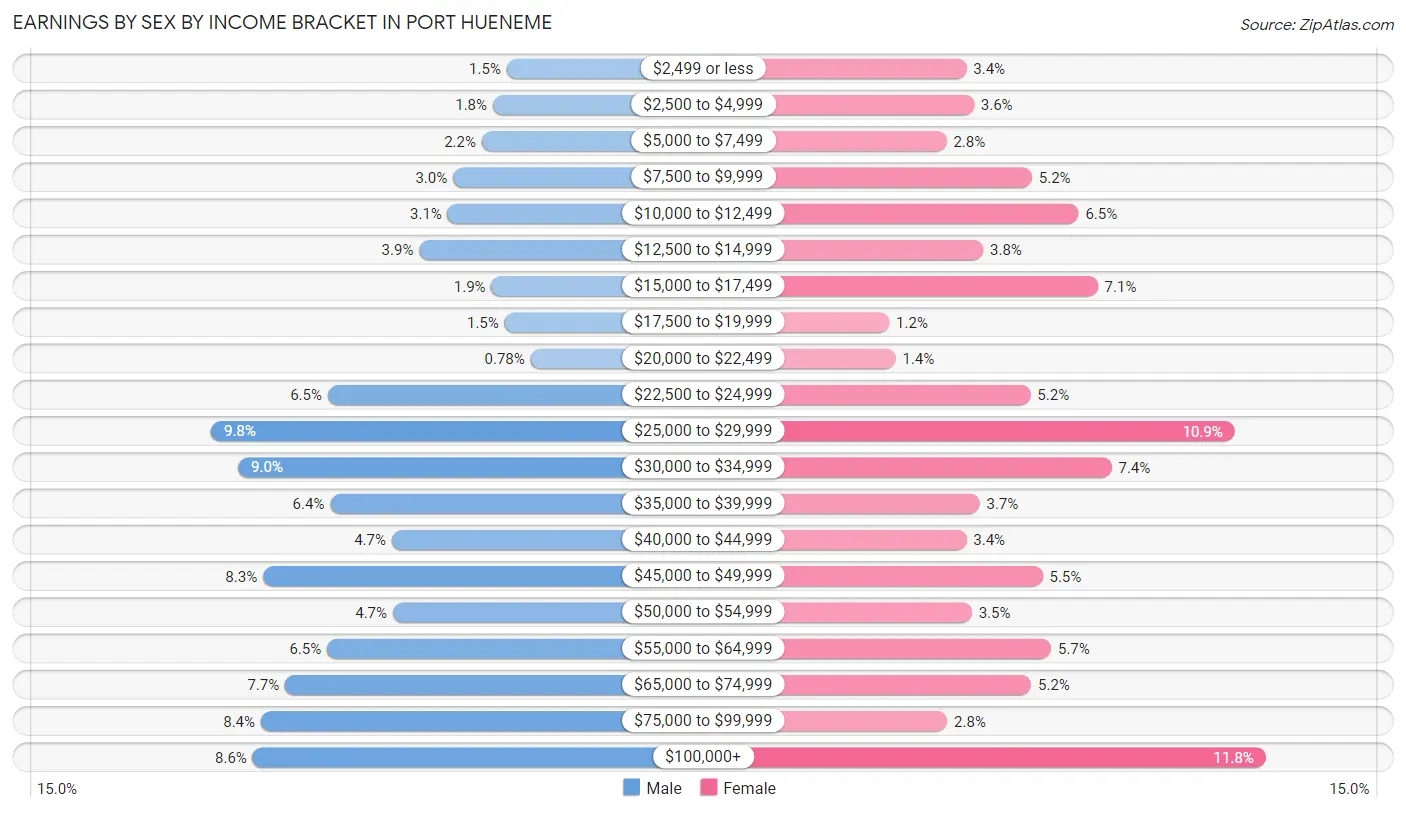
Earnings by Sex by Income Bracket in Port Hueneme
The most common earnings brackets in Port Hueneme are $25,000 to $29,999 for men (659 | 9.8%) and $100,000+ for women (593 | 11.8%).
| Income | Male | Female |
| $2,499 or less | 98 (1.5%) | 169 (3.4%) |
| $2,500 to $4,999 | 124 (1.8%) | 180 (3.6%) |
| $5,000 to $7,499 | 145 (2.1%) | 141 (2.8%) |
| $7,500 to $9,999 | 200 (3.0%) | 262 (5.2%) |
| $10,000 to $12,499 | 210 (3.1%) | 328 (6.5%) |
| $12,500 to $14,999 | 264 (3.9%) | 193 (3.8%) |
| $15,000 to $17,499 | 127 (1.9%) | 355 (7.0%) |
| $17,500 to $19,999 | 102 (1.5%) | 60 (1.2%) |
| $20,000 to $22,499 | 53 (0.8%) | 69 (1.4%) |
| $22,500 to $24,999 | 438 (6.5%) | 260 (5.2%) |
| $25,000 to $29,999 | 659 (9.8%) | 549 (10.9%) |
| $30,000 to $34,999 | 608 (9.0%) | 375 (7.4%) |
| $35,000 to $39,999 | 433 (6.4%) | 188 (3.7%) |
| $40,000 to $44,999 | 316 (4.7%) | 169 (3.4%) |
| $45,000 to $49,999 | 561 (8.3%) | 277 (5.5%) |
| $50,000 to $54,999 | 314 (4.6%) | 177 (3.5%) |
| $55,000 to $64,999 | 439 (6.5%) | 289 (5.7%) |
| $65,000 to $74,999 | 519 (7.7%) | 261 (5.2%) |
| $75,000 to $99,999 | 565 (8.4%) | 142 (2.8%) |
| $100,000+ | 580 (8.6%) | 593 (11.8%) |
| Total | 6,755 (100.0%) | 5,037 (100.0%) |
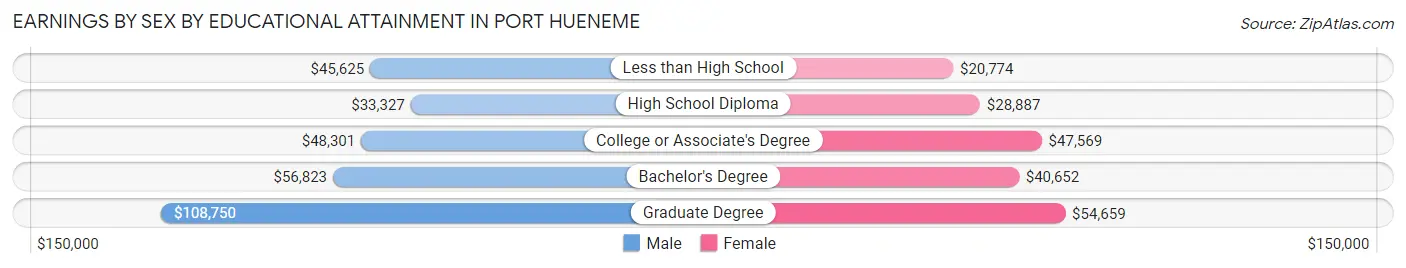
Earnings by Sex by Educational Attainment in Port Hueneme
Average earnings in Port Hueneme are $44,388 for men and $32,387 for women, a difference of 27.0%. Men with an educational attainment of graduate degree enjoy the highest average annual earnings of $108,750, while those with high school diploma education earn the least with $33,327. Women with an educational attainment of graduate degree earn the most with the average annual earnings of $54,659, while those with less than high school education have the smallest earnings of $20,774.
| Educational Attainment | Male Income | Female Income |
| Less than High School | $45,625 | $20,774 |
| High School Diploma | $33,327 | $28,887 |
| College or Associate's Degree | $48,301 | $47,569 |
| Bachelor's Degree | $56,823 | $40,652 |
| Graduate Degree | $108,750 | $54,659 |
| Total | $44,388 | $32,387 |
Family Income in Port Hueneme
Family Income Brackets in Port Hueneme
According to the Port Hueneme family income data, there are 900 families falling into the $100,000 to $149,999 income range, which is the most common income bracket and makes up 18.3% of all families. Conversely, the $10,000 to $14,999 income bracket is the least frequent group with only 133 families (2.7%) belonging to this category.
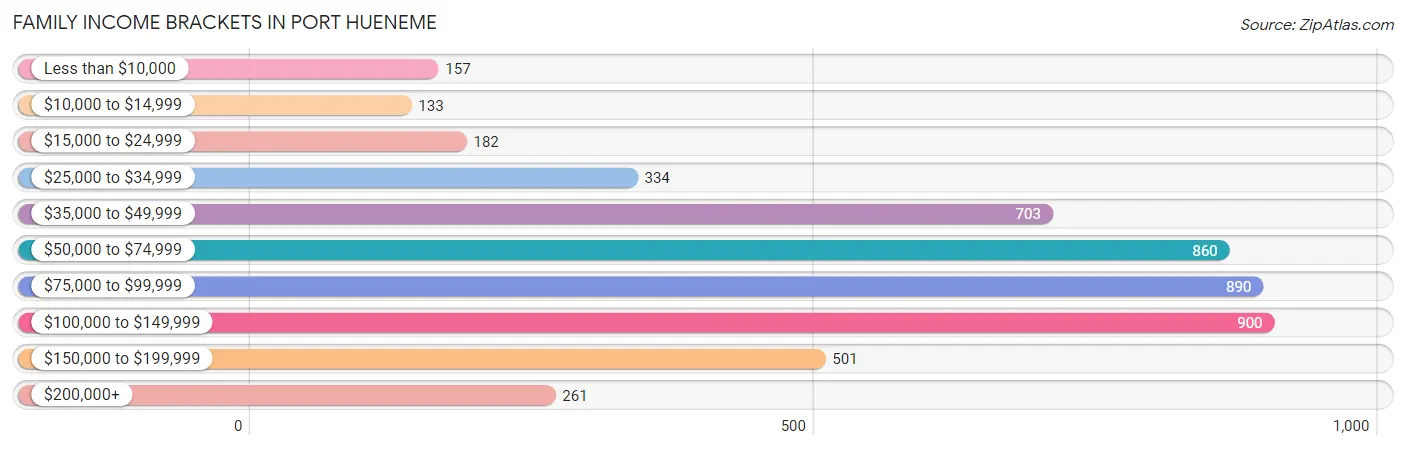
| Income Bracket | # Families | % Families |
| Less than $10,000 | 157 | 3.2% |
| $10,000 to $14,999 | 133 | 2.7% |
| $15,000 to $24,999 | 182 | 3.7% |
| $25,000 to $34,999 | 334 | 6.8% |
| $35,000 to $49,999 | 703 | 14.3% |
| $50,000 to $74,999 | 860 | 17.5% |
| $75,000 to $99,999 | 890 | 18.1% |
| $100,000 to $149,999 | 900 | 18.3% |
| $150,000 to $199,999 | 501 | 10.2% |
| $200,000+ | 261 | 5.3% |
Family Income by Famaliy Size in Port Hueneme
7+ person families (145 | 2.9%) account for the highest median family income in Port Hueneme with $97,390 per family, while 2-person families (2,202 | 44.8%) have the highest median income of $41,518 per family member.
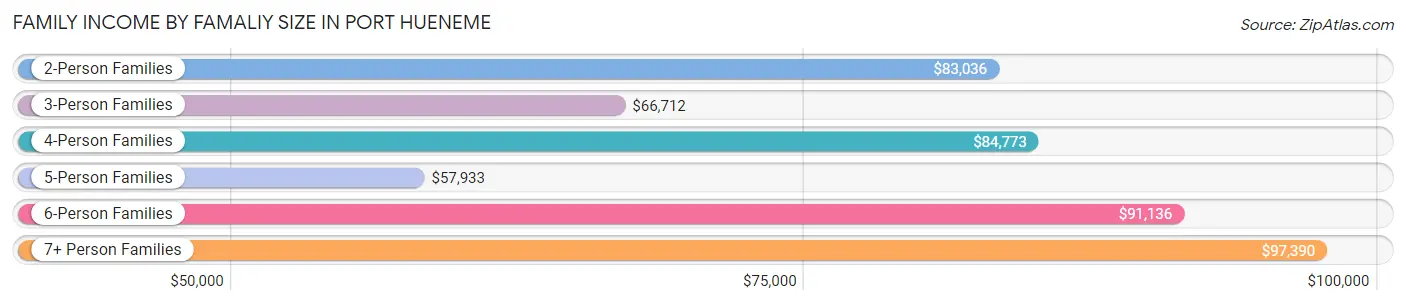
| Income Bracket | # Families | Median Income |
| 2-Person Families | 2,202 (44.8%) | $83,036 |
| 3-Person Families | 1,016 (20.7%) | $66,712 |
| 4-Person Families | 674 (13.7%) | $84,773 |
| 5-Person Families | 735 (14.9%) | $57,933 |
| 6-Person Families | 144 (2.9%) | $91,136 |
| 7+ Person Families | 145 (2.9%) | $97,390 |
| Total | 4,916 (100.0%) | $83,007 |
Family Income by Number of Earners in Port Hueneme
The median family income in Port Hueneme is $83,007, with families comprising 3+ earners (563) having the highest median family income of $121,453, while families with no earners (559) have the lowest median family income of $39,175, accounting for 11.5% and 11.4% of families, respectively.
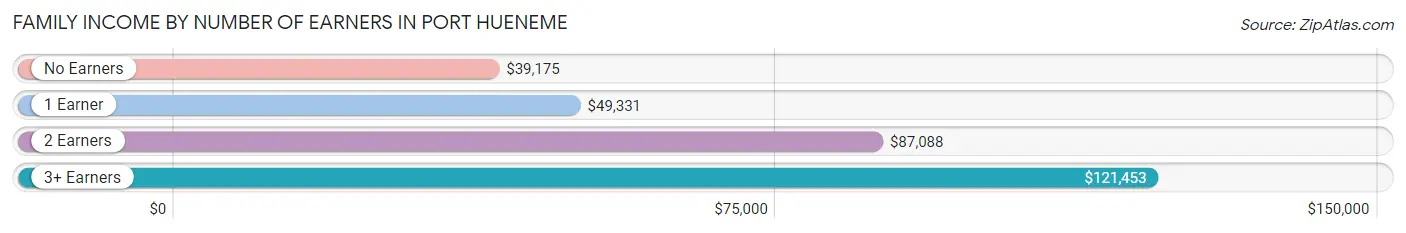
| Number of Earners | # Families | Median Income |
| No Earners | 559 (11.4%) | $39,175 |
| 1 Earner | 1,619 (32.9%) | $49,331 |
| 2 Earners | 2,175 (44.2%) | $87,088 |
| 3+ Earners | 563 (11.5%) | $121,453 |
| Total | 4,916 (100.0%) | $83,007 |
Household Income in Port Hueneme
Household Income Brackets in Port Hueneme
With 1,446 households falling in the category, the $50,000 to $74,999 income range is the most frequent in Port Hueneme, accounting for 20.7% of all households. In contrast, only 210 households (3.0%) fall into the less than $10,000 income bracket, making it the least populous group.
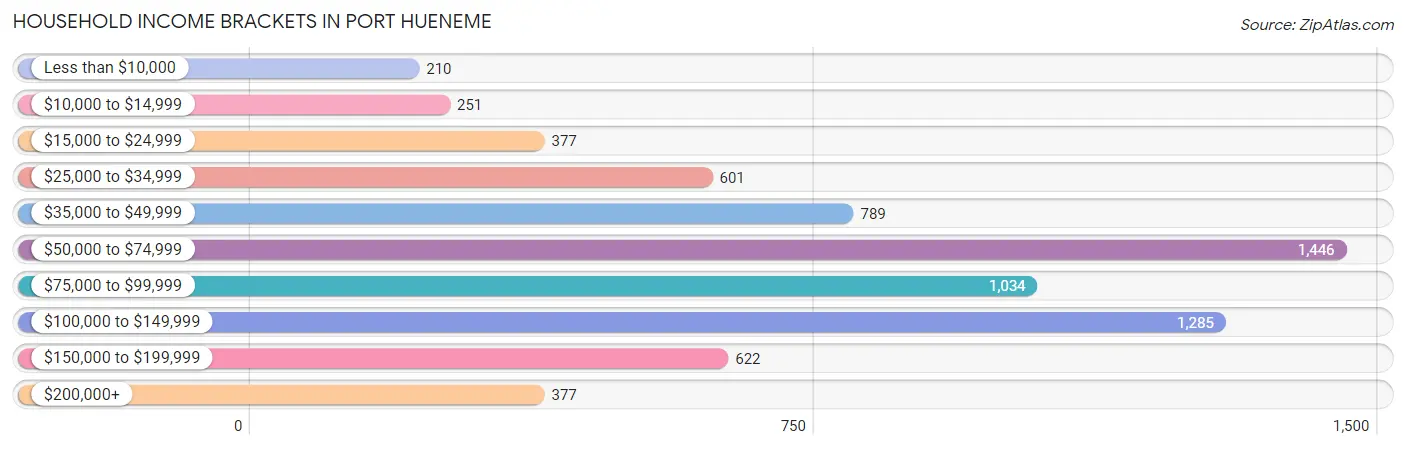
| Income Bracket | # Households | % Households |
| Less than $10,000 | 210 | 3.0% |
| $10,000 to $14,999 | 251 | 3.6% |
| $15,000 to $24,999 | 377 | 5.4% |
| $25,000 to $34,999 | 601 | 8.6% |
| $35,000 to $49,999 | 789 | 11.3% |
| $50,000 to $74,999 | 1,446 | 20.7% |
| $75,000 to $99,999 | 1,034 | 14.8% |
| $100,000 to $149,999 | 1,285 | 18.4% |
| $150,000 to $199,999 | 622 | 8.9% |
| $200,000+ | 377 | 5.4% |
Household Income by Householder Age in Port Hueneme
The median household income in Port Hueneme is $71,695, with the highest median household income of $99,079 found in the 45 to 64 years age bracket for the primary householder. A total of 2,288 households (32.8%) fall into this category. Meanwhile, the 15 to 24 years age bracket for the primary householder has the lowest median household income of $55,000, with 292 households (4.2%) in this group.
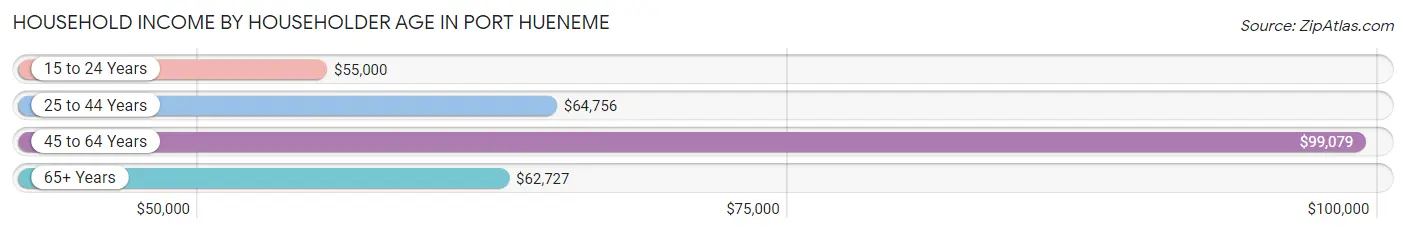
| Income Bracket | # Households | Median Income |
| 15 to 24 Years | 292 (4.2%) | $55,000 |
| 25 to 44 Years | 2,396 (34.3%) | $64,756 |
| 45 to 64 Years | 2,288 (32.8%) | $99,079 |
| 65+ Years | 2,008 (28.7%) | $62,727 |
| Total | 6,984 (100.0%) | $71,695 |
Poverty in Port Hueneme
Income Below Poverty by Sex and Age in Port Hueneme
With 10.6% poverty level for males and 15.4% for females among the residents of Port Hueneme, 15 year old males and 16 and 17 year old females are the most vulnerable to poverty, with 52 males (34.4%) and 82 females (39.2%) in their respective age groups living below the poverty level.
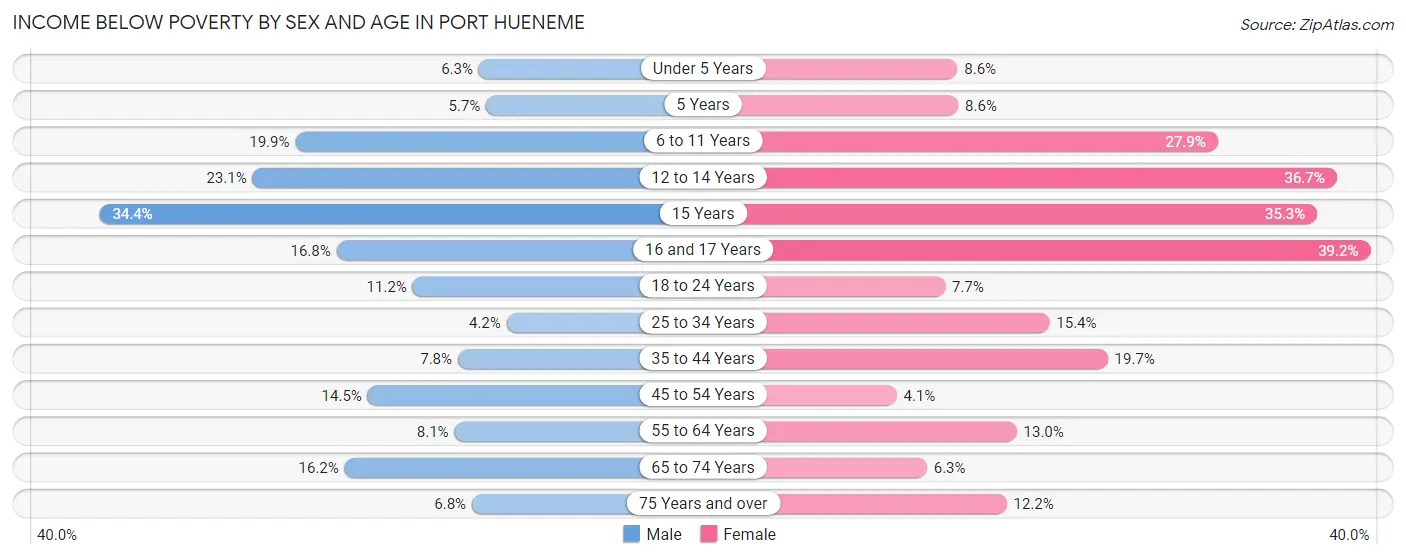
| Age Bracket | Male | Female |
| Under 5 Years | 41 (6.3%) | 77 (8.6%) |
| 5 Years | 9 (5.7%) | 14 (8.6%) |
| 6 to 11 Years | 193 (19.9%) | 190 (27.9%) |
| 12 to 14 Years | 60 (23.1%) | 220 (36.7%) |
| 15 Years | 52 (34.4%) | 24 (35.3%) |
| 16 and 17 Years | 16 (16.8%) | 82 (39.2%) |
| 18 to 24 Years | 95 (11.2%) | 59 (7.7%) |
| 25 to 34 Years | 91 (4.2%) | 248 (15.4%) |
| 35 to 44 Years | 121 (7.8%) | 348 (19.7%) |
| 45 to 54 Years | 150 (14.5%) | 32 (4.1%) |
| 55 to 64 Years | 98 (8.1%) | 185 (13.0%) |
| 65 to 74 Years | 146 (16.2%) | 51 (6.3%) |
| 75 Years and over | 29 (6.8%) | 108 (12.2%) |
| Total | 1,101 (10.6%) | 1,638 (15.4%) |
Income Above Poverty by Sex and Age in Port Hueneme
According to the poverty statistics in Port Hueneme, males aged 25 to 34 years and females aged 45 to 54 years are the age groups that are most secure financially, with 95.8% of males and 95.9% of females in these age groups living above the poverty line.
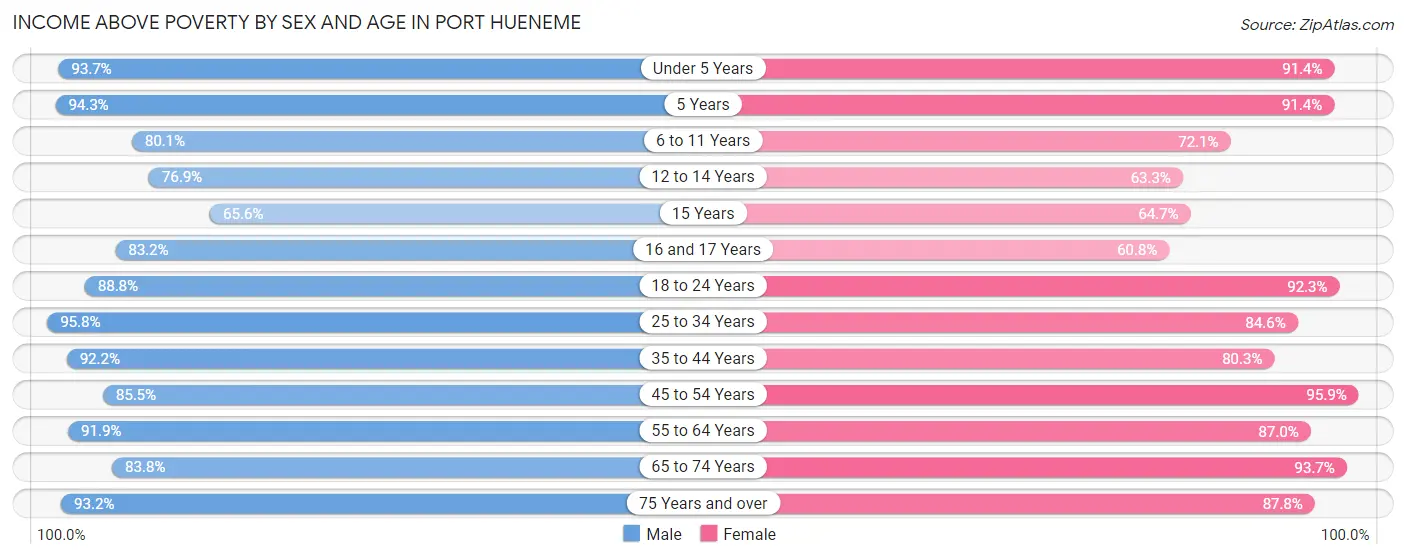
| Age Bracket | Male | Female |
| Under 5 Years | 612 (93.7%) | 820 (91.4%) |
| 5 Years | 148 (94.3%) | 148 (91.4%) |
| 6 to 11 Years | 777 (80.1%) | 491 (72.1%) |
| 12 to 14 Years | 200 (76.9%) | 379 (63.3%) |
| 15 Years | 99 (65.6%) | 44 (64.7%) |
| 16 and 17 Years | 79 (83.2%) | 127 (60.8%) |
| 18 to 24 Years | 754 (88.8%) | 711 (92.3%) |
| 25 to 34 Years | 2,070 (95.8%) | 1,361 (84.6%) |
| 35 to 44 Years | 1,425 (92.2%) | 1,415 (80.3%) |
| 45 to 54 Years | 882 (85.5%) | 754 (95.9%) |
| 55 to 64 Years | 1,114 (91.9%) | 1,240 (87.0%) |
| 65 to 74 Years | 753 (83.8%) | 757 (93.7%) |
| 75 Years and over | 398 (93.2%) | 775 (87.8%) |
| Total | 9,311 (89.4%) | 9,022 (84.6%) |
Income Below Poverty Among Married-Couple Families in Port Hueneme
The poverty statistics for married-couple families in Port Hueneme show that 5.6% or 171 of the total 3,037 families live below the poverty line. Families with 3 or 4 children have the highest poverty rate of 13.3%, comprising of 41 families. On the other hand, families with 5 or more children have the lowest poverty rate of 0.0%, which includes 0 families.
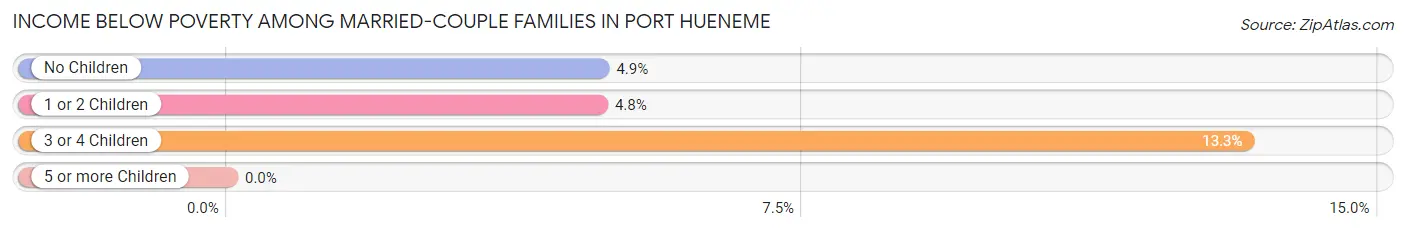
| Children | Above Poverty | Below Poverty |
| No Children | 1,569 (95.2%) | 80 (4.9%) |
| 1 or 2 Children | 986 (95.2%) | 50 (4.8%) |
| 3 or 4 Children | 268 (86.7%) | 41 (13.3%) |
| 5 or more Children | 43 (100.0%) | 0 (0.0%) |
| Total | 2,866 (94.4%) | 171 (5.6%) |
Income Below Poverty Among Single-Parent Households in Port Hueneme
According to the poverty data in Port Hueneme, 6.8% or 37 single-father households and 21.8% or 290 single-mother households are living below the poverty line. Among single-father households, those with 1 or 2 children have the highest poverty rate, with 29 households (14.1%) experiencing poverty. Likewise, among single-mother households, those with 3 or 4 children have the highest poverty rate, with 77 households (65.8%) falling below the poverty line.
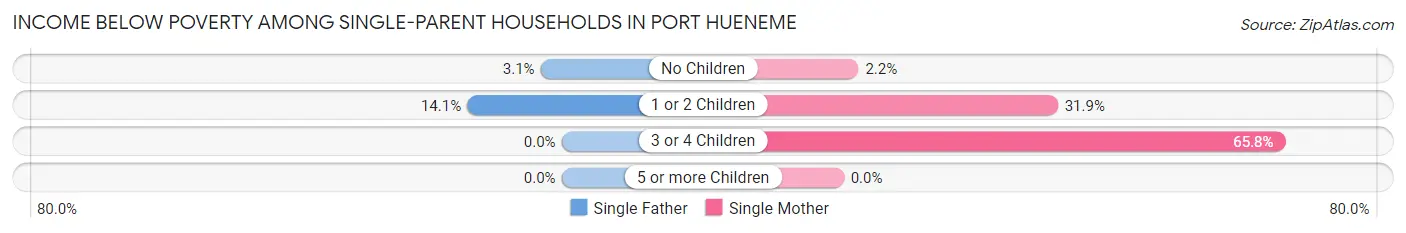
| Children | Single Father | Single Mother |
| No Children | 8 (3.1%) | 13 (2.2%) |
| 1 or 2 Children | 29 (14.1%) | 200 (31.9%) |
| 3 or 4 Children | 0 (0.0%) | 77 (65.8%) |
| 5 or more Children | 0 (0.0%) | 0 (0.0%) |
| Total | 37 (6.8%) | 290 (21.8%) |
Income Below Poverty Among Married-Couple vs Single-Parent Households in Port Hueneme
The poverty data for Port Hueneme shows that 171 of the married-couple family households (5.6%) and 327 of the single-parent households (17.4%) are living below the poverty level. Within the married-couple family households, those with 3 or 4 children have the highest poverty rate, with 41 households (13.3%) falling below the poverty line. Among the single-parent households, those with 3 or 4 children have the highest poverty rate, with 77 household (37.8%) living below poverty.
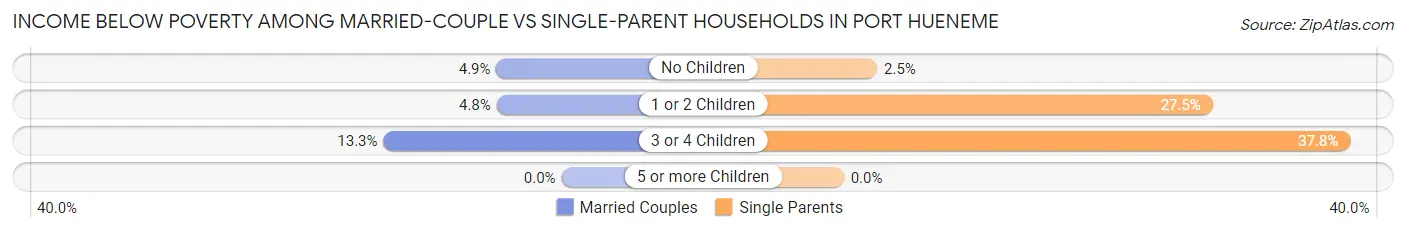
| Children | Married-Couple Families | Single-Parent Households |
| No Children | 80 (4.9%) | 21 (2.5%) |
| 1 or 2 Children | 50 (4.8%) | 229 (27.5%) |
| 3 or 4 Children | 41 (13.3%) | 77 (37.8%) |
| 5 or more Children | 0 (0.0%) | 0 (0.0%) |
| Total | 171 (5.6%) | 327 (17.4%) |
Race in Port Hueneme
The most populous races in Port Hueneme are Hispanic or Latino (13,747 | 62.9%), White / Caucasian (12,237 | 56.0%), and Two or more Races (5,698 | 26.1%).
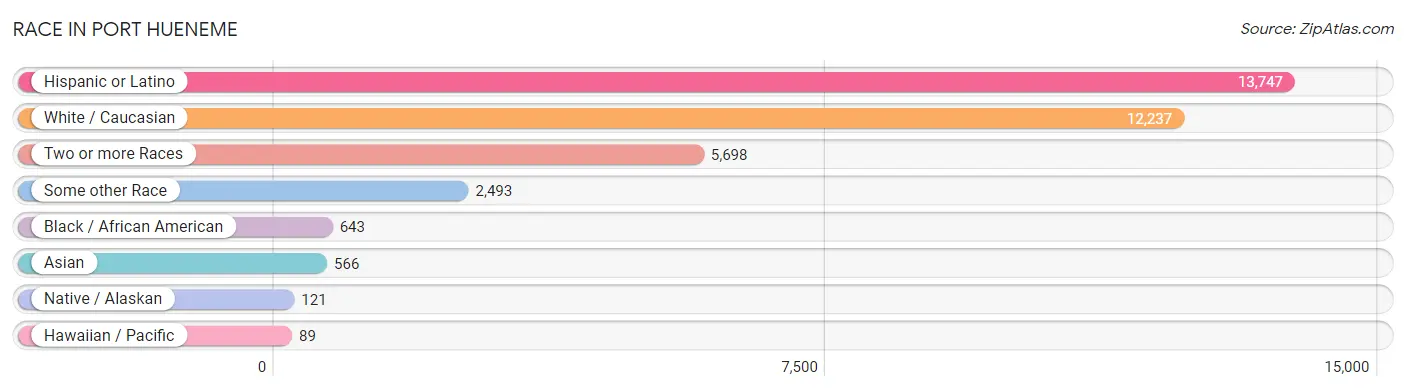
| Race | # Population | % Population |
| Asian | 566 | 2.6% |
| Black / African American | 643 | 2.9% |
| Hawaiian / Pacific | 89 | 0.4% |
| Hispanic or Latino | 13,747 | 62.9% |
| Native / Alaskan | 121 | 0.5% |
| White / Caucasian | 12,237 | 56.0% |
| Two or more Races | 5,698 | 26.1% |
| Some other Race | 2,493 | 11.4% |
| Total | 21,847 | 100.0% |
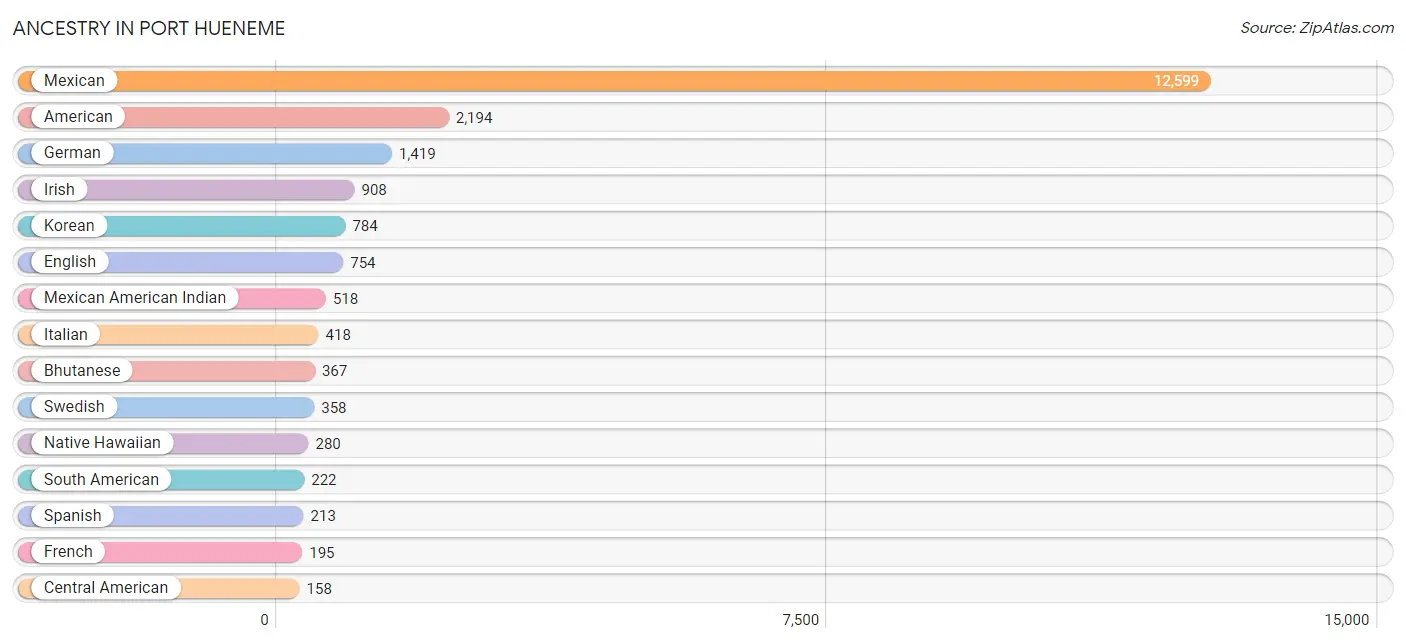
Ancestry in Port Hueneme
The most populous ancestries reported in Port Hueneme are Mexican (12,599 | 57.7%), American (2,194 | 10.0%), German (1,419 | 6.5%), Irish (908 | 4.2%), and Korean (784 | 3.6%), together accounting for 82.0% of all Port Hueneme residents.
| Ancestry | # Population | % Population |
| African | 64 | 0.3% |
| American | 2,194 | 10.0% |
| Arab | 64 | 0.3% |
| Australian | 24 | 0.1% |
| Austrian | 45 | 0.2% |
| Belgian | 7 | 0.0% |
| Bhutanese | 367 | 1.7% |
| Blackfeet | 18 | 0.1% |
| Brazilian | 5 | 0.0% |
| British | 27 | 0.1% |
| British West Indian | 6 | 0.0% |
| Burmese | 64 | 0.3% |
| Canadian | 74 | 0.3% |
| Central American | 158 | 0.7% |
| Cherokee | 80 | 0.4% |
| Choctaw | 7 | 0.0% |
| Colombian | 130 | 0.6% |
| Cuban | 47 | 0.2% |
| Czech | 35 | 0.2% |
| Danish | 29 | 0.1% |
| Dominican | 9 | 0.0% |
| Dutch | 120 | 0.5% |
| Eastern European | 2 | 0.0% |
| Ecuadorian | 92 | 0.4% |
| Egyptian | 40 | 0.2% |
| English | 754 | 3.5% |
| Ethiopian | 23 | 0.1% |
| European | 136 | 0.6% |
| French | 195 | 0.9% |
| French Canadian | 39 | 0.2% |
| German | 1,419 | 6.5% |
| Ghanaian | 7 | 0.0% |
| Greek | 43 | 0.2% |
| Guamanian / Chamorro | 52 | 0.2% |
| Guatemalan | 69 | 0.3% |
| Honduran | 25 | 0.1% |
| Hungarian | 39 | 0.2% |
| Icelander | 1 | 0.0% |
| Indian (Asian) | 44 | 0.2% |
| Iraqi | 10 | 0.1% |
| Irish | 908 | 4.2% |
| Italian | 418 | 1.9% |
| Jamaican | 18 | 0.1% |
| Korean | 784 | 3.6% |
| Malaysian | 13 | 0.1% |
| Maltese | 3 | 0.0% |
| Mexican | 12,599 | 57.7% |
| Mexican American Indian | 518 | 2.4% |
| Mongolian | 31 | 0.1% |
| Native Hawaiian | 280 | 1.3% |
| Nicaraguan | 16 | 0.1% |
| Northern European | 13 | 0.1% |
| Norwegian | 115 | 0.5% |
| Palestinian | 14 | 0.1% |
| Polish | 105 | 0.5% |
| Portuguese | 39 | 0.2% |
| Puerto Rican | 70 | 0.3% |
| Russian | 144 | 0.7% |
| Salvadoran | 48 | 0.2% |
| Samoan | 27 | 0.1% |
| Scandinavian | 53 | 0.2% |
| Scotch-Irish | 75 | 0.3% |
| Scottish | 155 | 0.7% |
| South American | 222 | 1.0% |
| Spaniard | 96 | 0.4% |
| Spanish | 213 | 1.0% |
| Sri Lankan | 75 | 0.3% |
| Subsaharan African | 94 | 0.4% |
| Swedish | 358 | 1.6% |
| Swiss | 6 | 0.0% |
| Thai | 18 | 0.1% |
| Tohono O'Odham | 157 | 0.7% |
| Ukrainian | 20 | 0.1% |
| Welsh | 10 | 0.1% |
| West Indian | 6 | 0.0% |
| Yaqui | 33 | 0.2% |
| Yugoslavian | 106 | 0.5% | View All 77 Rows |
Immigrants in Port Hueneme
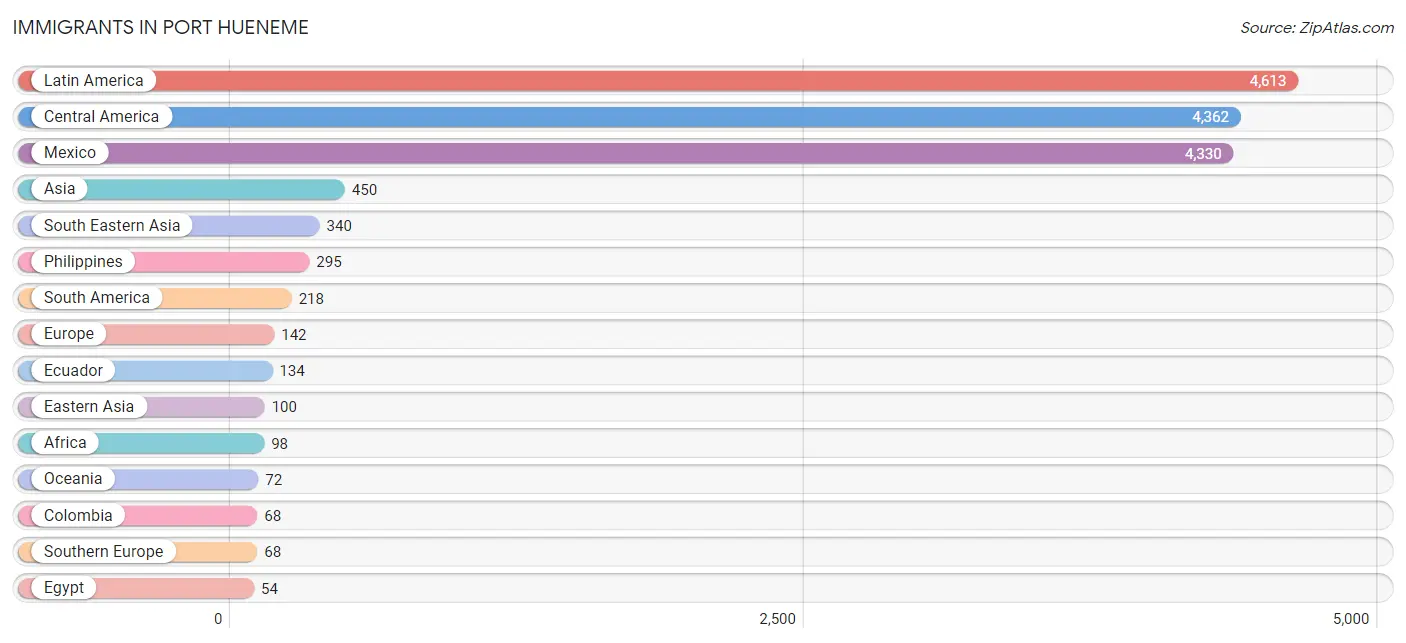
The most numerous immigrant groups reported in Port Hueneme came from Latin America (4,613 | 21.1%), Central America (4,362 | 20.0%), Mexico (4,330 | 19.8%), Asia (450 | 2.1%), and South Eastern Asia (340 | 1.6%), together accounting for 64.5% of all Port Hueneme residents.
| Immigration Origin | # Population | % Population |
| Africa | 98 | 0.4% |
| Asia | 450 | 2.1% |
| Australia | 34 | 0.2% |
| Canada | 28 | 0.1% |
| Caribbean | 33 | 0.2% |
| Central America | 4,362 | 20.0% |
| China | 35 | 0.2% |
| Colombia | 68 | 0.3% |
| Cuba | 18 | 0.1% |
| Dominican Republic | 9 | 0.0% |
| Eastern Africa | 23 | 0.1% |
| Eastern Asia | 100 | 0.5% |
| Eastern Europe | 31 | 0.1% |
| Ecuador | 134 | 0.6% |
| Egypt | 54 | 0.3% |
| Ethiopia | 23 | 0.1% |
| Europe | 142 | 0.6% |
| Germany | 14 | 0.1% |
| Ghana | 21 | 0.1% |
| Grenada | 6 | 0.0% |
| Guyana | 16 | 0.1% |
| Honduras | 16 | 0.1% |
| Japan | 19 | 0.1% |
| Kazakhstan | 10 | 0.1% |
| Korea | 46 | 0.2% |
| Latin America | 4,613 | 21.1% |
| Mexico | 4,330 | 19.8% |
| Netherlands | 8 | 0.0% |
| Nicaragua | 16 | 0.1% |
| Northern Africa | 54 | 0.3% |
| Northern Europe | 21 | 0.1% |
| Oceania | 72 | 0.3% |
| Philippines | 295 | 1.3% |
| Russia | 21 | 0.1% |
| South America | 218 | 1.0% |
| South Central Asia | 10 | 0.1% |
| South Eastern Asia | 340 | 1.6% |
| Southern Europe | 68 | 0.3% |
| Spain | 53 | 0.2% |
| Ukraine | 10 | 0.1% |
| Vietnam | 45 | 0.2% |
| Western Africa | 21 | 0.1% |
| Western Europe | 22 | 0.1% | View All 43 Rows |
Sex and Age in Port Hueneme
Sex and Age in Port Hueneme
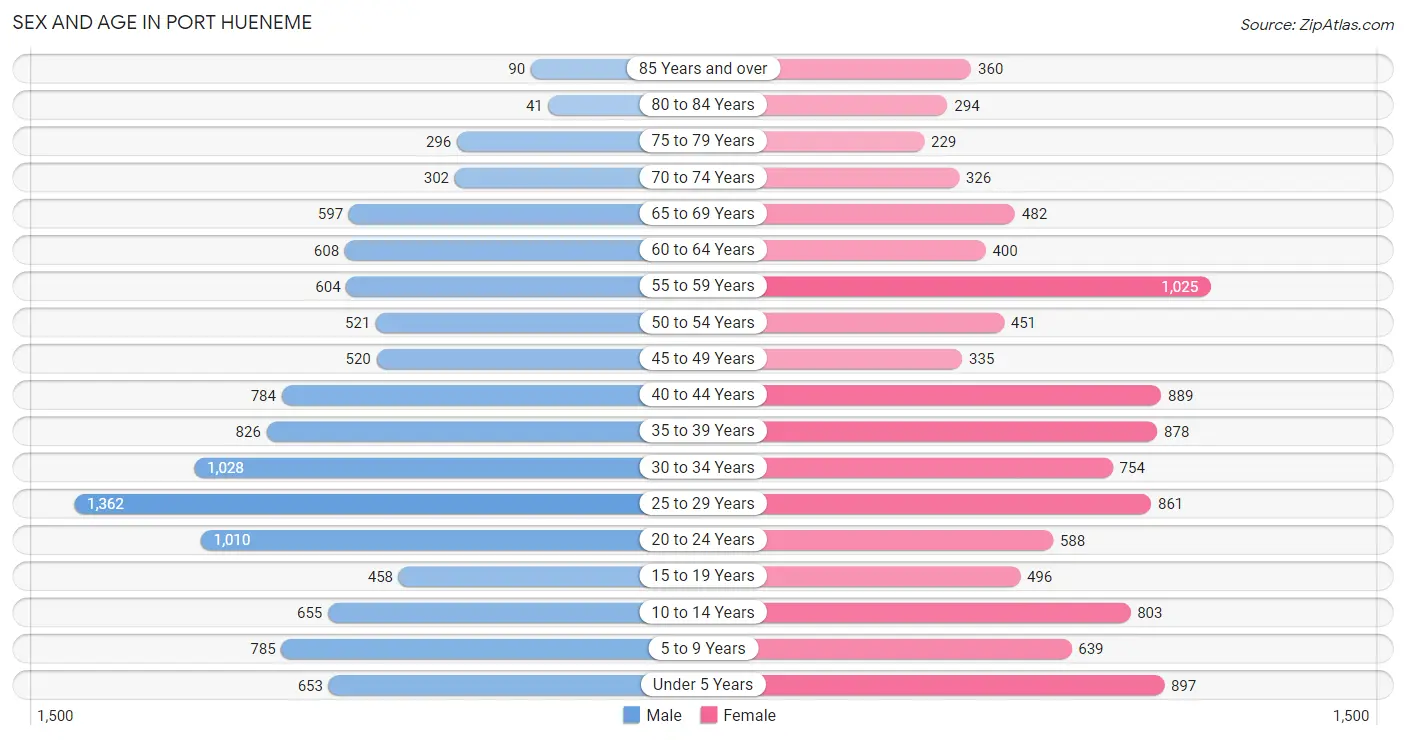
The most populous age groups in Port Hueneme are 25 to 29 Years (1,362 | 12.2%) for men and 55 to 59 Years (1,025 | 9.6%) for women.
| Age Bracket | Male | Female |
| Under 5 Years | 653 (5.9%) | 897 (8.4%) |
| 5 to 9 Years | 785 (7.0%) | 639 (6.0%) |
| 10 to 14 Years | 655 (5.9%) | 803 (7.5%) |
| 15 to 19 Years | 458 (4.1%) | 496 (4.6%) |
| 20 to 24 Years | 1,010 (9.1%) | 588 (5.5%) |
| 25 to 29 Years | 1,362 (12.2%) | 861 (8.0%) |
| 30 to 34 Years | 1,028 (9.2%) | 754 (7.0%) |
| 35 to 39 Years | 826 (7.4%) | 878 (8.2%) |
| 40 to 44 Years | 784 (7.0%) | 889 (8.3%) |
| 45 to 49 Years | 520 (4.7%) | 335 (3.1%) |
| 50 to 54 Years | 521 (4.7%) | 451 (4.2%) |
| 55 to 59 Years | 604 (5.4%) | 1,025 (9.6%) |
| 60 to 64 Years | 608 (5.5%) | 400 (3.7%) |
| 65 to 69 Years | 597 (5.4%) | 482 (4.5%) |
| 70 to 74 Years | 302 (2.7%) | 326 (3.0%) |
| 75 to 79 Years | 296 (2.7%) | 229 (2.1%) |
| 80 to 84 Years | 41 (0.4%) | 294 (2.8%) |
| 85 Years and over | 90 (0.8%) | 360 (3.4%) |
| Total | 11,140 (100.0%) | 10,707 (100.0%) |
Families and Households in Port Hueneme
Median Family Size in Port Hueneme
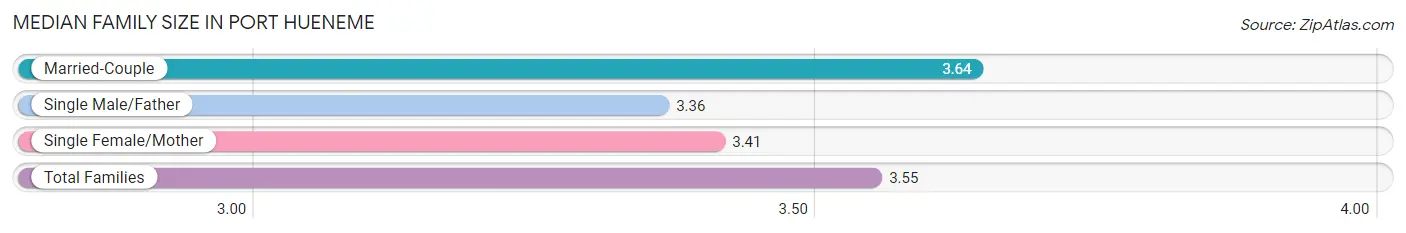
The median family size in Port Hueneme is 3.55 persons per family, with married-couple families (3,037 | 61.8%) accounting for the largest median family size of 3.64 persons per family. On the other hand, single male/father families (548 | 11.2%) represent the smallest median family size with 3.36 persons per family.
| Family Type | # Families | Family Size |
| Married-Couple | 3,037 (61.8%) | 3.64 |
| Single Male/Father | 548 (11.2%) | 3.36 |
| Single Female/Mother | 1,331 (27.1%) | 3.41 |
| Total Families | 4,916 (100.0%) | 3.55 |
Median Household Size in Port Hueneme
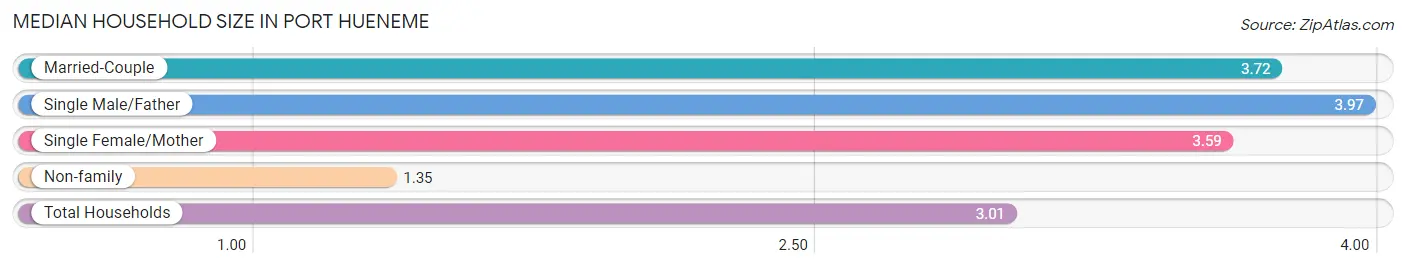
The median household size in Port Hueneme is 3.01 persons per household, with single male/father households (548 | 7.9%) accounting for the largest median household size of 3.97 persons per household. non-family households (2,068 | 29.6%) represent the smallest median household size with 1.35 persons per household.
| Household Type | # Households | Household Size |
| Married-Couple | 3,037 (43.5%) | 3.72 |
| Single Male/Father | 548 (7.9%) | 3.97 |
| Single Female/Mother | 1,331 (19.1%) | 3.59 |
| Non-family | 2,068 (29.6%) | 1.35 |
| Total Households | 6,984 (100.0%) | 3.01 |
Household Size by Marriage Status in Port Hueneme
Out of a total of 6,984 households in Port Hueneme, 4,916 (70.4%) are family households, while 2,068 (29.6%) are nonfamily households. The most numerous type of family households are 2-person households, comprising 2,089, and the most common type of nonfamily households are 1-person households, comprising 1,621.
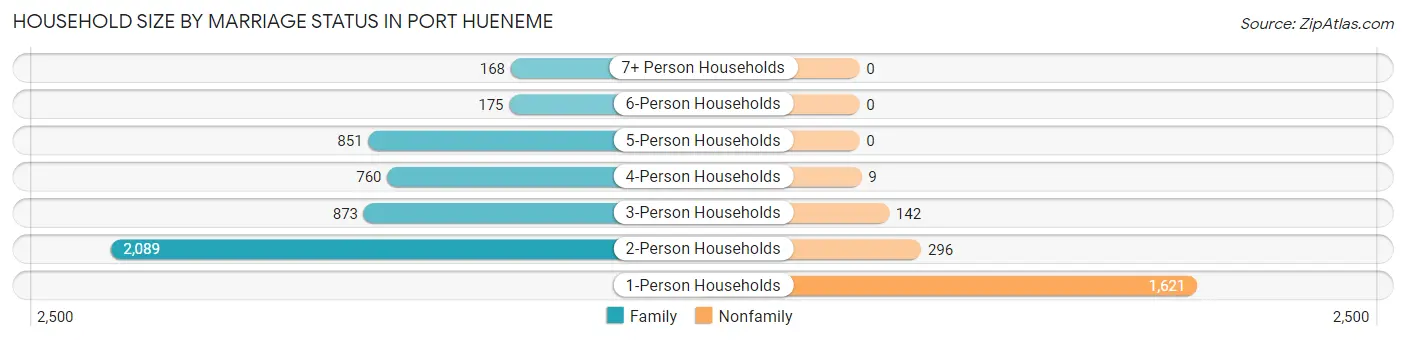
| Household Size | Family Households | Nonfamily Households |
| 1-Person Households | - | 1,621 (23.2%) |
| 2-Person Households | 2,089 (29.9%) | 296 (4.2%) |
| 3-Person Households | 873 (12.5%) | 142 (2.0%) |
| 4-Person Households | 760 (10.9%) | 9 (0.1%) |
| 5-Person Households | 851 (12.2%) | 0 (0.0%) |
| 6-Person Households | 175 (2.5%) | 0 (0.0%) |
| 7+ Person Households | 168 (2.4%) | 0 (0.0%) |
| Total | 4,916 (70.4%) | 2,068 (29.6%) |
Female Fertility in Port Hueneme
Fertility by Age in Port Hueneme
Average fertility rate in Port Hueneme is 113.0 births per 1,000 women. Women in the age bracket of 20 to 34 years have the highest fertility rate with 222.0 births per 1,000 women. Women in the age bracket of 20 to 34 years acount for 85.9% of all women with births.
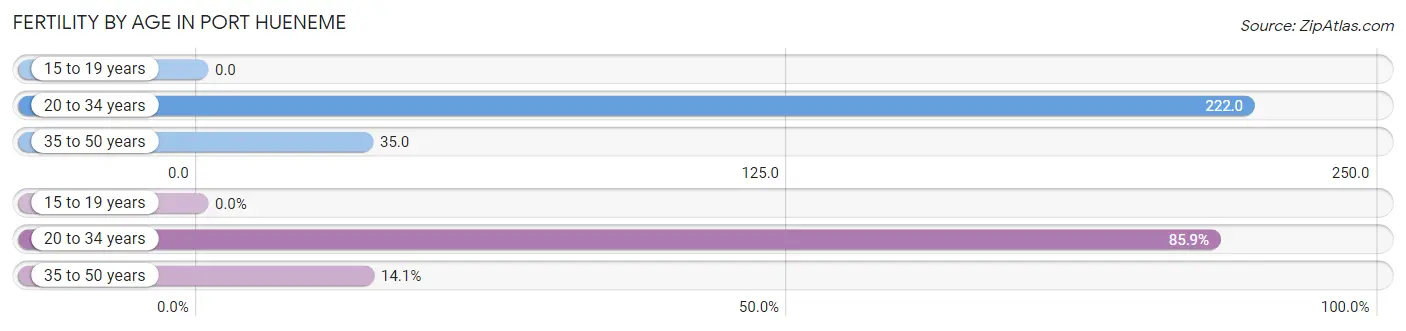
| Age Bracket | Women with Births | Births / 1,000 Women |
| 15 to 19 years | 0 (0.0%) | 0.0 |
| 20 to 34 years | 488 (85.9%) | 222.0 |
| 35 to 50 years | 80 (14.1%) | 35.0 |
| Total | 568 (100.0%) | 113.0 |
Fertility by Age by Marriage Status in Port Hueneme
66.0% of women with births (568) in Port Hueneme are married. The highest percentage of unmarried women with births falls into 20 to 34 years age bracket with 34.6% of them unmarried at the time of birth, while the lowest percentage of unmarried women with births belong to 35 to 50 years age bracket with 30.0% of them unmarried.
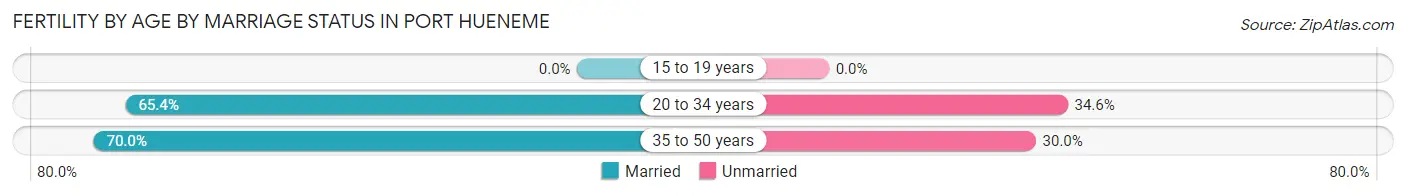
| Age Bracket | Married | Unmarried |
| 15 to 19 years | 0 (0.0%) | 0 (0.0%) |
| 20 to 34 years | 319 (65.4%) | 169 (34.6%) |
| 35 to 50 years | 56 (70.0%) | 24 (30.0%) |
| Total | 375 (66.0%) | 193 (34.0%) |
Fertility by Education in Port Hueneme
Average fertility rate in Port Hueneme is 113.0 births per 1,000 women. Women with the education attainment of bachelor's degree have the highest fertility rate of 162.0 births per 1,000 women, while women with the education attainment of less than high school have the lowest fertility at 50.0 births per 1,000 women. Women with the education attainment of college or associate's degree represent 39.3% of all women with births.
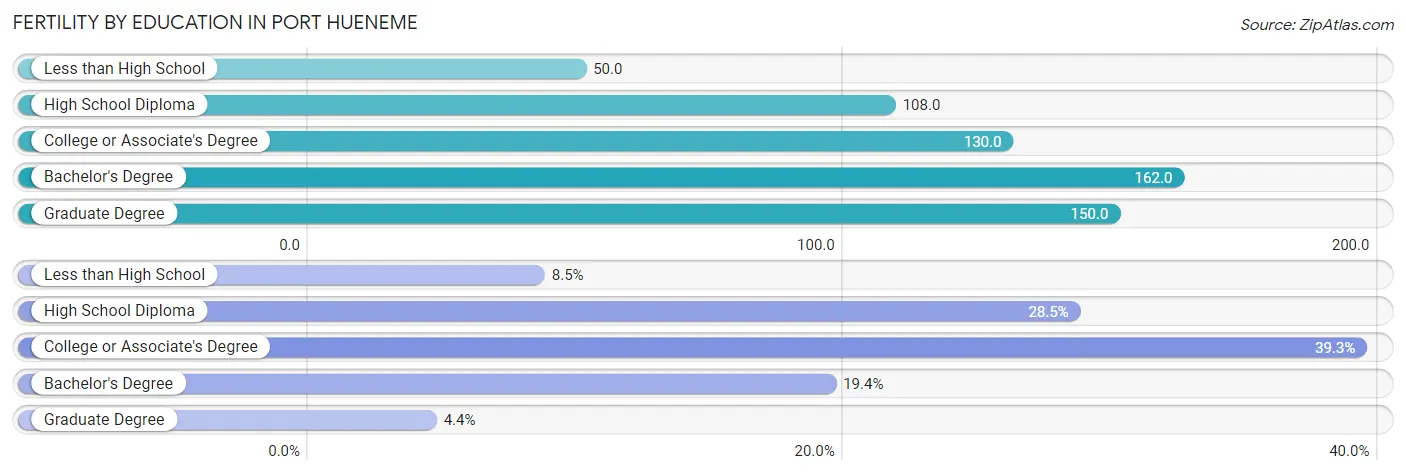
| Educational Attainment | Women with Births | Births / 1,000 Women |
| Less than High School | 48 (8.5%) | 50.0 |
| High School Diploma | 162 (28.5%) | 108.0 |
| College or Associate's Degree | 223 (39.3%) | 130.0 |
| Bachelor's Degree | 110 (19.4%) | 162.0 |
| Graduate Degree | 25 (4.4%) | 150.0 |
| Total | 568 (100.0%) | 113.0 |
Fertility by Education by Marriage Status in Port Hueneme
34.0% of women with births in Port Hueneme are unmarried. Women with the educational attainment of graduate degree are most likely to be married with 100.0% of them married at childbirth, while women with the educational attainment of less than high school are least likely to be married with 100.0% of them unmarried at childbirth.
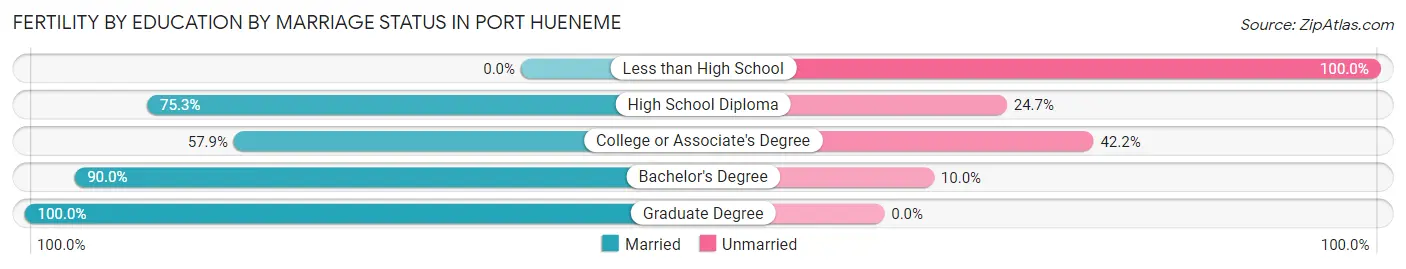
| Educational Attainment | Married | Unmarried |
| Less than High School | 0 (0.0%) | 48 (100.0%) |
| High School Diploma | 122 (75.3%) | 40 (24.7%) |
| College or Associate's Degree | 129 (57.9%) | 94 (42.1%) |
| Bachelor's Degree | 99 (90.0%) | 11 (10.0%) |
| Graduate Degree | 25 (100.0%) | 0 (0.0%) |
| Total | 375 (66.0%) | 193 (34.0%) |
Employment Characteristics in Port Hueneme
Employment by Class of Employer in Port Hueneme
Among the 10,585 employed individuals in Port Hueneme, private company employees (6,709 | 63.4%), federal government employees (1,707 | 16.1%), and local government employees (1,090 | 10.3%) make up the most common classes of employment.
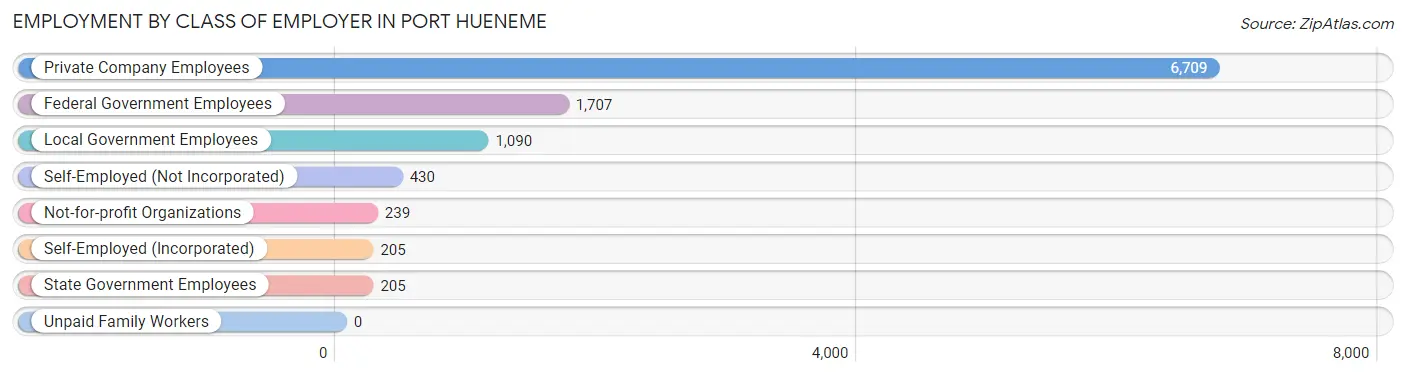
| Employer Class | # Employees | % Employees |
| Private Company Employees | 6,709 | 63.4% |
| Self-Employed (Incorporated) | 205 | 1.9% |
| Self-Employed (Not Incorporated) | 430 | 4.1% |
| Not-for-profit Organizations | 239 | 2.3% |
| Local Government Employees | 1,090 | 10.3% |
| State Government Employees | 205 | 1.9% |
| Federal Government Employees | 1,707 | 16.1% |
| Unpaid Family Workers | 0 | 0.0% |
| Total | 10,585 | 100.0% |
Employment Status by Age in Port Hueneme
According to the labor force statistics for Port Hueneme, out of the total population over 16 years of age (17,196), 69.2% or 11,900 individuals are in the labor force, with 8.9% or 1,059 of them unemployed. The age group with the highest labor force participation rate is 25 to 29 years, with 87.5% or 1,945 individuals in the labor force. Within the labor force, the 25 to 29 years age range has the highest percentage of unemployed individuals, with 20.6% or 401 of them being unemployed.
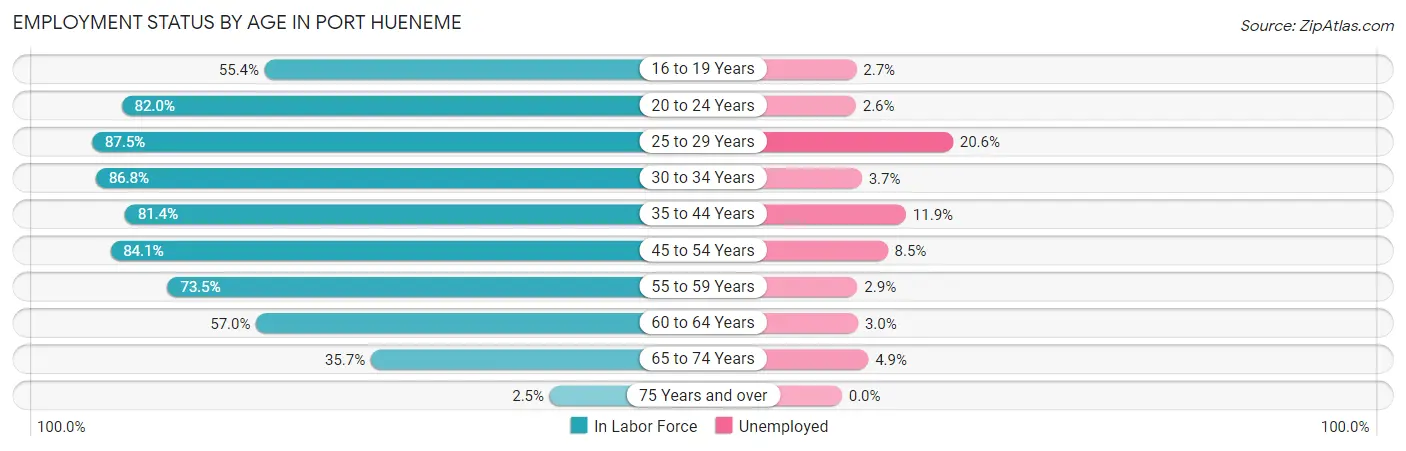
| Age Bracket | In Labor Force | Unemployed |
| 16 to 19 Years | 407 (55.4%) | 11 (2.7%) |
| 20 to 24 Years | 1,310 (82.0%) | 34 (2.6%) |
| 25 to 29 Years | 1,945 (87.5%) | 401 (20.6%) |
| 30 to 34 Years | 1,547 (86.8%) | 57 (3.7%) |
| 35 to 44 Years | 2,749 (81.4%) | 327 (11.9%) |
| 45 to 54 Years | 1,537 (84.1%) | 131 (8.5%) |
| 55 to 59 Years | 1,197 (73.5%) | 35 (2.9%) |
| 60 to 64 Years | 575 (57.0%) | 17 (3.0%) |
| 65 to 74 Years | 609 (35.7%) | 30 (4.9%) |
| 75 Years and over | 33 (2.5%) | 0 (0.0%) |
| Total | 11,900 (69.2%) | 1,059 (8.9%) |
Employment Status by Educational Attainment in Port Hueneme
According to labor force statistics for Port Hueneme, 80.6% of individuals (9,548) out of the total population between 25 and 64 years of age (11,846) are in the labor force, with 10.0% or 955 of them being unemployed. The group with the highest labor force participation rate are those with the educational attainment of college / associate degree, with 89.0% or 3,418 individuals in the labor force. Within the labor force, individuals with less than high school education have the highest percentage of unemployment, with 14.3% or 233 of them being unemployed.
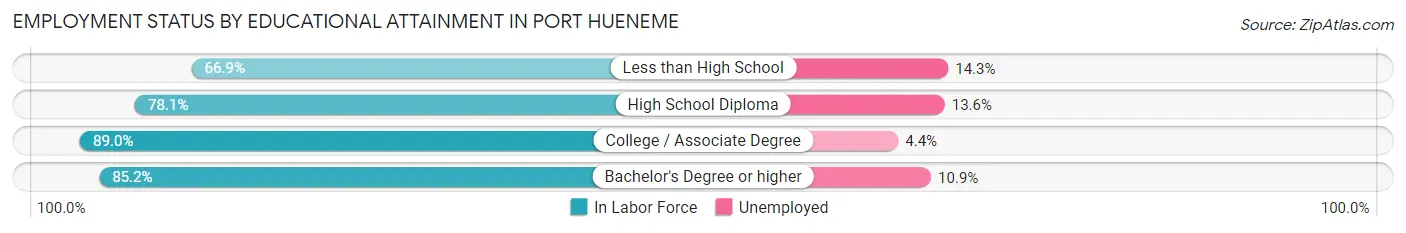
| Educational Attainment | In Labor Force | Unemployed |
| Less than High School | 1,629 (66.9%) | 348 (14.3%) |
| High School Diploma | 2,678 (78.1%) | 466 (13.6%) |
| College / Associate Degree | 3,418 (89.0%) | 169 (4.4%) |
| Bachelor's Degree or higher | 1,824 (85.2%) | 233 (10.9%) |
| Total | 9,548 (80.6%) | 1,185 (10.0%) |
Employment Occupations by Sex in Port Hueneme
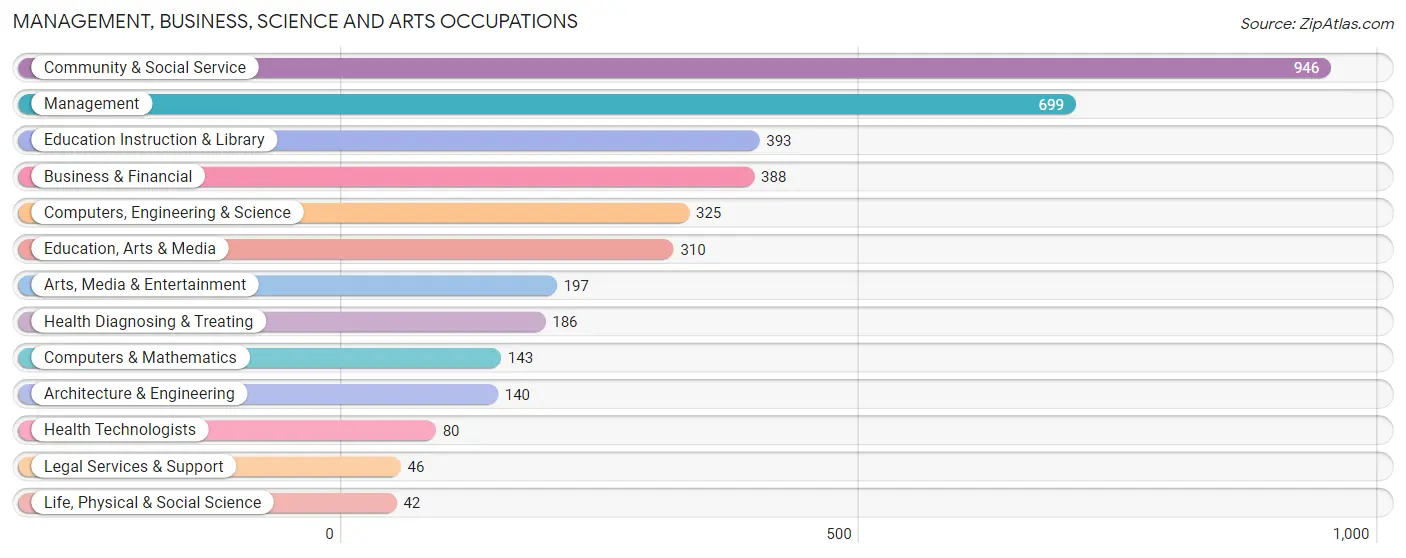
Management, Business, Science and Arts Occupations
The most common Management, Business, Science and Arts occupations in Port Hueneme are Community & Social Service (946 | 9.7%), Management (699 | 7.2%), Education Instruction & Library (393 | 4.0%), Business & Financial (388 | 4.0%), and Computers, Engineering & Science (325 | 3.3%).
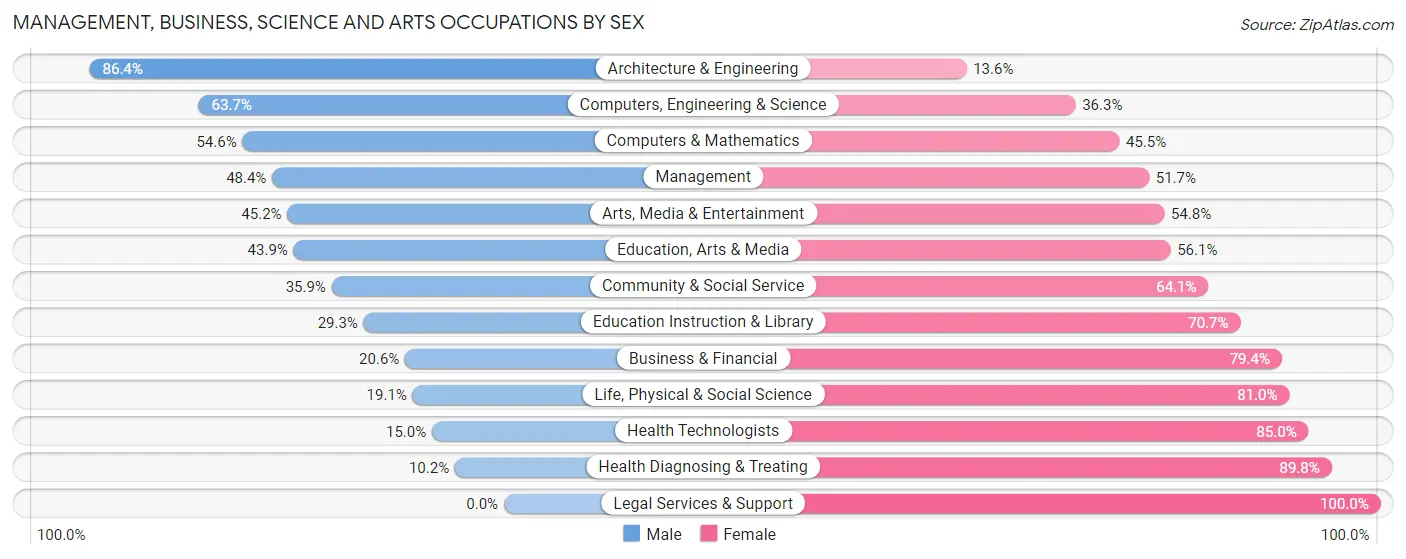
Management, Business, Science and Arts Occupations by Sex
Within the Management, Business, Science and Arts occupations in Port Hueneme, the most male-oriented occupations are Architecture & Engineering (86.4%), Computers, Engineering & Science (63.7%), and Computers & Mathematics (54.5%), while the most female-oriented occupations are Legal Services & Support (100.0%), Health Diagnosing & Treating (89.8%), and Health Technologists (85.0%).
| Occupation | Male | Female |
| Management | 338 (48.3%) | 361 (51.6%) |
| Business & Financial | 80 (20.6%) | 308 (79.4%) |
| Computers, Engineering & Science | 207 (63.7%) | 118 (36.3%) |
| Computers & Mathematics | 78 (54.5%) | 65 (45.5%) |
| Architecture & Engineering | 121 (86.4%) | 19 (13.6%) |
| Life, Physical & Social Science | 8 (19.1%) | 34 (80.9%) |
| Community & Social Service | 340 (35.9%) | 606 (64.1%) |
| Education, Arts & Media | 136 (43.9%) | 174 (56.1%) |
| Legal Services & Support | 0 (0.0%) | 46 (100.0%) |
| Education Instruction & Library | 115 (29.3%) | 278 (70.7%) |
| Arts, Media & Entertainment | 89 (45.2%) | 108 (54.8%) |
| Health Diagnosing & Treating | 19 (10.2%) | 167 (89.8%) |
| Health Technologists | 12 (15.0%) | 68 (85.0%) |
| Total (Category) | 984 (38.7%) | 1,560 (61.3%) |
| Total (Overall) | 5,241 (53.7%) | 4,515 (46.3%) |
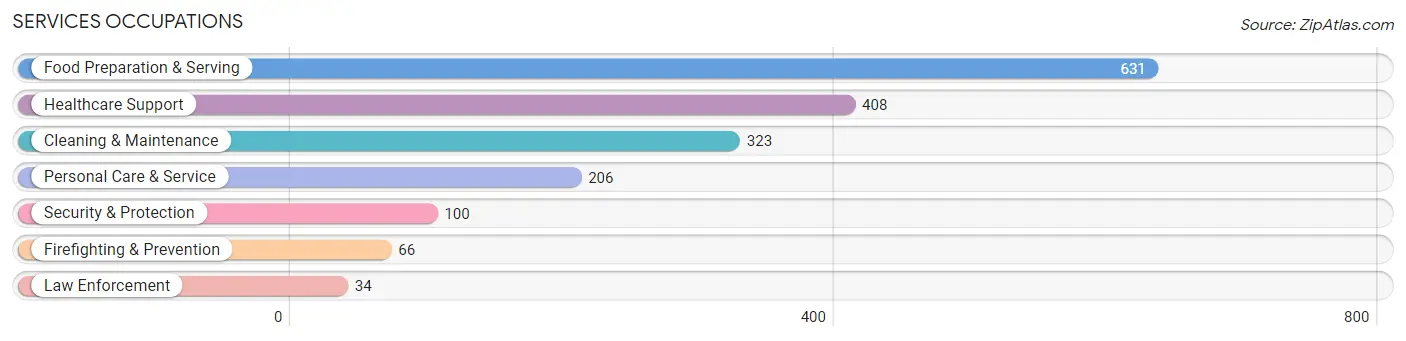
Services Occupations
The most common Services occupations in Port Hueneme are Food Preparation & Serving (631 | 6.5%), Healthcare Support (408 | 4.2%), Cleaning & Maintenance (323 | 3.3%), Personal Care & Service (206 | 2.1%), and Security & Protection (100 | 1.0%).
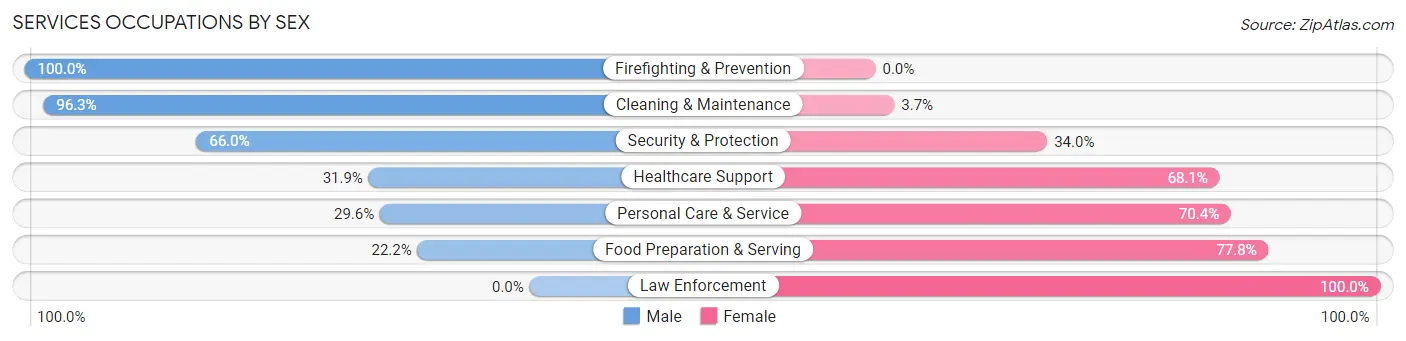
Services Occupations by Sex
Within the Services occupations in Port Hueneme, the most male-oriented occupations are Firefighting & Prevention (100.0%), Cleaning & Maintenance (96.3%), and Security & Protection (66.0%), while the most female-oriented occupations are Law Enforcement (100.0%), Food Preparation & Serving (77.8%), and Personal Care & Service (70.4%).
| Occupation | Male | Female |
| Healthcare Support | 130 (31.9%) | 278 (68.1%) |
| Security & Protection | 66 (66.0%) | 34 (34.0%) |
| Firefighting & Prevention | 66 (100.0%) | 0 (0.0%) |
| Law Enforcement | 0 (0.0%) | 34 (100.0%) |
| Food Preparation & Serving | 140 (22.2%) | 491 (77.8%) |
| Cleaning & Maintenance | 311 (96.3%) | 12 (3.7%) |
| Personal Care & Service | 61 (29.6%) | 145 (70.4%) |
| Total (Category) | 708 (42.4%) | 960 (57.6%) |
| Total (Overall) | 5,241 (53.7%) | 4,515 (46.3%) |
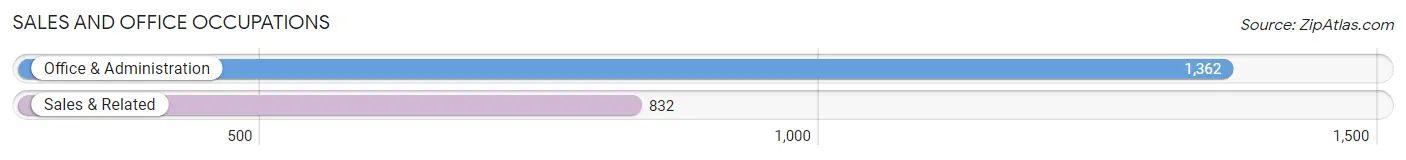
Sales and Office Occupations
The most common Sales and Office occupations in Port Hueneme are Office & Administration (1,362 | 14.0%), and Sales & Related (832 | 8.5%).
Sales and Office Occupations by Sex
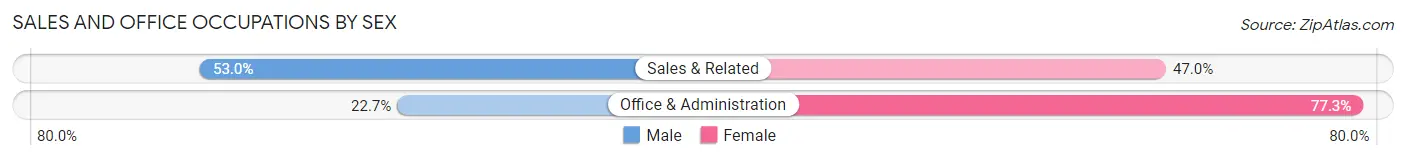
| Occupation | Male | Female |
| Sales & Related | 441 (53.0%) | 391 (47.0%) |
| Office & Administration | 309 (22.7%) | 1,053 (77.3%) |
| Total (Category) | 750 (34.2%) | 1,444 (65.8%) |
| Total (Overall) | 5,241 (53.7%) | 4,515 (46.3%) |
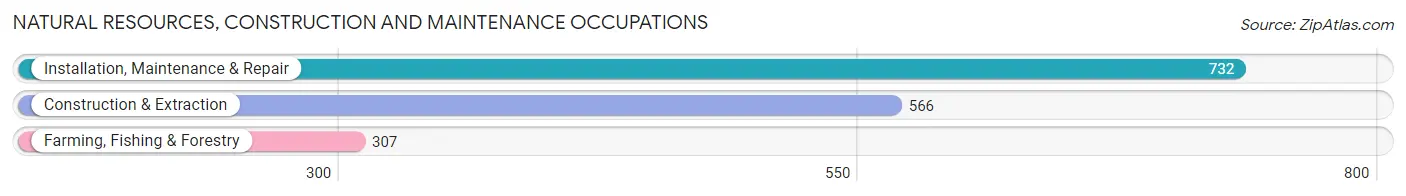
Natural Resources, Construction and Maintenance Occupations
The most common Natural Resources, Construction and Maintenance occupations in Port Hueneme are Installation, Maintenance & Repair (732 | 7.5%), Construction & Extraction (566 | 5.8%), and Farming, Fishing & Forestry (307 | 3.2%).
Natural Resources, Construction and Maintenance Occupations by Sex
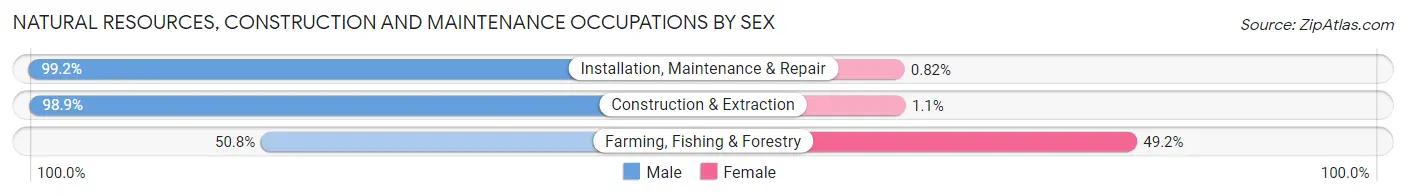
| Occupation | Male | Female |
| Farming, Fishing & Forestry | 156 (50.8%) | 151 (49.2%) |
| Construction & Extraction | 560 (98.9%) | 6 (1.1%) |
| Installation, Maintenance & Repair | 726 (99.2%) | 6 (0.8%) |
| Total (Category) | 1,442 (89.8%) | 163 (10.2%) |
| Total (Overall) | 5,241 (53.7%) | 4,515 (46.3%) |
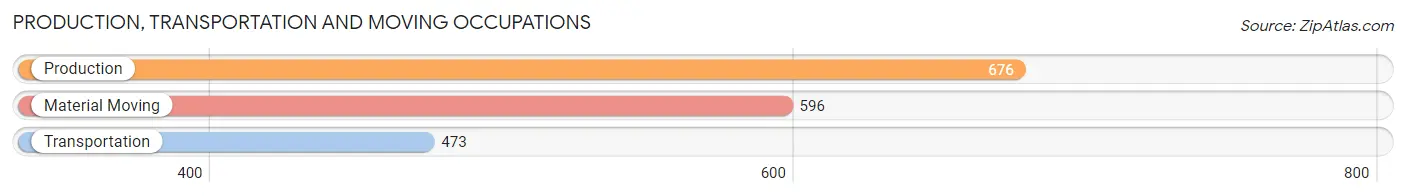
Production, Transportation and Moving Occupations
The most common Production, Transportation and Moving occupations in Port Hueneme are Production (676 | 6.9%), Material Moving (596 | 6.1%), and Transportation (473 | 4.9%).
Production, Transportation and Moving Occupations by Sex
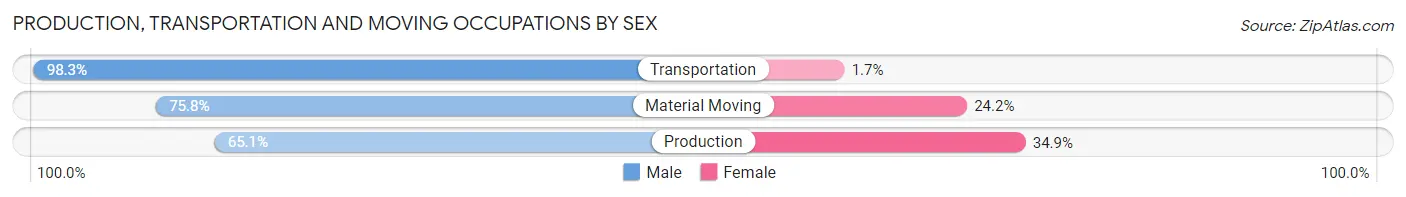
| Occupation | Male | Female |
| Production | 440 (65.1%) | 236 (34.9%) |
| Transportation | 465 (98.3%) | 8 (1.7%) |
| Material Moving | 452 (75.8%) | 144 (24.2%) |
| Total (Category) | 1,357 (77.8%) | 388 (22.2%) |
| Total (Overall) | 5,241 (53.7%) | 4,515 (46.3%) |
Employment Industries by Sex in Port Hueneme
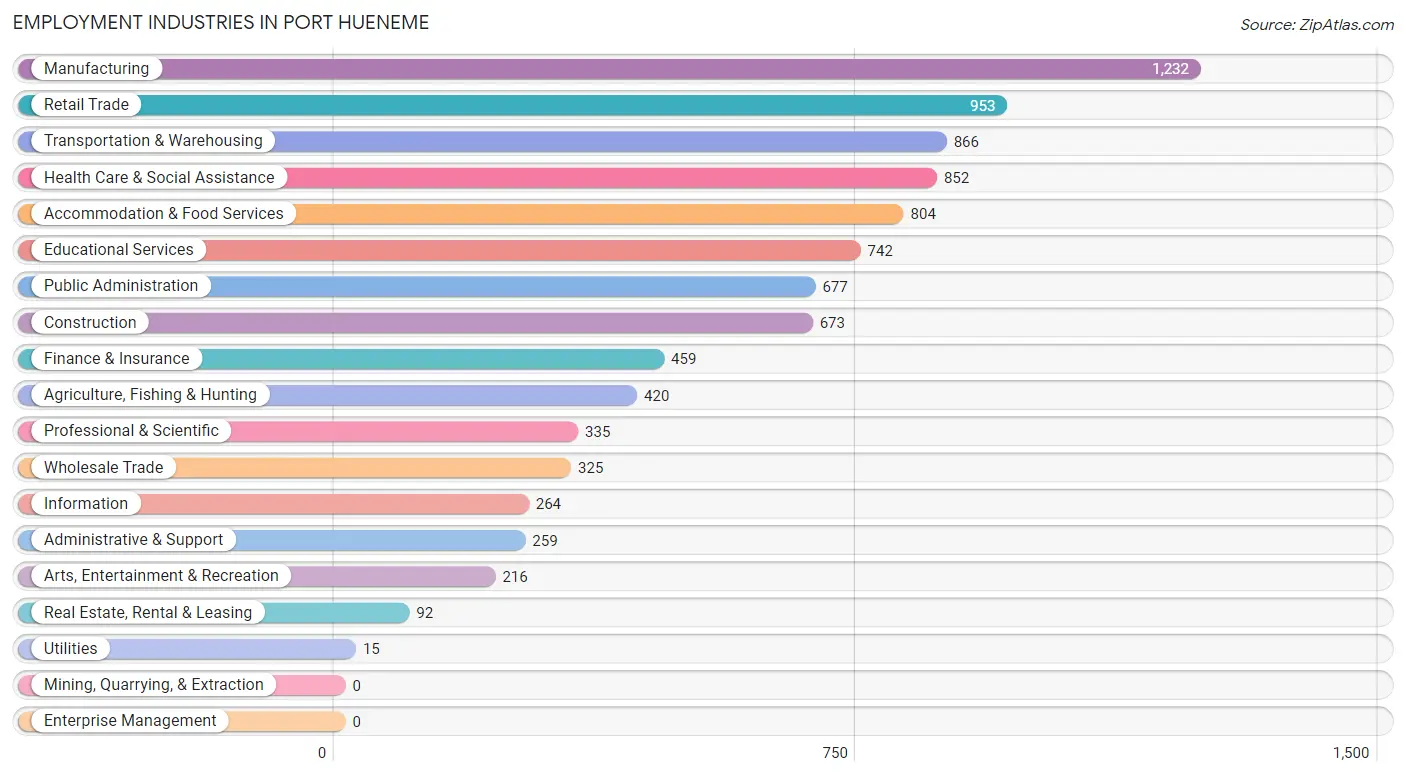
Employment Industries in Port Hueneme
The major employment industries in Port Hueneme include Manufacturing (1,232 | 12.6%), Retail Trade (953 | 9.8%), Transportation & Warehousing (866 | 8.9%), Health Care & Social Assistance (852 | 8.7%), and Accommodation & Food Services (804 | 8.2%).
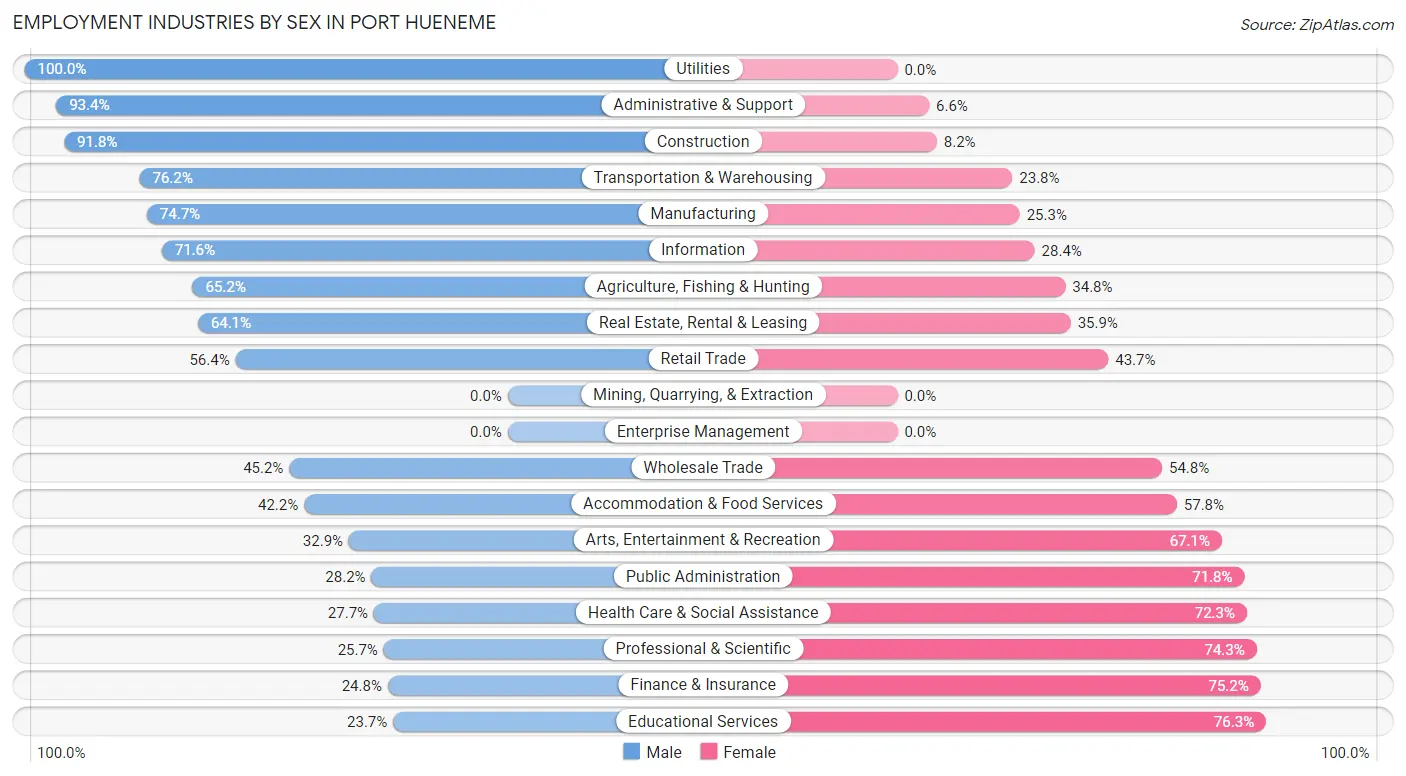
Employment Industries by Sex in Port Hueneme
The Port Hueneme industries that see more men than women are Utilities (100.0%), Administrative & Support (93.4%), and Construction (91.8%), whereas the industries that tend to have a higher number of women are Educational Services (76.3%), Finance & Insurance (75.2%), and Professional & Scientific (74.3%).
| Industry | Male | Female |
| Agriculture, Fishing & Hunting | 274 (65.2%) | 146 (34.8%) |
| Mining, Quarrying, & Extraction | 0 (0.0%) | 0 (0.0%) |
| Construction | 618 (91.8%) | 55 (8.2%) |
| Manufacturing | 920 (74.7%) | 312 (25.3%) |
| Wholesale Trade | 147 (45.2%) | 178 (54.8%) |
| Retail Trade | 537 (56.4%) | 416 (43.6%) |
| Transportation & Warehousing | 660 (76.2%) | 206 (23.8%) |
| Utilities | 15 (100.0%) | 0 (0.0%) |
| Information | 189 (71.6%) | 75 (28.4%) |
| Finance & Insurance | 114 (24.8%) | 345 (75.2%) |
| Real Estate, Rental & Leasing | 59 (64.1%) | 33 (35.9%) |
| Professional & Scientific | 86 (25.7%) | 249 (74.3%) |
| Enterprise Management | 0 (0.0%) | 0 (0.0%) |
| Administrative & Support | 242 (93.4%) | 17 (6.6%) |
| Educational Services | 176 (23.7%) | 566 (76.3%) |
| Health Care & Social Assistance | 236 (27.7%) | 616 (72.3%) |
| Arts, Entertainment & Recreation | 71 (32.9%) | 145 (67.1%) |
| Accommodation & Food Services | 339 (42.2%) | 465 (57.8%) |
| Public Administration | 191 (28.2%) | 486 (71.8%) |
| Total | 5,241 (53.7%) | 4,515 (46.3%) |
Education in Port Hueneme
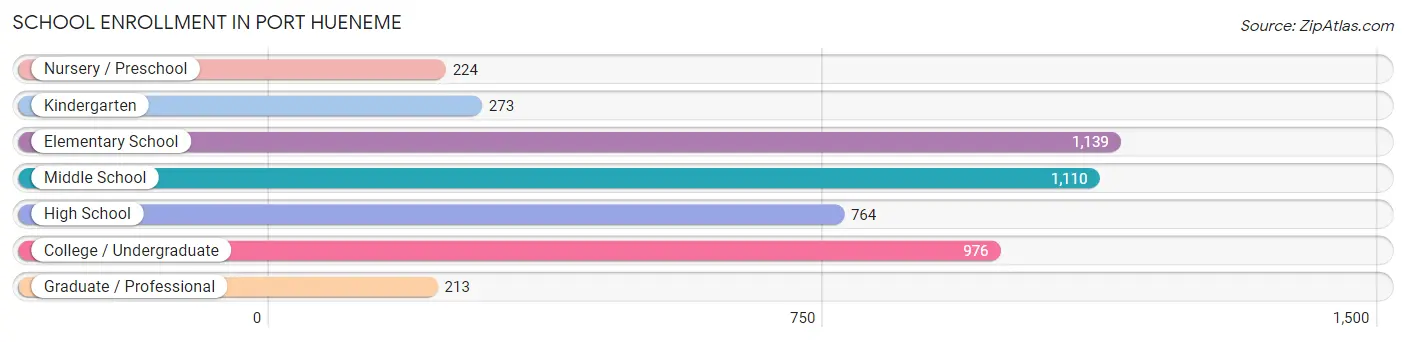
School Enrollment in Port Hueneme
The most common levels of schooling among the 4,699 students in Port Hueneme are elementary school (1,139 | 24.2%), middle school (1,110 | 23.6%), and college / undergraduate (976 | 20.8%).
| School Level | # Students | % Students |
| Nursery / Preschool | 224 | 4.8% |
| Kindergarten | 273 | 5.8% |
| Elementary School | 1,139 | 24.2% |
| Middle School | 1,110 | 23.6% |
| High School | 764 | 16.3% |
| College / Undergraduate | 976 | 20.8% |
| Graduate / Professional | 213 | 4.5% |
| Total | 4,699 | 100.0% |
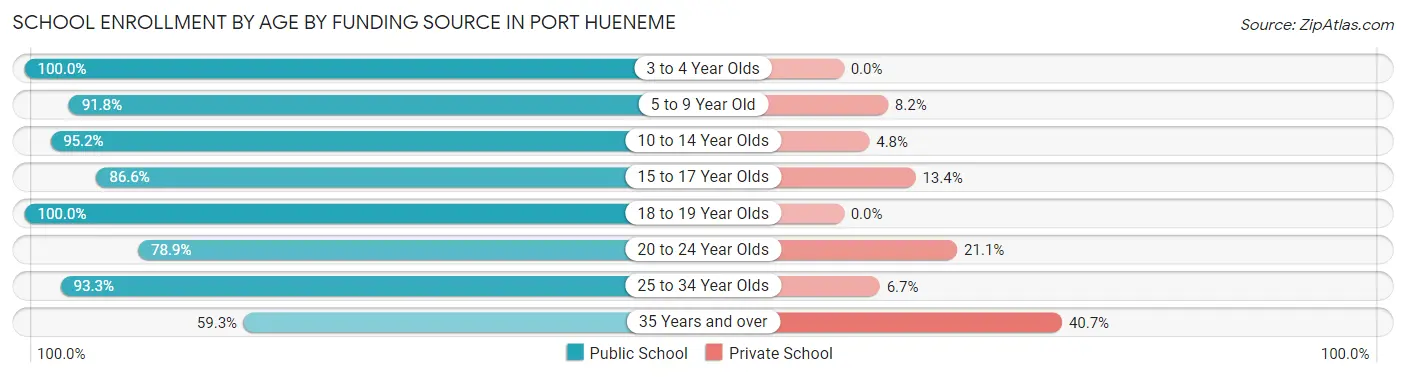
School Enrollment by Age by Funding Source in Port Hueneme
Out of a total of 4,699 students who are enrolled in schools in Port Hueneme, 465 (9.9%) attend a private institution, while the remaining 4,234 (90.1%) are enrolled in public schools. The age group of 35 years and over has the highest likelihood of being enrolled in private schools, with 124 (40.7% in the age bracket) enrolled. Conversely, the age group of 3 to 4 year olds has the lowest likelihood of being enrolled in a private school, with 199 (100.0% in the age bracket) attending a public institution.
| Age Bracket | Public School | Private School |
| 3 to 4 Year Olds | 199 (100.0%) | 0 (0.0%) |
| 5 to 9 Year Old | 1,248 (91.8%) | 112 (8.2%) |
| 10 to 14 Year Olds | 1,297 (95.2%) | 65 (4.8%) |
| 15 to 17 Year Olds | 453 (86.6%) | 70 (13.4%) |
| 18 to 19 Year Olds | 191 (100.0%) | 0 (0.0%) |
| 20 to 24 Year Olds | 235 (78.9%) | 63 (21.1%) |
| 25 to 34 Year Olds | 430 (93.3%) | 31 (6.7%) |
| 35 Years and over | 181 (59.3%) | 124 (40.7%) |
| Total | 4,234 (90.1%) | 465 (9.9%) |
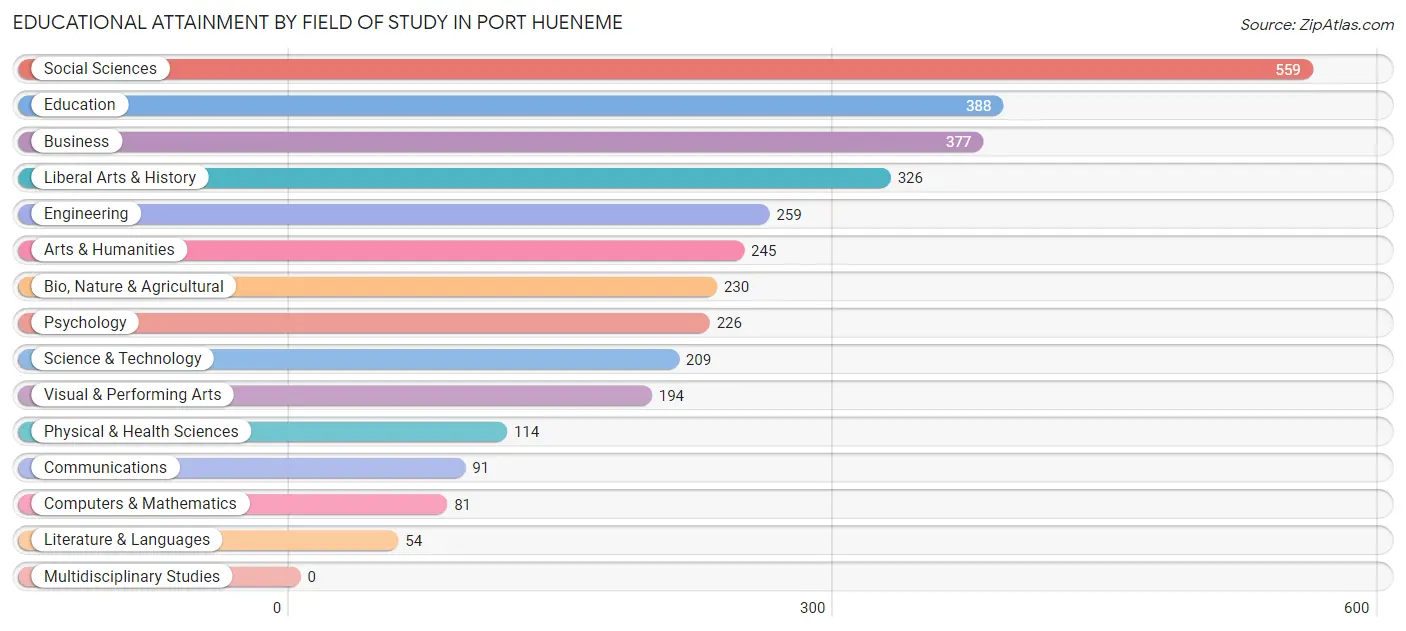
Educational Attainment by Field of Study in Port Hueneme
Social sciences (559 | 16.7%), education (388 | 11.6%), business (377 | 11.2%), liberal arts & history (326 | 9.7%), and engineering (259 | 7.7%) are the most common fields of study among 3,353 individuals in Port Hueneme who have obtained a bachelor's degree or higher.
| Field of Study | # Graduates | % Graduates |
| Computers & Mathematics | 81 | 2.4% |
| Bio, Nature & Agricultural | 230 | 6.9% |
| Physical & Health Sciences | 114 | 3.4% |
| Psychology | 226 | 6.7% |
| Social Sciences | 559 | 16.7% |
| Engineering | 259 | 7.7% |
| Multidisciplinary Studies | 0 | 0.0% |
| Science & Technology | 209 | 6.2% |
| Business | 377 | 11.2% |
| Education | 388 | 11.6% |
| Literature & Languages | 54 | 1.6% |
| Liberal Arts & History | 326 | 9.7% |
| Visual & Performing Arts | 194 | 5.8% |
| Communications | 91 | 2.7% |
| Arts & Humanities | 245 | 7.3% |
| Total | 3,353 | 100.0% |
Transportation & Commute in Port Hueneme
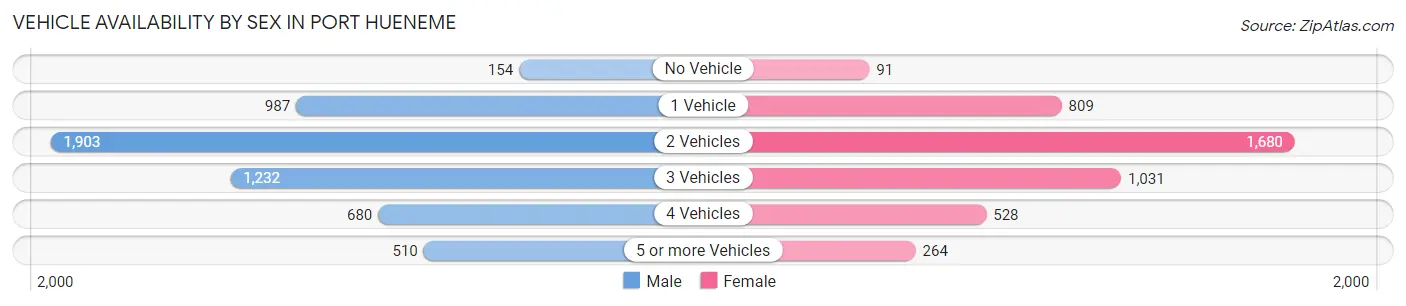
Vehicle Availability by Sex in Port Hueneme
The most prevalent vehicle ownership categories in Port Hueneme are males with 2 vehicles (1,903, accounting for 34.8%) and females with 2 vehicles (1,680, making up 43.2%).
| Vehicles Available | Male | Female |
| No Vehicle | 154 (2.8%) | 91 (2.1%) |
| 1 Vehicle | 987 (18.1%) | 809 (18.4%) |
| 2 Vehicles | 1,903 (34.8%) | 1,680 (38.2%) |
| 3 Vehicles | 1,232 (22.5%) | 1,031 (23.4%) |
| 4 Vehicles | 680 (12.4%) | 528 (12.0%) |
| 5 or more Vehicles | 510 (9.3%) | 264 (6.0%) |
| Total | 5,466 (100.0%) | 4,403 (100.0%) |
Commute Time in Port Hueneme
The most frequently occuring commute durations in Port Hueneme are 25 to 29 minutes (3,194 commuters, 32.4%), 20 to 24 minutes (1,246 commuters, 12.7%), and 15 to 19 minutes (1,214 commuters, 12.3%).
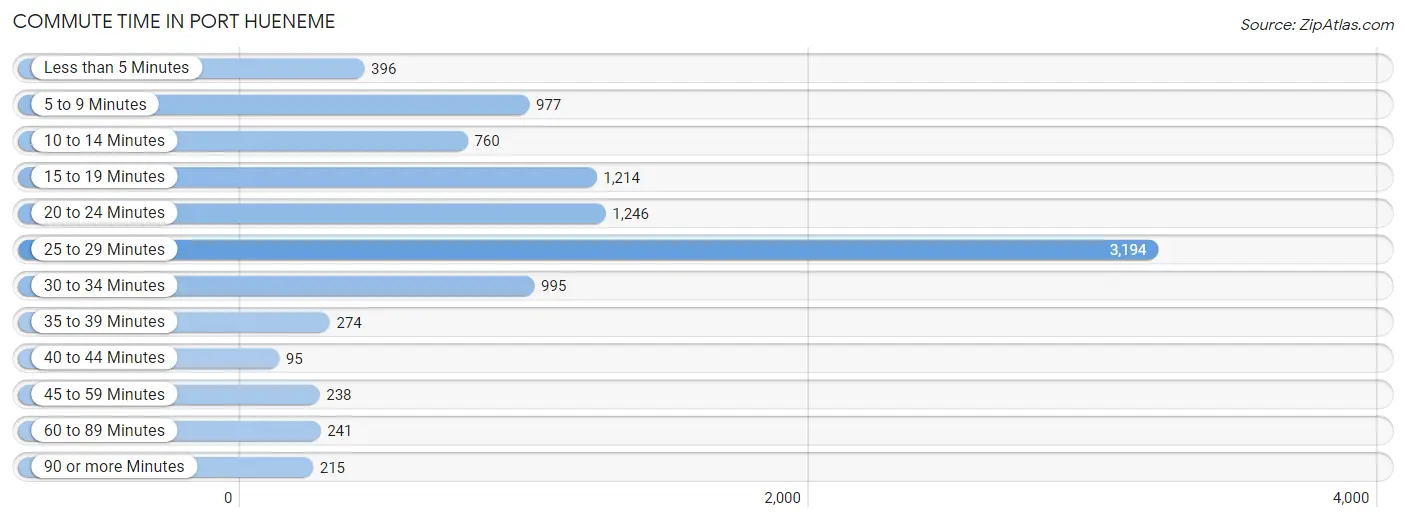
| Commute Time | # Commuters | % Commuters |
| Less than 5 Minutes | 396 | 4.0% |
| 5 to 9 Minutes | 977 | 9.9% |
| 10 to 14 Minutes | 760 | 7.7% |
| 15 to 19 Minutes | 1,214 | 12.3% |
| 20 to 24 Minutes | 1,246 | 12.7% |
| 25 to 29 Minutes | 3,194 | 32.4% |
| 30 to 34 Minutes | 995 | 10.1% |
| 35 to 39 Minutes | 274 | 2.8% |
| 40 to 44 Minutes | 95 | 1.0% |
| 45 to 59 Minutes | 238 | 2.4% |
| 60 to 89 Minutes | 241 | 2.5% |
| 90 or more Minutes | 215 | 2.2% |
Commute Time by Sex in Port Hueneme
The most common commute times in Port Hueneme are 25 to 29 minutes (1,907 commuters, 32.5%) for males and 25 to 29 minutes (1,287 commuters, 32.4%) for females.
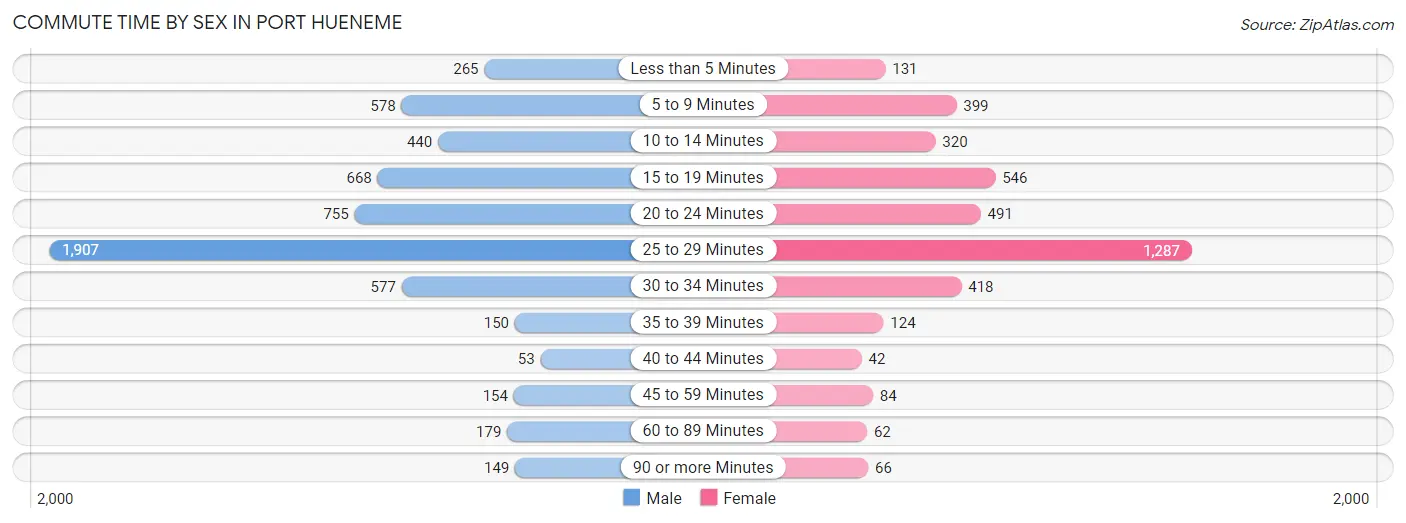
| Commute Time | Male | Female |
| Less than 5 Minutes | 265 (4.5%) | 131 (3.3%) |
| 5 to 9 Minutes | 578 (9.8%) | 399 (10.1%) |
| 10 to 14 Minutes | 440 (7.5%) | 320 (8.1%) |
| 15 to 19 Minutes | 668 (11.4%) | 546 (13.8%) |
| 20 to 24 Minutes | 755 (12.9%) | 491 (12.4%) |
| 25 to 29 Minutes | 1,907 (32.5%) | 1,287 (32.4%) |
| 30 to 34 Minutes | 577 (9.8%) | 418 (10.5%) |
| 35 to 39 Minutes | 150 (2.5%) | 124 (3.1%) |
| 40 to 44 Minutes | 53 (0.9%) | 42 (1.1%) |
| 45 to 59 Minutes | 154 (2.6%) | 84 (2.1%) |
| 60 to 89 Minutes | 179 (3.0%) | 62 (1.6%) |
| 90 or more Minutes | 149 (2.5%) | 66 (1.7%) |
Time of Departure to Work by Sex in Port Hueneme
The most frequent times of departure to work in Port Hueneme are 6:30 AM to 6:59 AM (888, 15.1%) for males and 7:30 AM to 7:59 AM (801, 20.2%) for females.
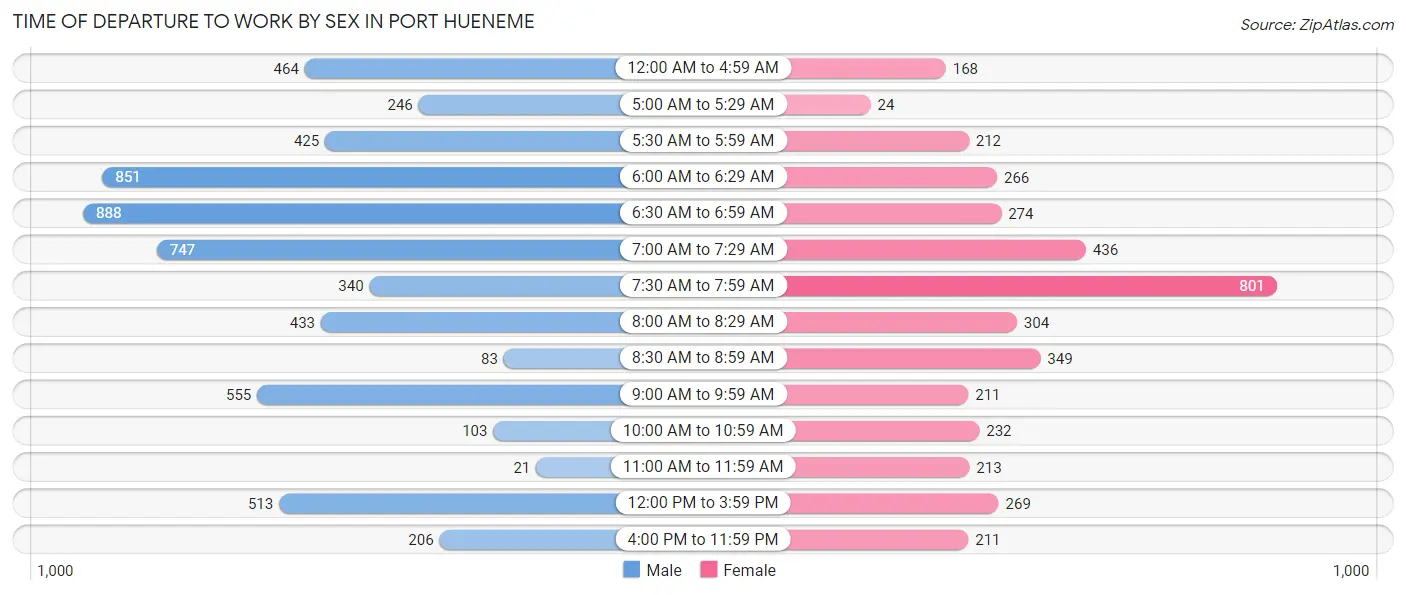
| Time of Departure | Male | Female |
| 12:00 AM to 4:59 AM | 464 (7.9%) | 168 (4.2%) |
| 5:00 AM to 5:29 AM | 246 (4.2%) | 24 (0.6%) |
| 5:30 AM to 5:59 AM | 425 (7.2%) | 212 (5.3%) |
| 6:00 AM to 6:29 AM | 851 (14.5%) | 266 (6.7%) |
| 6:30 AM to 6:59 AM | 888 (15.1%) | 274 (6.9%) |
| 7:00 AM to 7:29 AM | 747 (12.7%) | 436 (11.0%) |
| 7:30 AM to 7:59 AM | 340 (5.8%) | 801 (20.2%) |
| 8:00 AM to 8:29 AM | 433 (7.4%) | 304 (7.7%) |
| 8:30 AM to 8:59 AM | 83 (1.4%) | 349 (8.8%) |
| 9:00 AM to 9:59 AM | 555 (9.5%) | 211 (5.3%) |
| 10:00 AM to 10:59 AM | 103 (1.8%) | 232 (5.8%) |
| 11:00 AM to 11:59 AM | 21 (0.4%) | 213 (5.4%) |
| 12:00 PM to 3:59 PM | 513 (8.7%) | 269 (6.8%) |
| 4:00 PM to 11:59 PM | 206 (3.5%) | 211 (5.3%) |
| Total | 5,875 (100.0%) | 3,970 (100.0%) |
Housing Occupancy in Port Hueneme
Occupancy by Ownership in Port Hueneme
Of the total 6,984 dwellings in Port Hueneme, owner-occupied units account for 3,284 (47.0%), while renter-occupied units make up 3,700 (53.0%).
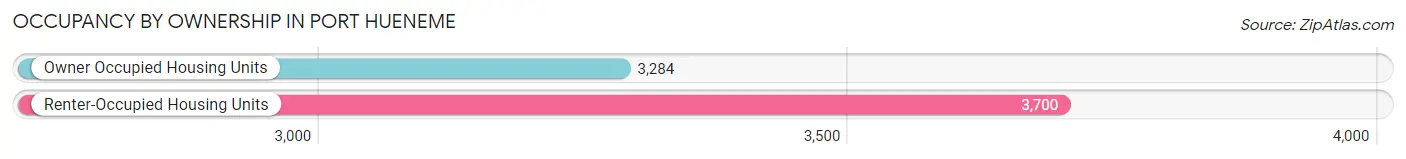
| Occupancy | # Housing Units | % Housing Units |
| Owner Occupied Housing Units | 3,284 | 47.0% |
| Renter-Occupied Housing Units | 3,700 | 53.0% |
| Total Occupied Housing Units | 6,984 | 100.0% |
Occupancy by Household Size in Port Hueneme
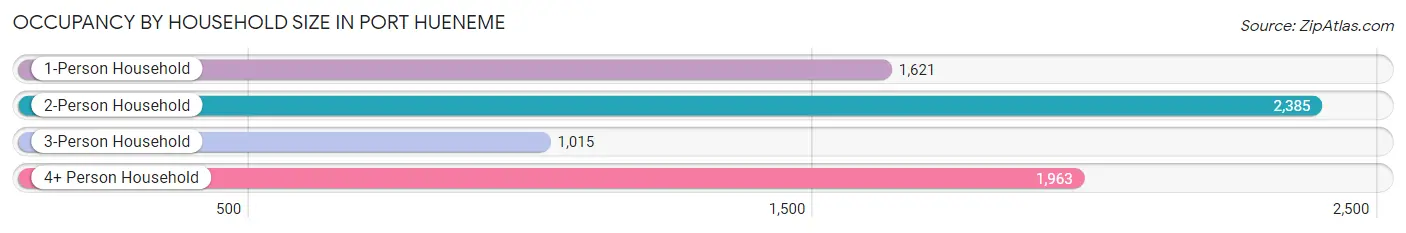
| Household Size | # Housing Units | % Housing Units |
| 1-Person Household | 1,621 | 23.2% |
| 2-Person Household | 2,385 | 34.2% |
| 3-Person Household | 1,015 | 14.5% |
| 4+ Person Household | 1,963 | 28.1% |
| Total Housing Units | 6,984 | 100.0% |
Occupancy by Ownership by Household Size in Port Hueneme
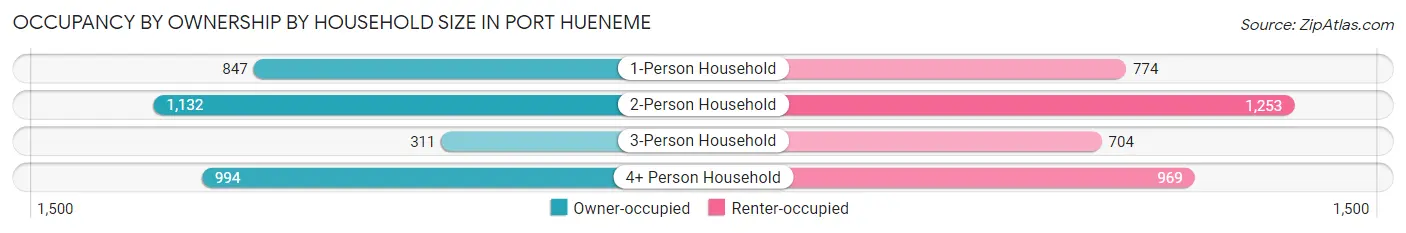
| Household Size | Owner-occupied | Renter-occupied |
| 1-Person Household | 847 (52.2%) | 774 (47.7%) |
| 2-Person Household | 1,132 (47.5%) | 1,253 (52.5%) |
| 3-Person Household | 311 (30.6%) | 704 (69.4%) |
| 4+ Person Household | 994 (50.6%) | 969 (49.4%) |
| Total Housing Units | 3,284 (47.0%) | 3,700 (53.0%) |
Occupancy by Educational Attainment in Port Hueneme
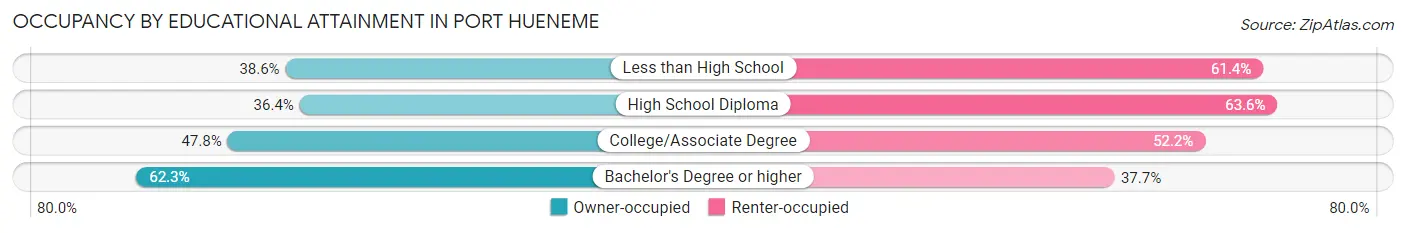
| Household Size | Owner-occupied | Renter-occupied |
| Less than High School | 549 (38.6%) | 872 (61.4%) |
| High School Diploma | 563 (36.4%) | 985 (63.6%) |
| College/Associate Degree | 1,087 (47.8%) | 1,186 (52.2%) |
| Bachelor's Degree or higher | 1,085 (62.3%) | 657 (37.7%) |
Occupancy by Age of Householder in Port Hueneme
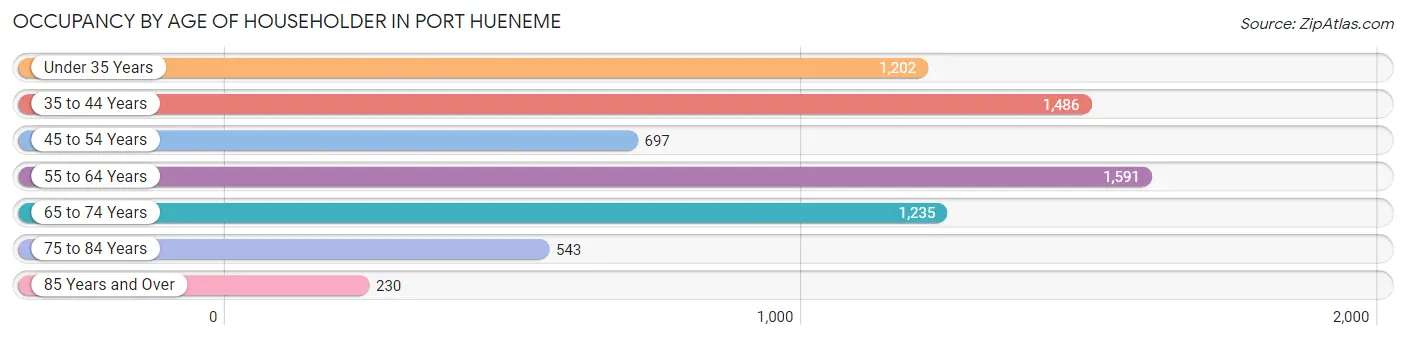
| Age Bracket | # Households | % Households |
| Under 35 Years | 1,202 | 17.2% |
| 35 to 44 Years | 1,486 | 21.3% |
| 45 to 54 Years | 697 | 10.0% |
| 55 to 64 Years | 1,591 | 22.8% |
| 65 to 74 Years | 1,235 | 17.7% |
| 75 to 84 Years | 543 | 7.8% |
| 85 Years and Over | 230 | 3.3% |
| Total | 6,984 | 100.0% |
Housing Finances in Port Hueneme
Median Income by Occupancy in Port Hueneme
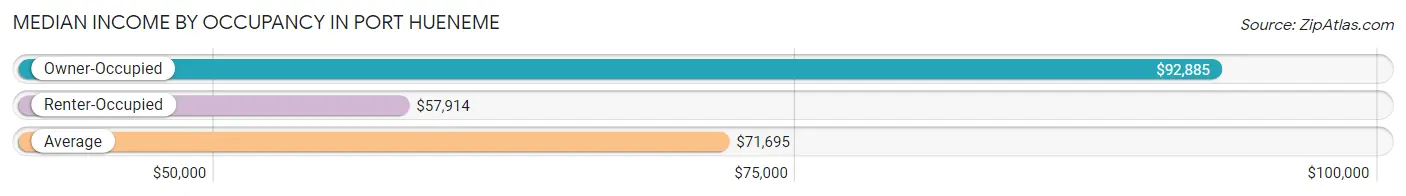
| Occupancy Type | # Households | Median Income |
| Owner-Occupied | 3,284 (47.0%) | $92,885 |
| Renter-Occupied | 3,700 (53.0%) | $57,914 |
| Average | 6,984 (100.0%) | $71,695 |
Occupancy by Householder Income Bracket in Port Hueneme
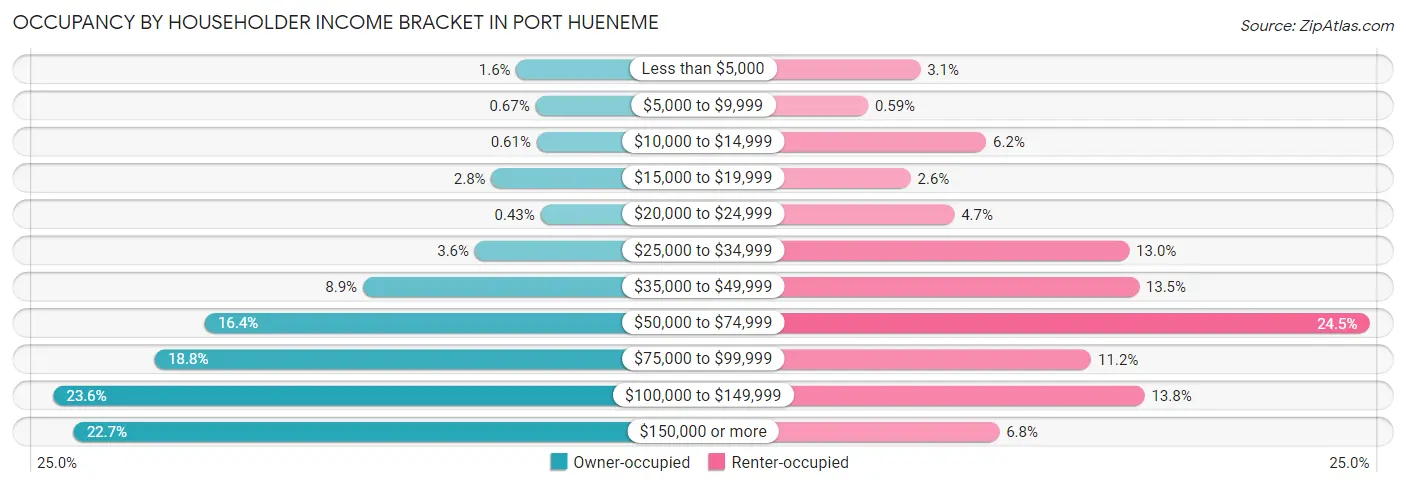
| Income Bracket | Owner-occupied | Renter-occupied |
| Less than $5,000 | 52 (1.6%) | 114 (3.1%) |
| $5,000 to $9,999 | 22 (0.7%) | 22 (0.6%) |
| $10,000 to $14,999 | 20 (0.6%) | 230 (6.2%) |
| $15,000 to $19,999 | 91 (2.8%) | 97 (2.6%) |
| $20,000 to $24,999 | 14 (0.4%) | 174 (4.7%) |
| $25,000 to $34,999 | 117 (3.6%) | 482 (13.0%) |
| $35,000 to $49,999 | 292 (8.9%) | 499 (13.5%) |
| $50,000 to $74,999 | 539 (16.4%) | 905 (24.5%) |
| $75,000 to $99,999 | 617 (18.8%) | 415 (11.2%) |
| $100,000 to $149,999 | 776 (23.6%) | 509 (13.8%) |
| $150,000 or more | 744 (22.7%) | 253 (6.8%) |
| Total | 3,284 (100.0%) | 3,700 (100.0%) |
Monthly Housing Cost Tiers in Port Hueneme
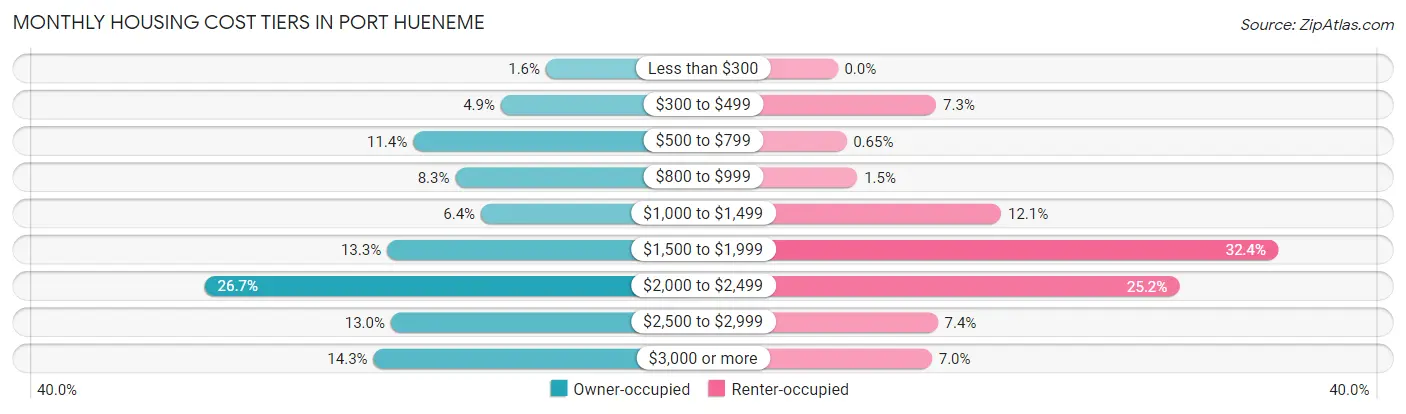
| Monthly Cost | Owner-occupied | Renter-occupied |
| Less than $300 | 53 (1.6%) | 0 (0.0%) |
| $300 to $499 | 162 (4.9%) | 269 (7.3%) |
| $500 to $799 | 374 (11.4%) | 24 (0.6%) |
| $800 to $999 | 272 (8.3%) | 54 (1.5%) |
| $1,000 to $1,499 | 210 (6.4%) | 446 (12.0%) |
| $1,500 to $1,999 | 437 (13.3%) | 1,200 (32.4%) |
| $2,000 to $2,499 | 878 (26.7%) | 931 (25.2%) |
| $2,500 to $2,999 | 428 (13.0%) | 273 (7.4%) |
| $3,000 or more | 470 (14.3%) | 257 (7.0%) |
| Total | 3,284 (100.0%) | 3,700 (100.0%) |
Physical Housing Characteristics in Port Hueneme
Housing Structures in Port Hueneme
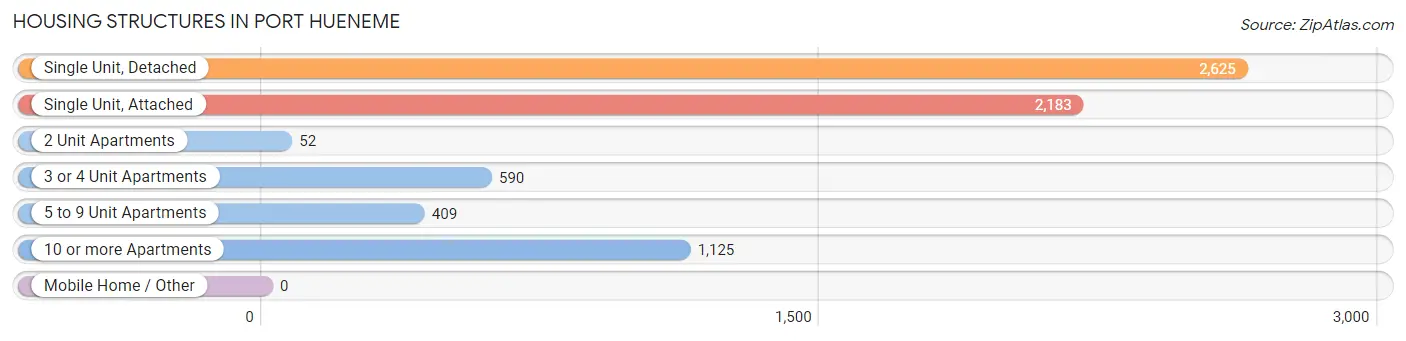
| Structure Type | # Housing Units | % Housing Units |
| Single Unit, Detached | 2,625 | 37.6% |
| Single Unit, Attached | 2,183 | 31.3% |
| 2 Unit Apartments | 52 | 0.7% |
| 3 or 4 Unit Apartments | 590 | 8.5% |
| 5 to 9 Unit Apartments | 409 | 5.9% |
| 10 or more Apartments | 1,125 | 16.1% |
| Mobile Home / Other | 0 | 0.0% |
| Total | 6,984 | 100.0% |
Housing Structures by Occupancy in Port Hueneme
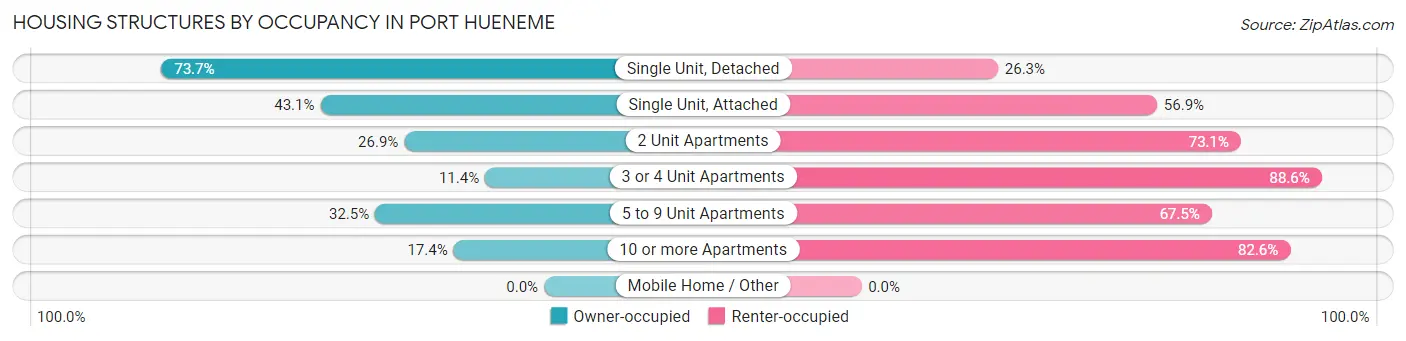
| Structure Type | Owner-occupied | Renter-occupied |
| Single Unit, Detached | 1,934 (73.7%) | 691 (26.3%) |
| Single Unit, Attached | 940 (43.1%) | 1,243 (56.9%) |
| 2 Unit Apartments | 14 (26.9%) | 38 (73.1%) |
| 3 or 4 Unit Apartments | 67 (11.4%) | 523 (88.6%) |
| 5 to 9 Unit Apartments | 133 (32.5%) | 276 (67.5%) |
| 10 or more Apartments | 196 (17.4%) | 929 (82.6%) |
| Mobile Home / Other | 0 (0.0%) | 0 (0.0%) |
| Total | 3,284 (47.0%) | 3,700 (53.0%) |
Housing Structures by Number of Rooms in Port Hueneme
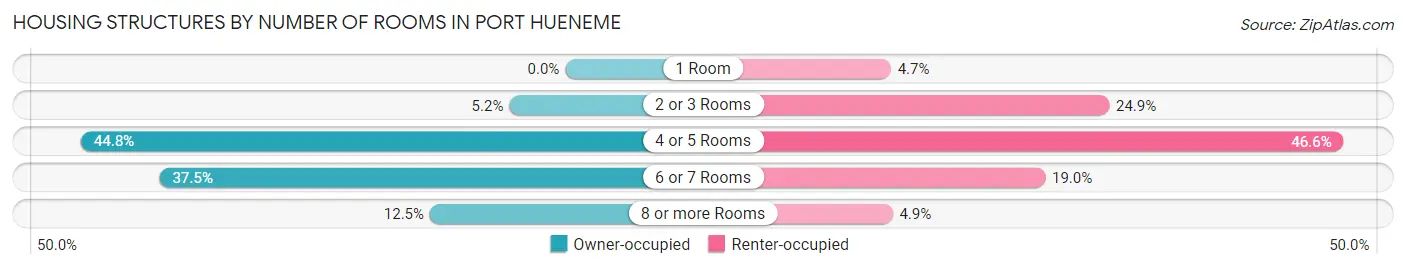
| Number of Rooms | Owner-occupied | Renter-occupied |
| 1 Room | 0 (0.0%) | 174 (4.7%) |
| 2 or 3 Rooms | 170 (5.2%) | 921 (24.9%) |
| 4 or 5 Rooms | 1,471 (44.8%) | 1,723 (46.6%) |
| 6 or 7 Rooms | 1,232 (37.5%) | 702 (19.0%) |
| 8 or more Rooms | 411 (12.5%) | 180 (4.9%) |
| Total | 3,284 (100.0%) | 3,700 (100.0%) |
Housing Structure by Heating Type in Port Hueneme
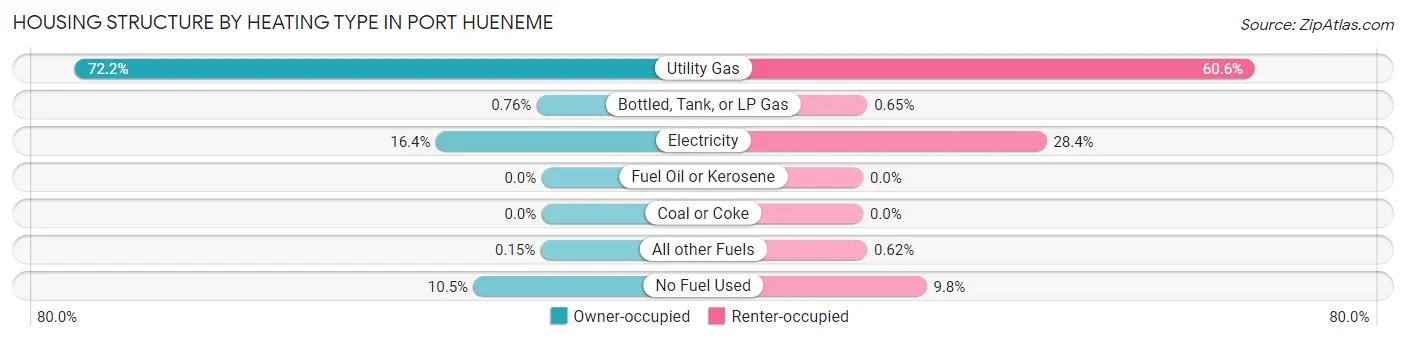
| Heating Type | Owner-occupied | Renter-occupied |
| Utility Gas | 2,371 (72.2%) | 2,241 (60.6%) |
| Bottled, Tank, or LP Gas | 25 (0.8%) | 24 (0.6%) |
| Electricity | 537 (16.4%) | 1,049 (28.3%) |
| Fuel Oil or Kerosene | 0 (0.0%) | 0 (0.0%) |
| Coal or Coke | 0 (0.0%) | 0 (0.0%) |
| All other Fuels | 5 (0.2%) | 23 (0.6%) |
| No Fuel Used | 346 (10.5%) | 363 (9.8%) |
| Total | 3,284 (100.0%) | 3,700 (100.0%) |
Household Vehicle Usage in Port Hueneme
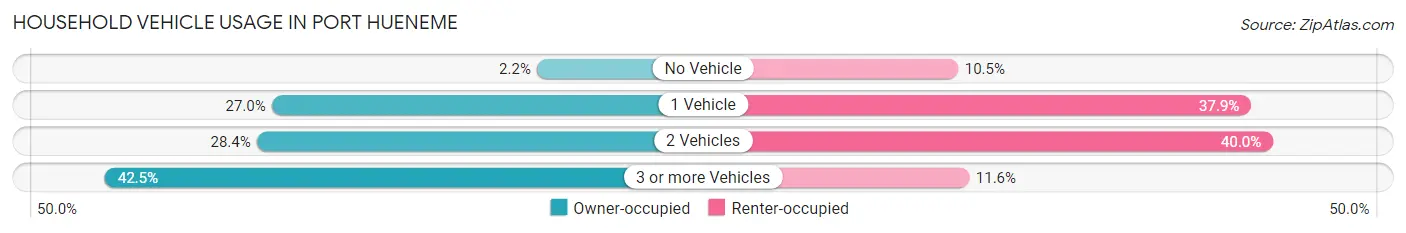
| Vehicles per Household | Owner-occupied | Renter-occupied |
| No Vehicle | 72 (2.2%) | 390 (10.5%) |
| 1 Vehicle | 885 (27.0%) | 1,403 (37.9%) |
| 2 Vehicles | 931 (28.3%) | 1,479 (40.0%) |
| 3 or more Vehicles | 1,396 (42.5%) | 428 (11.6%) |
| Total | 3,284 (100.0%) | 3,700 (100.0%) |
Real Estate & Mortgages in Port Hueneme
Real Estate and Mortgage Overview in Port Hueneme
| Characteristic | Without Mortgage | With Mortgage |
| Housing Units | 951 | 2,333 |
| Median Property Value | $455,500 | $529,700 |
| Median Household Income | $68,219 | $570 |
| Monthly Housing Costs | $681 | $461 |
| Real Estate Taxes | $2,770 | $43 |
Property Value by Mortgage Status in Port Hueneme
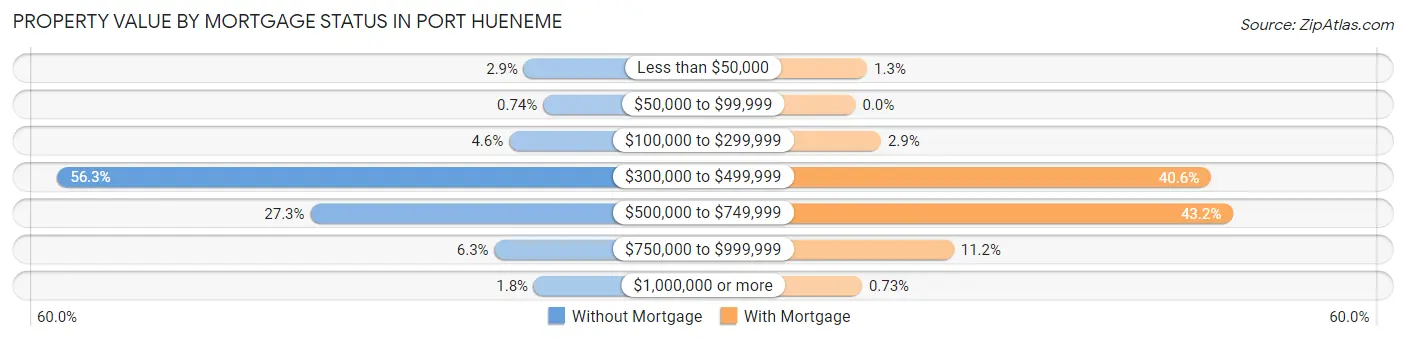
| Property Value | Without Mortgage | With Mortgage |
| Less than $50,000 | 28 (2.9%) | 31 (1.3%) |
| $50,000 to $99,999 | 7 (0.7%) | 0 (0.0%) |
| $100,000 to $299,999 | 44 (4.6%) | 68 (2.9%) |
| $300,000 to $499,999 | 535 (56.3%) | 948 (40.6%) |
| $500,000 to $749,999 | 260 (27.3%) | 1,007 (43.2%) |
| $750,000 to $999,999 | 60 (6.3%) | 262 (11.2%) |
| $1,000,000 or more | 17 (1.8%) | 17 (0.7%) |
| Total | 951 (100.0%) | 2,333 (100.0%) |
Household Income by Mortgage Status in Port Hueneme
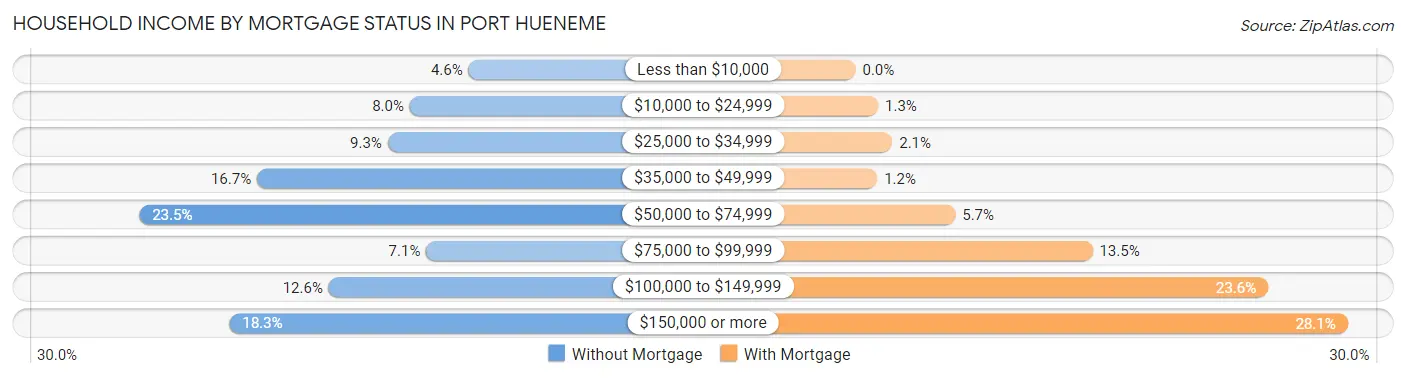
| Household Income | Without Mortgage | With Mortgage |
| Less than $10,000 | 44 (4.6%) | 0 (0.0%) |
| $10,000 to $24,999 | 76 (8.0%) | 30 (1.3%) |
| $25,000 to $34,999 | 88 (9.2%) | 49 (2.1%) |
| $35,000 to $49,999 | 159 (16.7%) | 29 (1.2%) |
| $50,000 to $74,999 | 223 (23.4%) | 133 (5.7%) |
| $75,000 to $99,999 | 67 (7.0%) | 316 (13.5%) |
| $100,000 to $149,999 | 120 (12.6%) | 550 (23.6%) |
| $150,000 or more | 174 (18.3%) | 656 (28.1%) |
| Total | 951 (100.0%) | 2,333 (100.0%) |
Property Value to Household Income Ratio in Port Hueneme
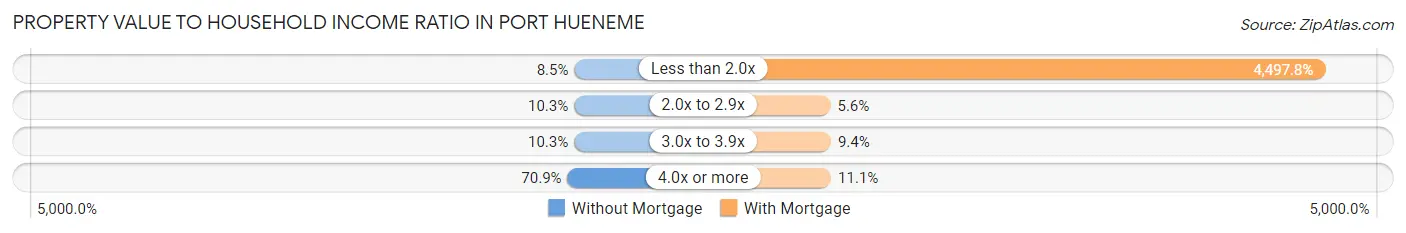
| Value-to-Income Ratio | Without Mortgage | With Mortgage |
| Less than 2.0x | 81 (8.5%) | 104,934 (4,497.8%) |
| 2.0x to 2.9x | 98 (10.3%) | 131 (5.6%) |
| 3.0x to 3.9x | 98 (10.3%) | 220 (9.4%) |
| 4.0x or more | 674 (70.9%) | 260 (11.1%) |
| Total | 951 (100.0%) | 2,333 (100.0%) |
Real Estate Taxes by Mortgage Status in Port Hueneme
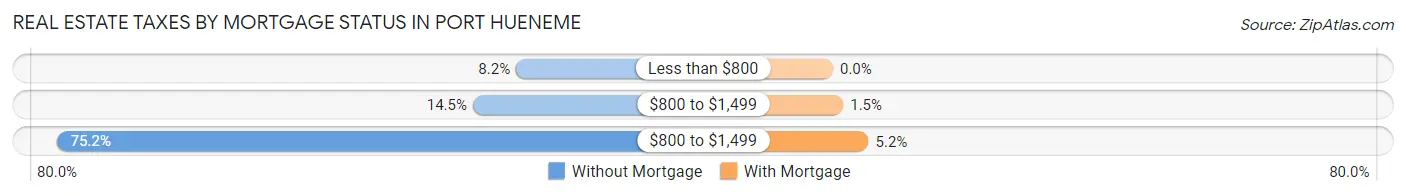
| Property Taxes | Without Mortgage | With Mortgage |
| Less than $800 | 78 (8.2%) | 0 (0.0%) |
| $800 to $1,499 | 138 (14.5%) | 35 (1.5%) |
| $800 to $1,499 | 715 (75.2%) | 121 (5.2%) |
| Total | 951 (100.0%) | 2,333 (100.0%) |
Health & Disability in Port Hueneme
Health Insurance Coverage by Age in Port Hueneme
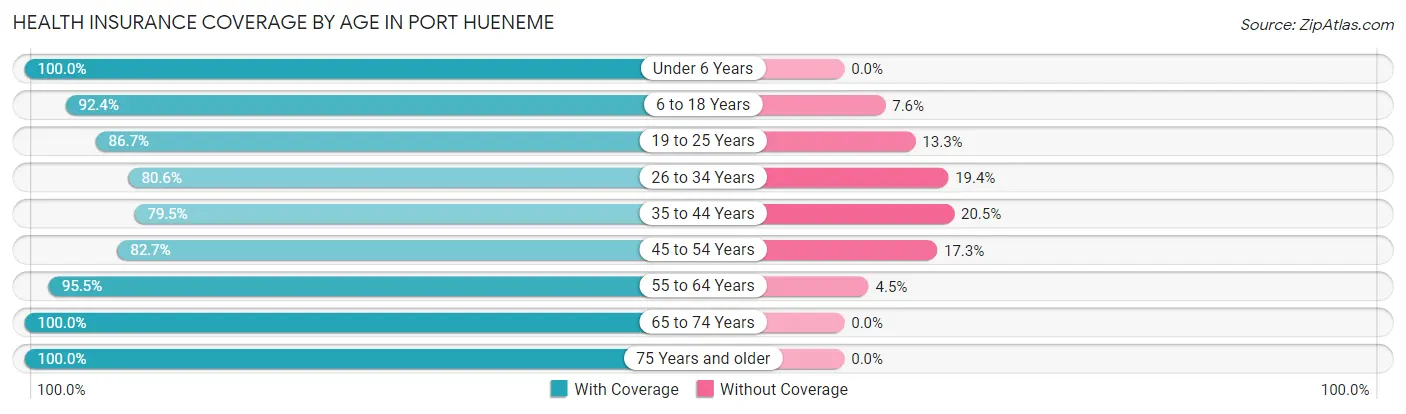
| Age Bracket | With Coverage | Without Coverage |
| Under 6 Years | 1,869 (100.0%) | 0 (0.0%) |
| 6 to 18 Years | 2,913 (92.4%) | 241 (7.6%) |
| 19 to 25 Years | 1,551 (86.7%) | 237 (13.3%) |
| 26 to 34 Years | 2,505 (80.6%) | 602 (19.4%) |
| 35 to 44 Years | 2,592 (79.5%) | 667 (20.5%) |
| 45 to 54 Years | 1,487 (82.7%) | 311 (17.3%) |
| 55 to 64 Years | 2,509 (95.5%) | 119 (4.5%) |
| 65 to 74 Years | 1,707 (100.0%) | 0 (0.0%) |
| 75 Years and older | 1,310 (100.0%) | 0 (0.0%) |
| Total | 18,443 (89.4%) | 2,177 (10.6%) |
Health Insurance Coverage by Citizenship Status in Port Hueneme
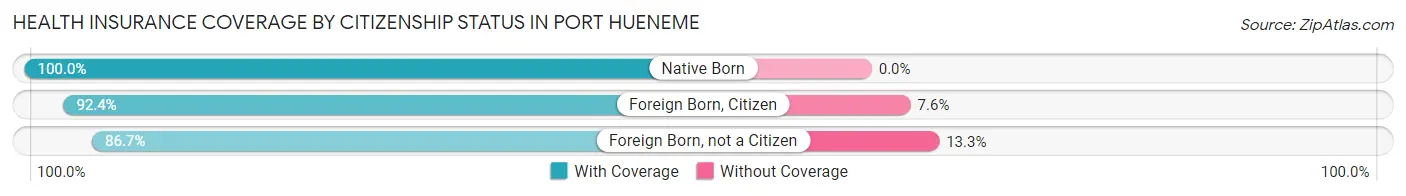
| Citizenship Status | With Coverage | Without Coverage |
| Native Born | 1,869 (100.0%) | 0 (0.0%) |
| Foreign Born, Citizen | 2,913 (92.4%) | 241 (7.6%) |
| Foreign Born, not a Citizen | 1,551 (86.7%) | 237 (13.3%) |
Health Insurance Coverage by Household Income in Port Hueneme
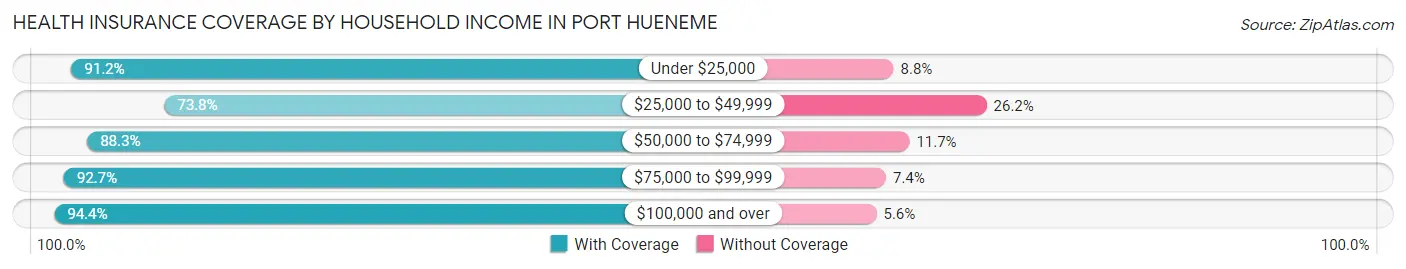
| Household Income | With Coverage | Without Coverage |
| Under $25,000 | 1,695 (91.2%) | 163 (8.8%) |
| $25,000 to $49,999 | 2,432 (73.8%) | 863 (26.2%) |
| $50,000 to $74,999 | 3,264 (88.3%) | 434 (11.7%) |
| $75,000 to $99,999 | 3,317 (92.6%) | 263 (7.3%) |
| $100,000 and over | 7,641 (94.4%) | 451 (5.6%) |
Public vs Private Health Insurance Coverage by Age in Port Hueneme
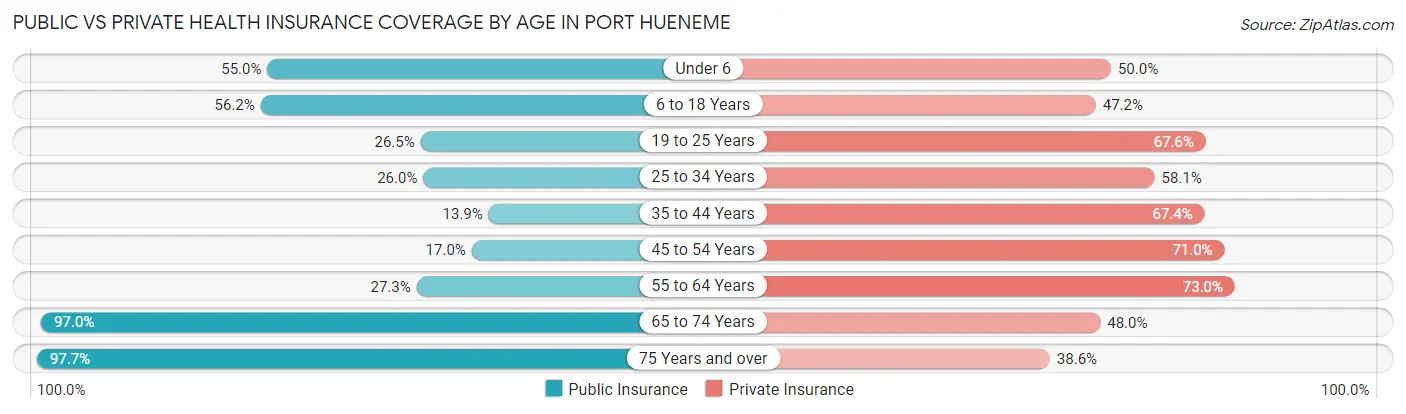
| Age Bracket | Public Insurance | Private Insurance |
| Under 6 | 1,027 (54.9%) | 934 (50.0%) |
| 6 to 18 Years | 1,773 (56.2%) | 1,487 (47.1%) |
| 19 to 25 Years | 474 (26.5%) | 1,208 (67.6%) |
| 25 to 34 Years | 808 (26.0%) | 1,804 (58.1%) |
| 35 to 44 Years | 452 (13.9%) | 2,195 (67.3%) |
| 45 to 54 Years | 306 (17.0%) | 1,277 (71.0%) |
| 55 to 64 Years | 716 (27.3%) | 1,917 (73.0%) |
| 65 to 74 Years | 1,655 (97.0%) | 819 (48.0%) |
| 75 Years and over | 1,280 (97.7%) | 506 (38.6%) |
| Total | 8,491 (41.2%) | 12,147 (58.9%) |
Disability Status by Sex by Age in Port Hueneme
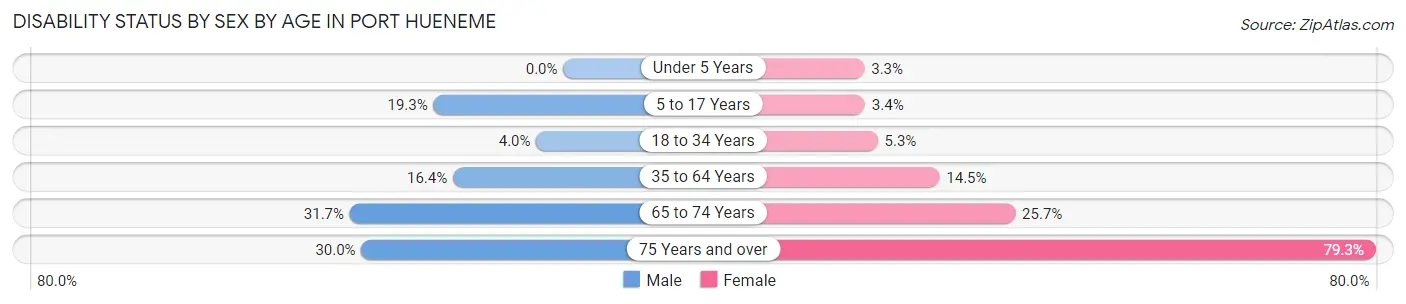
| Age Bracket | Male | Female |
| Under 5 Years | 0 (0.0%) | 30 (3.3%) |
| 5 to 17 Years | 325 (19.3%) | 59 (3.4%) |
| 18 to 34 Years | 107 (4.0%) | 122 (5.3%) |
| 35 to 64 Years | 608 (16.4%) | 576 (14.5%) |
| 65 to 74 Years | 285 (31.7%) | 208 (25.7%) |
| 75 Years and over | 128 (30.0%) | 700 (79.3%) |
Disability Class by Sex by Age in Port Hueneme
Disability Class: Hearing Difficulty
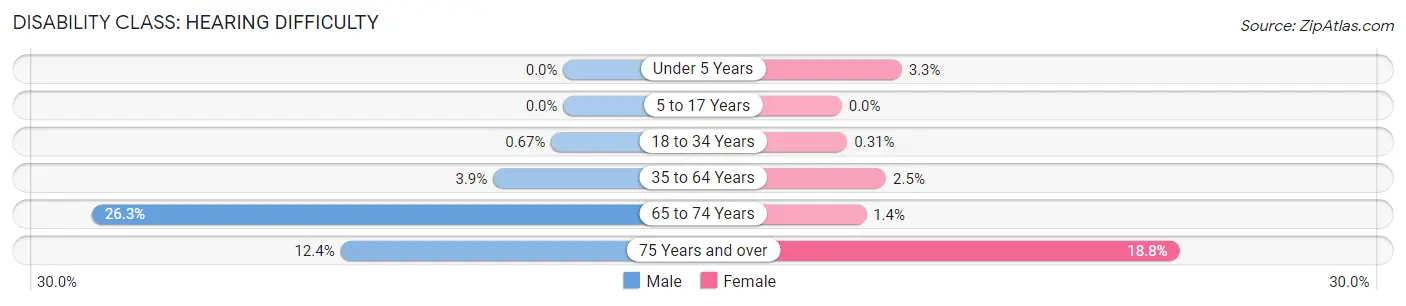
| Age Bracket | Male | Female |
| Under 5 Years | 0 (0.0%) | 30 (3.3%) |
| 5 to 17 Years | 0 (0.0%) | 0 (0.0%) |
| 18 to 34 Years | 18 (0.7%) | 7 (0.3%) |
| 35 to 64 Years | 145 (3.9%) | 98 (2.5%) |
| 65 to 74 Years | 236 (26.3%) | 11 (1.4%) |
| 75 Years and over | 53 (12.4%) | 166 (18.8%) |
Disability Class: Vision Difficulty
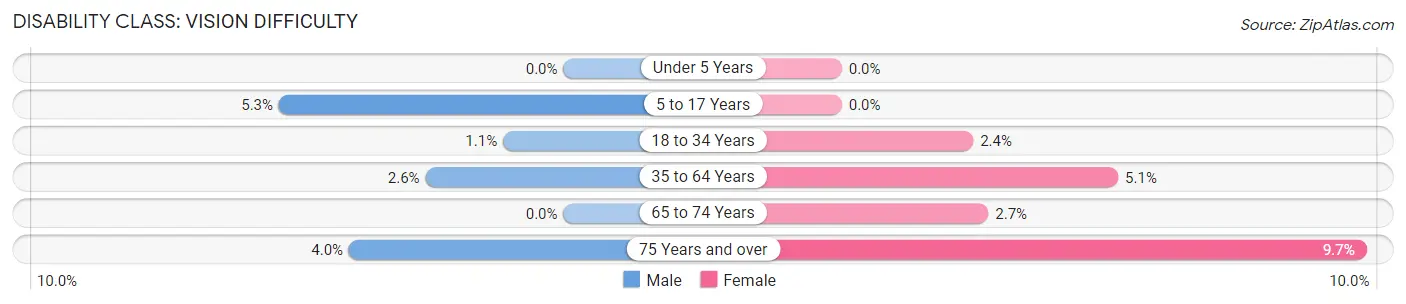
| Age Bracket | Male | Female |
| Under 5 Years | 0 (0.0%) | 0 (0.0%) |
| 5 to 17 Years | 89 (5.3%) | 0 (0.0%) |
| 18 to 34 Years | 30 (1.1%) | 56 (2.4%) |
| 35 to 64 Years | 95 (2.6%) | 204 (5.1%) |
| 65 to 74 Years | 0 (0.0%) | 22 (2.7%) |
| 75 Years and over | 17 (4.0%) | 86 (9.7%) |
Disability Class: Cognitive Difficulty
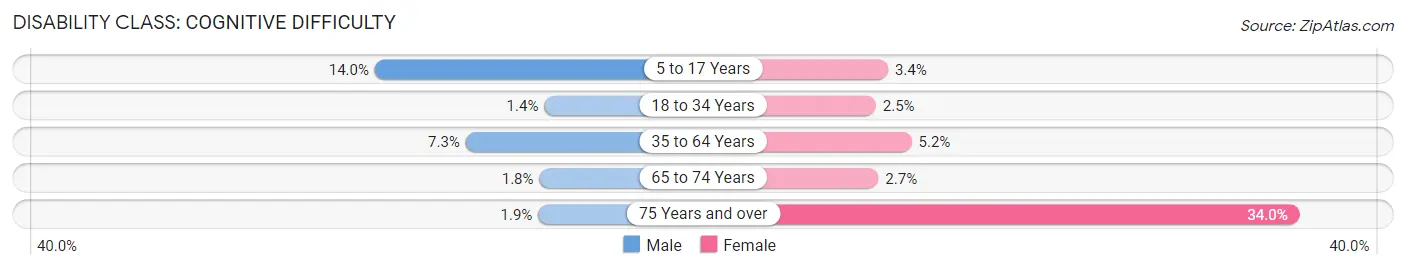
| Age Bracket | Male | Female |
| 5 to 17 Years | 236 (14.0%) | 59 (3.4%) |
| 18 to 34 Years | 38 (1.4%) | 58 (2.5%) |
| 35 to 64 Years | 269 (7.2%) | 206 (5.2%) |
| 65 to 74 Years | 16 (1.8%) | 22 (2.7%) |
| 75 Years and over | 8 (1.9%) | 300 (34.0%) |
Disability Class: Ambulatory Difficulty
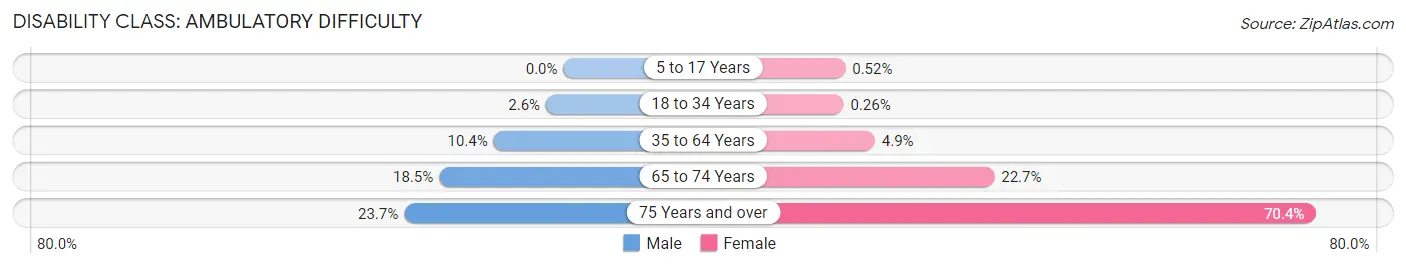
| Age Bracket | Male | Female |
| 5 to 17 Years | 0 (0.0%) | 9 (0.5%) |
| 18 to 34 Years | 69 (2.6%) | 6 (0.3%) |
| 35 to 64 Years | 385 (10.4%) | 195 (4.9%) |
| 65 to 74 Years | 166 (18.5%) | 183 (22.7%) |
| 75 Years and over | 101 (23.6%) | 622 (70.4%) |
Disability Class: Self-Care Difficulty
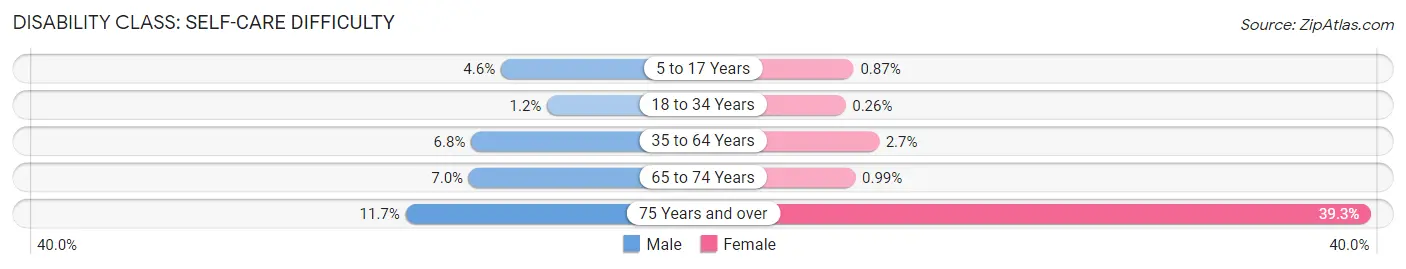
| Age Bracket | Male | Female |
| 5 to 17 Years | 78 (4.6%) | 15 (0.9%) |
| 18 to 34 Years | 32 (1.2%) | 6 (0.3%) |
| 35 to 64 Years | 254 (6.8%) | 109 (2.7%) |
| 65 to 74 Years | 63 (7.0%) | 8 (1.0%) |
| 75 Years and over | 50 (11.7%) | 347 (39.3%) |
Technology Access in Port Hueneme
Computing Device Access in Port Hueneme
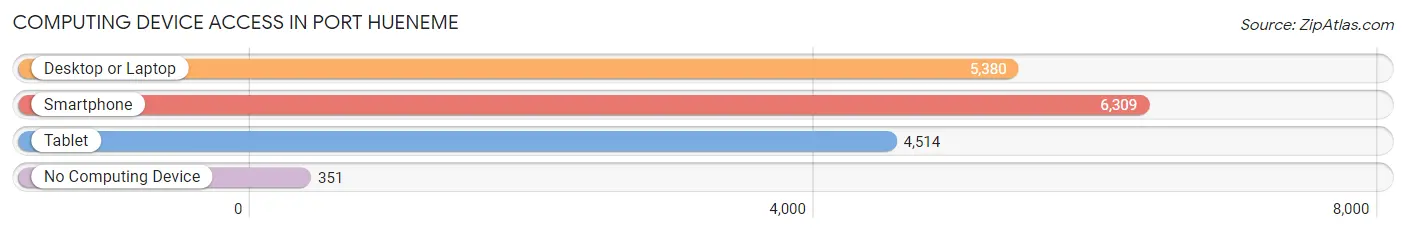
| Device Type | # Households | % Households |
| Desktop or Laptop | 5,380 | 77.0% |
| Smartphone | 6,309 | 90.3% |
| Tablet | 4,514 | 64.6% |
| No Computing Device | 351 | 5.0% |
| Total | 6,984 | 100.0% |
Internet Access in Port Hueneme
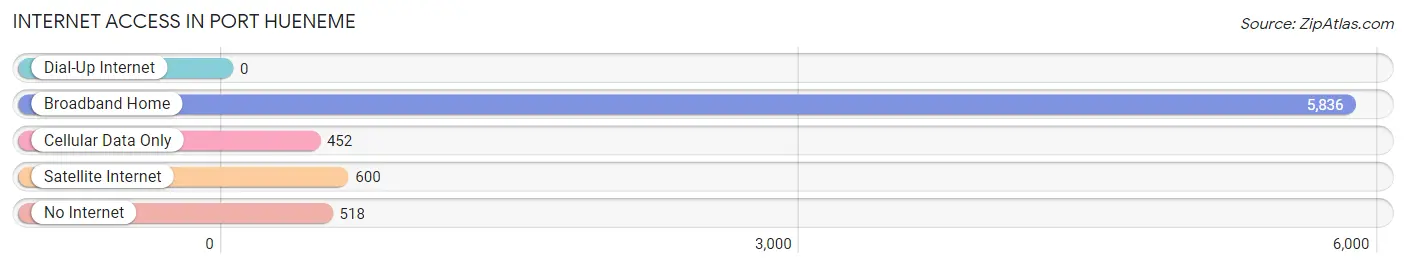
| Internet Type | # Households | % Households |
| Dial-Up Internet | 0 | 0.0% |
| Broadband Home | 5,836 | 83.6% |
| Cellular Data Only | 452 | 6.5% |
| Satellite Internet | 600 | 8.6% |
| No Internet | 518 | 7.4% |
| Total | 6,984 | 100.0% |
Port Hueneme Summary
History
Port Hueneme is a small city located in Ventura County, California. It is situated on the Pacific Coast, approximately halfway between Los Angeles and Santa Barbara. The city was founded in 1874 by Thomas R. Bard, a prominent landowner and entrepreneur. Bard named the city after the Chumash Indian village of Hueneme, which was located nearby.
The city was initially a small fishing village, but it soon grew into a major port. In the early 1900s, the port was used to ship agricultural products, such as oranges, lemons, and avocados, to the rest of the country. During World War II, the port was used to ship supplies to the Pacific Theater. After the war, the port was used to ship military equipment and supplies to the Korean War.
In the 1950s, the port was expanded to accommodate larger ships. This allowed the port to become a major hub for international trade. In the 1960s, the port was used to ship goods to Vietnam during the Vietnam War.
In the 1970s, the port was used to ship goods to the Middle East during the Arab-Israeli conflict. In the 1980s, the port was used to ship goods to Central America during the Contra War.
Today, the port is still a major hub for international trade. It is the only deep-water port between Los Angeles and San Francisco. The port is also home to a large naval base, which is used to train and deploy Navy personnel.
Geography
Port Hueneme is located on the Pacific Coast, approximately halfway between Los Angeles and Santa Barbara. The city is situated on a narrow strip of land between the Santa Clara River and the Pacific Ocean. The city is bordered by the cities of Oxnard and Ventura to the north, and the city of Port Hueneme to the south.
The city has a total area of 4.2 square miles, of which 0.2 square miles is water. The city is mostly flat, with an average elevation of 10 feet above sea level. The climate is mild, with temperatures ranging from the mid-50s to the mid-70s throughout the year.
Economy
Port Hueneme’s economy is largely based on the port and the naval base. The port is a major hub for international trade, and it is the only deep-water port between Los Angeles and San Francisco. The port is also home to a large naval base, which is used to train and deploy Navy personnel.
In addition to the port and naval base, the city is home to a variety of businesses. These include manufacturing, retail, and service industries. The city is also home to a number of restaurants, bars, and other entertainment venues.
Demographics
As of the 2010 census, the population of Port Hueneme was 21,723. The population is largely Hispanic, with a large percentage of Mexican-Americans. The median age is 33.7 years, and the median household income is $50,945.
The city is home to a variety of religious denominations, including Catholic, Protestant, and Jewish. The city is also home to a large number of military personnel, due to the presence of the naval base.
Conclusion
Port Hueneme is a small city located in Ventura County, California. It is situated on the Pacific Coast, approximately halfway between Los Angeles and Santa Barbara. The city was founded in 1874 by Thomas R. Bard, and it is home to a large naval base. The city’s economy is largely based on the port and the naval base, and it is also home to a variety of businesses. The population of Port Hueneme is largely Hispanic, with a large percentage of Mexican-Americans. The city is home to a variety of religious denominations, and it is also home to a large number of military personnel.
Common Questions
What is Per Capita Income in Port Hueneme?
Per Capita income in Port Hueneme is $30,857.
What is the Median Family Income in Port Hueneme?
Median Family Income in Port Hueneme is $83,007.
What is the Median Household income in Port Hueneme?
Median Household Income in Port Hueneme is $71,695.
What is Income or Wage Gap in Port Hueneme?
Income or Wage Gap in Port Hueneme is 24.4%.
Women in Port Hueneme earn 75.6 cents for every dollar earned by a man.
What is Family Income Deficit in Port Hueneme?
Family Income Deficit in Port Hueneme is $11,721.
Families that are below poverty line in Port Hueneme earn $11,721 less on average than the poverty threshold level.
What is Inequality or Gini Index in Port Hueneme?
Inequality or Gini Index in Port Hueneme is 0.39.
What is the Total Population of Port Hueneme?
Total Population of Port Hueneme is 21,847.
What is the Total Male Population of Port Hueneme?
Total Male Population of Port Hueneme is 11,140.
What is the Total Female Population of Port Hueneme?
Total Female Population of Port Hueneme is 10,707.
What is the Ratio of Males per 100 Females in Port Hueneme?
There are 104.04 Males per 100 Females in Port Hueneme.
What is the Ratio of Females per 100 Males in Port Hueneme?
There are 96.11 Females per 100 Males in Port Hueneme.
What is the Median Population Age in Port Hueneme?
Median Population Age in Port Hueneme is 34.8 Years.
What is the Average Family Size in Port Hueneme
Average Family Size in Port Hueneme is 3.5 People.
What is the Average Household Size in Port Hueneme
Average Household Size in Port Hueneme is 3.0 People.
How Large is the Labor Force in Port Hueneme?
There are 11,900 People in the Labor Forcein in Port Hueneme.
What is the Percentage of People in the Labor Force in Port Hueneme?
69.2% of People are in the Labor Force in Port Hueneme.
What is the Unemployment Rate in Port Hueneme?
Unemployment Rate in Port Hueneme is 8.9%.