Cities with the Highest Percentage of Households Heated without Fuel in Ohio
RELATED REPORTS & OPTIONS
Fuel-less Heating
Ohio
Compare Cities
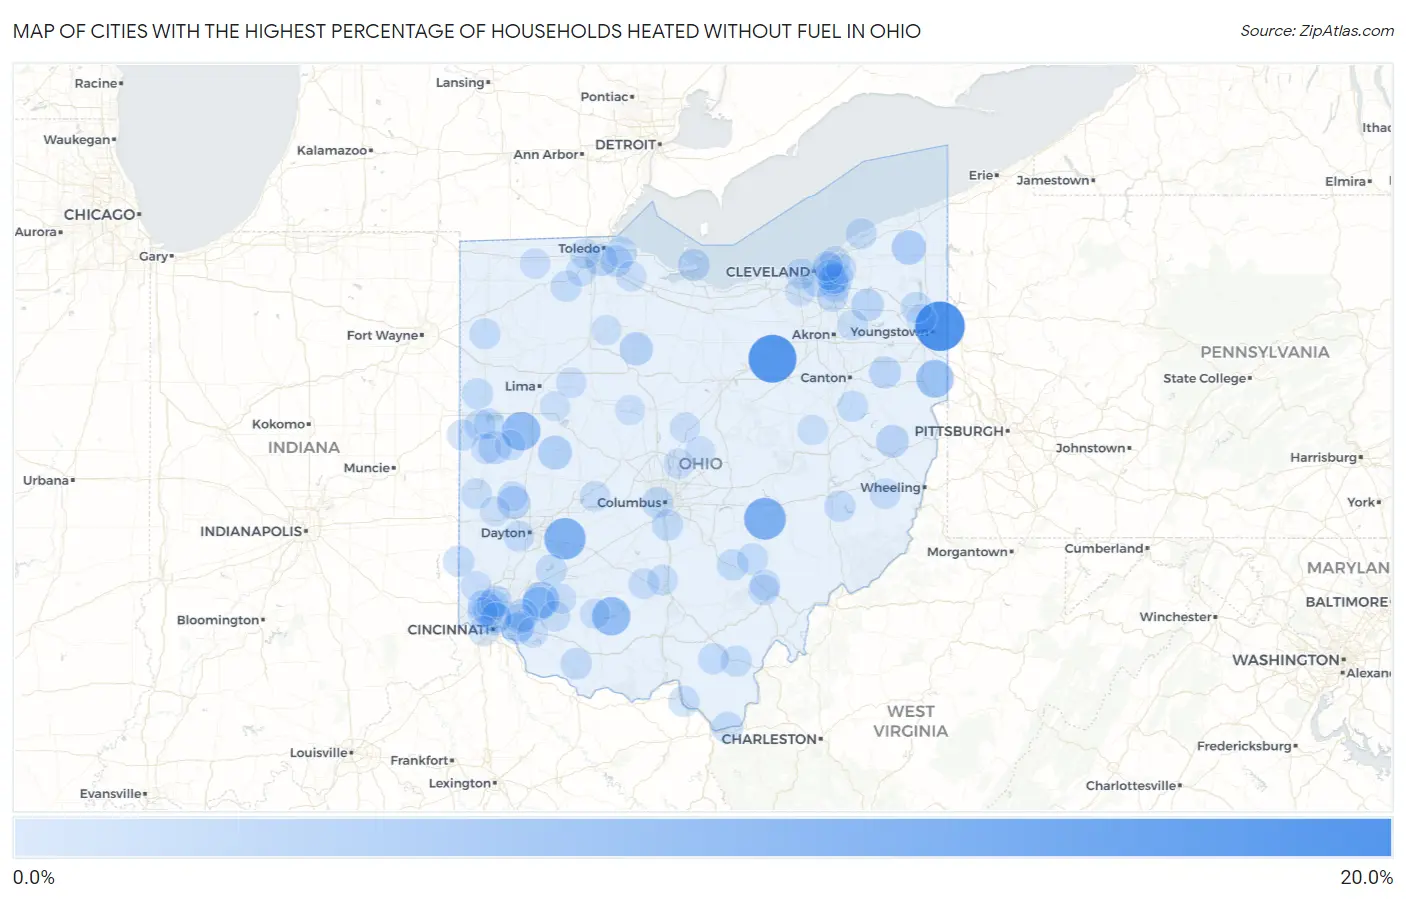
Map of Cities with the Highest Percentage of Households Heated without Fuel in Ohio
0.0%
20.0%
Cities with the Highest Percentage of Households Heated without Fuel in Ohio
| City | Fuel-less Heating | vs State | vs National | |
| 1. | Maplewood Park | 19.6% | 0.50%(+19.1)#1 | 1.2%(+18.4)#515 |
| 2. | Congress | 18.0% | 0.50%(+17.5)#2 | 1.2%(+16.8)#526 |
| 3. | Massieville | 13.0% | 0.50%(+12.5)#3 | 1.2%(+11.8)#578 |
| 4. | East Fultonham | 12.1% | 0.50%(+11.6)#4 | 1.2%(+10.9)#594 |
| 5. | Wilberforce | 11.7% | 0.50%(+11.2)#5 | 1.2%(+10.5)#601 |
| 6. | Kettlersville | 8.9% | 0.50%(+8.40)#6 | 1.2%(+7.70)#684 |
| 7. | Highland Holiday | 8.8% | 0.50%(+8.30)#7 | 1.2%(+7.60)#687 |
| 8. | Rogers | 8.0% | 0.50%(+7.50)#8 | 1.2%(+6.80)#736 |
| 9. | Butlerville | 6.7% | 0.50%(+6.20)#9 | 1.2%(+5.50)#819 |
| 10. | Rock Creek | 5.0% | 0.50%(+4.50)#10 | 1.2%(+3.80)#1,050 |
| 11. | Quincy | 4.7% | 0.50%(+4.20)#11 | 1.2%(+3.50)#1,107 |
| 12. | Pleasant Plain | 4.6% | 0.50%(+4.10)#12 | 1.2%(+3.40)#1,135 |
| 13. | Mccutchenville | 4.1% | 0.50%(+3.60)#13 | 1.2%(+2.90)#1,266 |
| 14. | Yorkshire | 3.8% | 0.50%(+3.30)#14 | 1.2%(+2.60)#1,350 |
| 15. | West Milton | 3.7% | 0.50%(+3.20)#15 | 1.2%(+2.50)#1,356 |
| 16. | Jewett | 3.6% | 0.50%(+3.10)#16 | 1.2%(+2.40)#1,406 |
| 17. | Mantua | 3.4% | 0.50%(+2.90)#17 | 1.2%(+2.20)#1,468 |
| 18. | Northgate | 3.2% | 0.50%(+2.70)#18 | 1.2%(+2.00)#1,534 |
| 19. | St Bernard | 3.1% | 0.50%(+2.60)#19 | 1.2%(+1.90)#1,575 |
| 20. | Rossford | 3.0% | 0.50%(+2.50)#20 | 1.2%(+1.80)#1,621 |
| 21. | Mulberry | 3.0% | 0.50%(+2.50)#21 | 1.2%(+1.80)#1,629 |
| 22. | Homeworth | 3.0% | 0.50%(+2.50)#22 | 1.2%(+1.80)#1,650 |
| 23. | Lakeside | 2.9% | 0.50%(+2.40)#23 | 1.2%(+1.70)#1,691 |
| 24. | Mount Healthy | 2.8% | 0.50%(+2.30)#24 | 1.2%(+1.60)#1,717 |
| 25. | Millbury | 2.6% | 0.50%(+2.10)#25 | 1.2%(+1.40)#1,870 |
| 26. | Mount Carmel | 2.5% | 0.50%(+2.00)#26 | 1.2%(+1.30)#1,936 |
| 27. | Greenhills | 2.5% | 0.50%(+2.00)#27 | 1.2%(+1.30)#1,946 |
| 28. | Curtice | 2.5% | 0.50%(+2.00)#28 | 1.2%(+1.30)#1,960 |
| 29. | Chesapeake | 2.5% | 0.50%(+2.00)#29 | 1.2%(+1.30)#1,963 |
| 30. | Russellville | 2.5% | 0.50%(+2.00)#30 | 1.2%(+1.30)#1,971 |
| 31. | Springdale | 2.4% | 0.50%(+1.90)#31 | 1.2%(+1.20)#1,998 |
| 32. | Logan | 2.4% | 0.50%(+1.90)#32 | 1.2%(+1.20)#2,005 |
| 33. | Harveysburg | 2.4% | 0.50%(+1.90)#33 | 1.2%(+1.20)#2,049 |
| 34. | Woodmere | 2.4% | 0.50%(+1.90)#34 | 1.2%(+1.20)#2,052 |
| 35. | Cuyahoga Heights | 2.4% | 0.50%(+1.90)#35 | 1.2%(+1.20)#2,056 |
| 36. | Senecaville | 2.4% | 0.50%(+1.90)#36 | 1.2%(+1.20)#2,063 |
| 37. | College Corner | 2.4% | 0.50%(+1.90)#37 | 1.2%(+1.20)#2,066 |
| 38. | Valleyview | 2.3% | 0.50%(+1.80)#38 | 1.2%(+1.10)#2,157 |
| 39. | Lockbourne | 2.3% | 0.50%(+1.80)#39 | 1.2%(+1.10)#2,169 |
| 40. | Bedford Heights | 2.2% | 0.50%(+1.70)#40 | 1.2%(+1.00)#2,185 |
| 41. | Morgandale | 2.2% | 0.50%(+1.70)#41 | 1.2%(+1.00)#2,231 |
| 42. | Grand Rapids | 2.2% | 0.50%(+1.70)#42 | 1.2%(+1.00)#2,243 |
| 43. | Rockford | 2.2% | 0.50%(+1.70)#43 | 1.2%(+1.00)#2,246 |
| 44. | Rio Grande | 2.2% | 0.50%(+1.70)#44 | 1.2%(+1.00)#2,253 |
| 45. | New Straitsville | 2.2% | 0.50%(+1.70)#45 | 1.2%(+1.00)#2,257 |
| 46. | Fairport Harbor | 2.1% | 0.50%(+1.60)#46 | 1.2%(+0.900)#2,344 |
| 47. | Franklin Furnace | 2.1% | 0.50%(+1.60)#47 | 1.2%(+0.900)#2,358 |
| 48. | Oak Hill | 2.1% | 0.50%(+1.60)#48 | 1.2%(+0.900)#2,363 |
| 49. | North Randall | 2.1% | 0.50%(+1.60)#49 | 1.2%(+0.900)#2,375 |
| 50. | Coldwater | 2.0% | 0.50%(+1.50)#50 | 1.2%(+0.800)#2,457 |
| 51. | Northfield | 2.0% | 0.50%(+1.50)#51 | 1.2%(+0.800)#2,461 |
| 52. | Drexel | 2.0% | 0.50%(+1.50)#52 | 1.2%(+0.800)#2,492 |
| 53. | Mineral City | 2.0% | 0.50%(+1.50)#53 | 1.2%(+0.800)#2,512 |
| 54. | Latty | 2.0% | 0.50%(+1.50)#54 | 1.2%(+0.800)#2,530 |
| 55. | Lakewood | 1.9% | 0.50%(+1.40)#55 | 1.2%(+0.700)#2,539 |
| 56. | Summerside | 1.9% | 0.50%(+1.40)#56 | 1.2%(+0.700)#2,596 |
| 57. | Fort Recovery | 1.9% | 0.50%(+1.40)#57 | 1.2%(+0.700)#2,625 |
| 58. | Frankfort | 1.9% | 0.50%(+1.40)#58 | 1.2%(+0.700)#2,642 |
| 59. | The Plains | 1.8% | 0.50%(+1.30)#59 | 1.2%(+0.600)#2,769 |
| 60. | Bethesda | 1.8% | 0.50%(+1.30)#60 | 1.2%(+0.600)#2,805 |
| 61. | Chauncey | 1.8% | 0.50%(+1.30)#61 | 1.2%(+0.600)#2,814 |
| 62. | Highland Hills | 1.8% | 0.50%(+1.30)#62 | 1.2%(+0.600)#2,829 |
| 63. | Montezuma | 1.8% | 0.50%(+1.30)#63 | 1.2%(+0.600)#2,861 |
| 64. | Cleveland Heights | 1.7% | 0.50%(+1.20)#64 | 1.2%(+0.500)#2,874 |
| 65. | Richmond Heights | 1.7% | 0.50%(+1.20)#65 | 1.2%(+0.500)#2,900 |
| 66. | Elmwood Place | 1.7% | 0.50%(+1.20)#66 | 1.2%(+0.500)#2,944 |
| 67. | Lake Lorelei | 1.7% | 0.50%(+1.20)#67 | 1.2%(+0.500)#2,968 |
| 68. | Wayne Lakes | 1.7% | 0.50%(+1.20)#68 | 1.2%(+0.500)#2,973 |
| 69. | Andersonville | 1.7% | 0.50%(+1.20)#69 | 1.2%(+0.500)#2,985 |
| 70. | Catawba | 1.7% | 0.50%(+1.20)#70 | 1.2%(+0.500)#3,002 |
| 71. | Shaker Heights | 1.6% | 0.50%(+1.10)#71 | 1.2%(+0.400)#3,030 |
| 72. | Kent | 1.6% | 0.50%(+1.10)#72 | 1.2%(+0.400)#3,032 |
| 73. | Baltic | 1.6% | 0.50%(+1.10)#73 | 1.2%(+0.400)#3,160 |
| 74. | Fulton | 1.6% | 0.50%(+1.10)#74 | 1.2%(+0.400)#3,190 |
| 75. | North Star | 1.6% | 0.50%(+1.10)#75 | 1.2%(+0.400)#3,203 |
| 76. | Milford | 1.5% | 0.50%(+1.000)#76 | 1.2%(+0.300)#3,280 |
| 77. | Ada | 1.5% | 0.50%(+1.000)#77 | 1.2%(+0.300)#3,291 |
| 78. | Batavia | 1.5% | 0.50%(+1.000)#78 | 1.2%(+0.300)#3,330 |
| 79. | Elmore | 1.5% | 0.50%(+1.000)#79 | 1.2%(+0.300)#3,355 |
| 80. | Millville | 1.5% | 0.50%(+1.000)#80 | 1.2%(+0.300)#3,395 |
| 81. | Mayfield Heights | 1.4% | 0.50%(+0.900)#81 | 1.2%(+0.200)#3,452 |
| 82. | White Oak | 1.4% | 0.50%(+0.900)#82 | 1.2%(+0.200)#3,455 |
| 83. | East Cleveland | 1.4% | 0.50%(+0.900)#83 | 1.2%(+0.200)#3,464 |
| 84. | Wauseon | 1.4% | 0.50%(+0.900)#84 | 1.2%(+0.200)#3,500 |
| 85. | Hillsboro | 1.4% | 0.50%(+0.900)#85 | 1.2%(+0.200)#3,507 |
| 86. | Waterville | 1.4% | 0.50%(+0.900)#86 | 1.2%(+0.200)#3,511 |
| 87. | Delshire | 1.4% | 0.50%(+0.900)#87 | 1.2%(+0.200)#3,535 |
| 88. | Fort Loramie | 1.4% | 0.50%(+0.900)#88 | 1.2%(+0.200)#3,579 |
| 89. | Galena | 1.4% | 0.50%(+0.900)#89 | 1.2%(+0.200)#3,590 |
| 90. | Midland | 1.4% | 0.50%(+0.900)#90 | 1.2%(+0.200)#3,630 |
| 91. | Ludlow Falls | 1.4% | 0.50%(+0.900)#91 | 1.2%(+0.200)#3,642 |
| 92. | Middleburg Heights | 1.3% | 0.50%(+0.800)#92 | 1.2%(+0.100)#3,693 |
| 93. | Fort Mckinley | 1.3% | 0.50%(+0.800)#93 | 1.2%(+0.100)#3,763 |
| 94. | Centerburg | 1.3% | 0.50%(+0.800)#94 | 1.2%(+0.100)#3,809 |
| 95. | Holland | 1.3% | 0.50%(+0.800)#95 | 1.2%(+0.100)#3,823 |
| 96. | Arcadia | 1.3% | 0.50%(+0.800)#96 | 1.2%(+0.100)#3,855 |
| 97. | Verona | 1.3% | 0.50%(+0.800)#97 | 1.2%(+0.100)#3,857 |
| 98. | Waynesfield | 1.3% | 0.50%(+0.800)#98 | 1.2%(+0.100)#3,858 |
| 99. | New Bloomington | 1.3% | 0.50%(+0.800)#99 | 1.2%(+0.100)#3,877 |
| 100. | Niles | 1.2% | 0.50%(+0.700)#100 | 1.2%(=0.000)#3,950 |
Common Questions
What are the Top 10 Cities with the Highest Percentage of Households Heated without Fuel in Ohio?
Top 10 Cities with the Highest Percentage of Households Heated without Fuel in Ohio are:
#1
19.6%
#2
18.0%
#3
12.1%
#4
11.7%
#5
8.9%
#6
8.8%
#7
8.0%
#8
6.7%
#9
5.0%
#10
4.7%
What city has the Highest Percentage of Households Heated without Fuel in Ohio?
Maplewood Park has the Highest Percentage of Households Heated without Fuel in Ohio with 19.6%.
What is the Percentage of Households Heated without Fuel in the State of Ohio?
Percentage of Households Heated without Fuel in Ohio is 0.50%.
What is the Percentage of Households Heated without Fuel in the United States?
Percentage of Households Heated without Fuel in the United States is 1.2%.