Cities with the Highest Percentage of Households Heated without Fuel in Alabama
RELATED REPORTS & OPTIONS
Fuel-less Heating
Alabama
Compare Cities
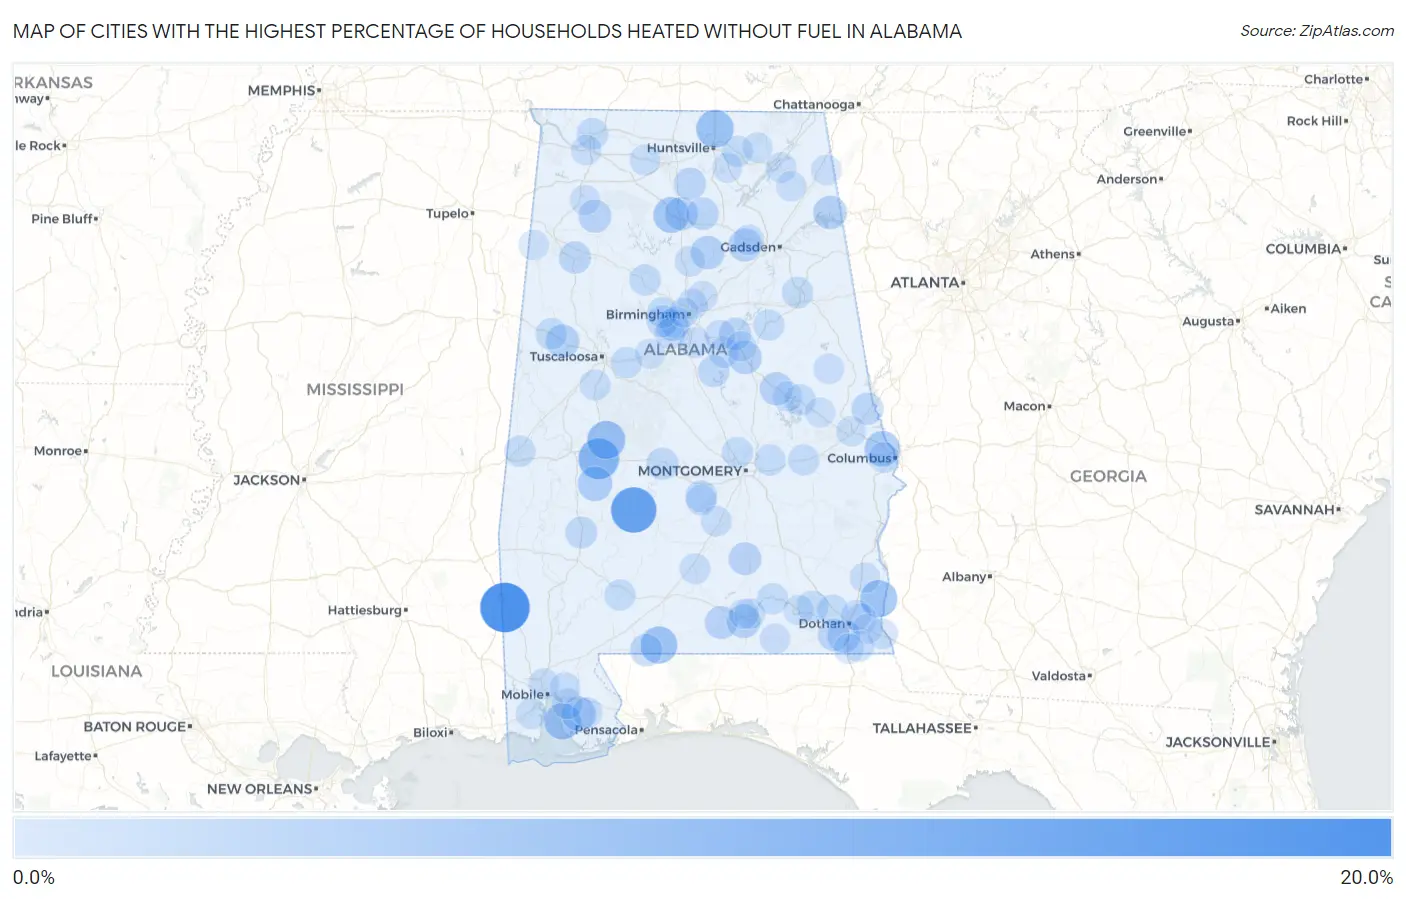
Map of Cities with the Highest Percentage of Households Heated without Fuel in Alabama
0.0%
20.0%
Cities with the Highest Percentage of Households Heated without Fuel in Alabama
| City | Fuel-less Heating | vs State | vs National | |
| 1. | Fruitdale | 16.7% | 0.60%(+16.1)#1 | 1.2%(+15.5)#538 |
| 2. | Boykin | 13.2% | 0.60%(+12.6)#2 | 1.2%(+12.0)#577 |
| 3. | Faunsdale | 9.4% | 0.60%(+8.80)#3 | 1.2%(+8.20)#660 |
| 4. | Newbern | 7.1% | 0.60%(+6.50)#4 | 1.2%(+5.90)#782 |
| 5. | Meridianville | 6.8% | 0.60%(+6.20)#5 | 1.2%(+5.60)#804 |
| 6. | Riverview | 6.3% | 0.60%(+5.70)#6 | 1.2%(+5.10)#863 |
| 7. | Haleburg | 6.3% | 0.60%(+5.70)#7 | 1.2%(+5.10)#865 |
| 8. | Point Clear | 5.9% | 0.60%(+5.30)#8 | 1.2%(+4.70)#908 |
| 9. | West Point | 5.3% | 0.60%(+4.70)#9 | 1.2%(+4.10)#993 |
| 10. | Smiths Station | 5.2% | 0.60%(+4.60)#10 | 1.2%(+4.00)#1,005 |
| 11. | Thomaston | 4.4% | 0.60%(+3.80)#11 | 1.2%(+3.20)#1,191 |
| 12. | Silverhill | 4.3% | 0.60%(+3.70)#12 | 1.2%(+3.10)#1,219 |
| 13. | Horn Hill | 3.6% | 0.60%(+3.00)#13 | 1.2%(+2.40)#1,413 |
| 14. | Gaylesville | 3.6% | 0.60%(+3.00)#14 | 1.2%(+2.40)#1,415 |
| 15. | Gordo | 3.5% | 0.60%(+2.90)#15 | 1.2%(+2.30)#1,432 |
| 16. | Oak Grove | 3.5% | 0.60%(+2.90)#16 | 1.2%(+2.30)#1,437 |
| 17. | Nectar | 3.5% | 0.60%(+2.90)#17 | 1.2%(+2.30)#1,443 |
| 18. | South Vinemont | 3.4% | 0.60%(+2.80)#18 | 1.2%(+2.20)#1,466 |
| 19. | Kellyton | 3.4% | 0.60%(+2.80)#19 | 1.2%(+2.20)#1,485 |
| 20. | Altoona | 3.3% | 0.60%(+2.70)#20 | 1.2%(+2.10)#1,503 |
| 21. | Haleyville | 3.1% | 0.60%(+2.50)#21 | 1.2%(+1.90)#1,574 |
| 22. | Carolina | 3.1% | 0.60%(+2.50)#22 | 1.2%(+1.90)#1,597 |
| 23. | Rehobeth | 2.9% | 0.60%(+2.30)#23 | 1.2%(+1.70)#1,678 |
| 24. | Rutledge | 2.9% | 0.60%(+2.30)#24 | 1.2%(+1.70)#1,698 |
| 25. | Fairview | 2.7% | 0.60%(+2.10)#25 | 1.2%(+1.50)#1,807 |
| 26. | Vincent | 2.6% | 0.60%(+2.00)#26 | 1.2%(+1.40)#1,866 |
| 27. | Pollard | 2.6% | 0.60%(+2.00)#27 | 1.2%(+1.40)#1,899 |
| 28. | Winfield | 2.5% | 0.60%(+1.90)#28 | 1.2%(+1.30)#1,937 |
| 29. | Somerville | 2.5% | 0.60%(+1.90)#29 | 1.2%(+1.30)#1,972 |
| 30. | Lanett | 2.4% | 0.60%(+1.80)#30 | 1.2%(+1.20)#2,008 |
| 31. | Malvern | 2.4% | 0.60%(+1.80)#31 | 1.2%(+1.20)#2,029 |
| 32. | Selma | 2.3% | 0.60%(+1.70)#32 | 1.2%(+1.10)#2,086 |
| 33. | Thomasville | 2.2% | 0.60%(+1.60)#33 | 1.2%(+1.00)#2,206 |
| 34. | Shelby | 2.2% | 0.60%(+1.60)#34 | 1.2%(+1.00)#2,256 |
| 35. | Brighton | 2.1% | 0.60%(+1.50)#35 | 1.2%(+0.900)#2,346 |
| 36. | Concord | 2.1% | 0.60%(+1.50)#36 | 1.2%(+0.900)#2,362 |
| 37. | Mosses | 2.1% | 0.60%(+1.50)#37 | 1.2%(+0.900)#2,382 |
| 38. | Cordova | 2.0% | 0.60%(+1.40)#38 | 1.2%(+0.800)#2,481 |
| 39. | Reform | 2.0% | 0.60%(+1.40)#39 | 1.2%(+0.800)#2,482 |
| 40. | Florence | 1.9% | 0.60%(+1.30)#40 | 1.2%(+0.700)#2,541 |
| 41. | Anniston | 1.9% | 0.60%(+1.30)#41 | 1.2%(+0.700)#2,552 |
| 42. | Jacksons Gap | 1.9% | 0.60%(+1.30)#42 | 1.2%(+0.700)#2,662 |
| 43. | Talladega | 1.8% | 0.60%(+1.20)#43 | 1.2%(+0.600)#2,713 |
| 44. | Fort Rucker | 1.8% | 0.60%(+1.20)#44 | 1.2%(+0.600)#2,740 |
| 45. | Midfield | 1.8% | 0.60%(+1.20)#45 | 1.2%(+0.600)#2,741 |
| 46. | Emerald Mountain | 1.8% | 0.60%(+1.20)#46 | 1.2%(+0.600)#2,756 |
| 47. | Elba | 1.8% | 0.60%(+1.20)#47 | 1.2%(+0.600)#2,757 |
| 48. | York | 1.8% | 0.60%(+1.20)#48 | 1.2%(+0.600)#2,775 |
| 49. | Millbrook | 1.7% | 0.60%(+1.10)#49 | 1.2%(+0.500)#2,887 |
| 50. | Coaling | 1.7% | 0.60%(+1.10)#50 | 1.2%(+0.500)#2,946 |
| 51. | Frisco City | 1.7% | 0.60%(+1.10)#51 | 1.2%(+0.500)#2,955 |
| 52. | Sylvan Springs | 1.6% | 0.60%(+1.000)#52 | 1.2%(+0.400)#3,136 |
| 53. | Franklin | 1.6% | 0.60%(+1.000)#53 | 1.2%(+0.400)#3,164 |
| 54. | Pinckard | 1.6% | 0.60%(+1.000)#54 | 1.2%(+0.400)#3,167 |
| 55. | Gurley | 1.6% | 0.60%(+1.000)#55 | 1.2%(+0.400)#3,174 |
| 56. | Bessemer | 1.5% | 0.60%(+0.900)#56 | 1.2%(+0.300)#3,237 |
| 57. | Daphne | 1.4% | 0.60%(+0.800)#57 | 1.2%(+0.200)#3,443 |
| 58. | Pelham | 1.4% | 0.60%(+0.800)#58 | 1.2%(+0.200)#3,447 |
| 59. | Chickasaw | 1.4% | 0.60%(+0.800)#59 | 1.2%(+0.200)#3,508 |
| 60. | Theodore | 1.4% | 0.60%(+0.800)#60 | 1.2%(+0.200)#3,519 |
| 61. | Ladonia | 1.4% | 0.60%(+0.800)#61 | 1.2%(+0.200)#3,531 |
| 62. | Moundville | 1.4% | 0.60%(+0.800)#62 | 1.2%(+0.200)#3,544 |
| 63. | Wilsonville | 1.4% | 0.60%(+0.800)#63 | 1.2%(+0.200)#3,566 |
| 64. | Georgiana | 1.4% | 0.60%(+0.800)#64 | 1.2%(+0.200)#3,582 |
| 65. | Cottonwood | 1.4% | 0.60%(+0.800)#65 | 1.2%(+0.200)#3,589 |
| 66. | Walnut Grove | 1.4% | 0.60%(+0.800)#66 | 1.2%(+0.200)#3,609 |
| 67. | Hillsboro | 1.4% | 0.60%(+0.800)#67 | 1.2%(+0.200)#3,619 |
| 68. | Spanish Fort | 1.3% | 0.60%(+0.700)#68 | 1.2%(+0.100)#3,715 |
| 69. | Fort Deposit | 1.3% | 0.60%(+0.700)#69 | 1.2%(+0.100)#3,814 |
| 70. | Hayden | 1.3% | 0.60%(+0.700)#70 | 1.2%(+0.100)#3,821 |
| 71. | Webb | 1.3% | 0.60%(+0.700)#71 | 1.2%(+0.100)#3,830 |
| 72. | Gordon | 1.3% | 0.60%(+0.700)#72 | 1.2%(+0.100)#3,880 |
| 73. | Gordonville | 1.3% | 0.60%(+0.700)#73 | 1.2%(+0.100)#3,884 |
| 74. | Center Point | 1.2% | 0.60%(+0.600)#74 | 1.2%(=0.000)#3,955 |
| 75. | Tuscumbia | 1.2% | 0.60%(+0.600)#75 | 1.2%(=0.000)#3,988 |
| 76. | Opp | 1.2% | 0.60%(+0.600)#76 | 1.2%(=0.000)#4,008 |
| 77. | Tarrant | 1.2% | 0.60%(+0.600)#77 | 1.2%(=0.000)#4,013 |
| 78. | Westover | 1.2% | 0.60%(+0.600)#78 | 1.2%(=0.000)#4,063 |
| 79. | Kinsey | 1.2% | 0.60%(+0.600)#79 | 1.2%(=0.000)#4,071 |
| 80. | Wadley | 1.2% | 0.60%(+0.600)#80 | 1.2%(=0.000)#4,124 |
| 81. | Section | 1.2% | 0.60%(+0.600)#81 | 1.2%(=0.000)#4,133 |
| 82. | Mentone | 1.2% | 0.60%(+0.600)#82 | 1.2%(=0.000)#4,174 |
| 83. | Opelika | 1.1% | 0.60%(+0.500)#83 | 1.2%(-0.100)#4,216 |
| 84. | Enterprise | 1.1% | 0.60%(+0.500)#84 | 1.2%(-0.100)#4,225 |
| 85. | Robertsdale | 1.1% | 0.60%(+0.500)#85 | 1.2%(-0.100)#4,299 |
| 86. | Childersburg | 1.1% | 0.60%(+0.500)#86 | 1.2%(-0.100)#4,327 |
| 87. | Abbeville | 1.1% | 0.60%(+0.500)#87 | 1.2%(-0.100)#4,396 |
| 88. | Samson | 1.1% | 0.60%(+0.500)#88 | 1.2%(-0.100)#4,418 |
| 89. | Fyffe | 1.1% | 0.60%(+0.500)#89 | 1.2%(-0.100)#4,428 |
| 90. | Phil Campbell | 1.1% | 0.60%(+0.500)#90 | 1.2%(-0.100)#4,454 |
| 91. | Alexander City | 1.0% | 0.60%(+0.400)#91 | 1.2%(-0.200)#4,591 |
| 92. | Owens Cross Roads | 1.0% | 0.60%(+0.400)#92 | 1.2%(-0.200)#4,748 |
| 93. | Ashford | 1.0% | 0.60%(+0.400)#93 | 1.2%(-0.200)#4,752 |
| 94. | Woodstock | 1.0% | 0.60%(+0.400)#94 | 1.2%(-0.200)#4,802 |
| 95. | Camp Hill | 1.0% | 0.60%(+0.400)#95 | 1.2%(-0.200)#4,805 |
| 96. | Babbie | 1.0% | 0.60%(+0.400)#96 | 1.2%(-0.200)#4,857 |
| 97. | Pleasant Groves | 1.0% | 0.60%(+0.400)#97 | 1.2%(-0.200)#4,863 |
| 98. | Detroit | 1.0% | 0.60%(+0.400)#98 | 1.2%(-0.200)#4,890 |
| 99. | Madrid | 1.0% | 0.60%(+0.400)#99 | 1.2%(-0.200)#4,894 |
| 100. | Birmingham | 0.90% | 0.60%(+0.300)#100 | 1.2%(-0.300)#4,912 |
Common Questions
What are the Top 10 Cities with the Highest Percentage of Households Heated without Fuel in Alabama?
Top 10 Cities with the Highest Percentage of Households Heated without Fuel in Alabama are:
#1
16.7%
#2
13.2%
#3
9.4%
#4
7.1%
#5
6.8%
#6
6.3%
#7
6.3%
#8
5.9%
#9
5.3%
#10
5.2%
What city has the Highest Percentage of Households Heated without Fuel in Alabama?
Fruitdale has the Highest Percentage of Households Heated without Fuel in Alabama with 16.7%.
What is the Percentage of Households Heated without Fuel in the State of Alabama?
Percentage of Households Heated without Fuel in Alabama is 0.60%.
What is the Percentage of Households Heated without Fuel in the United States?
Percentage of Households Heated without Fuel in the United States is 1.2%.