East San Gabriel, CA Map & Demographics
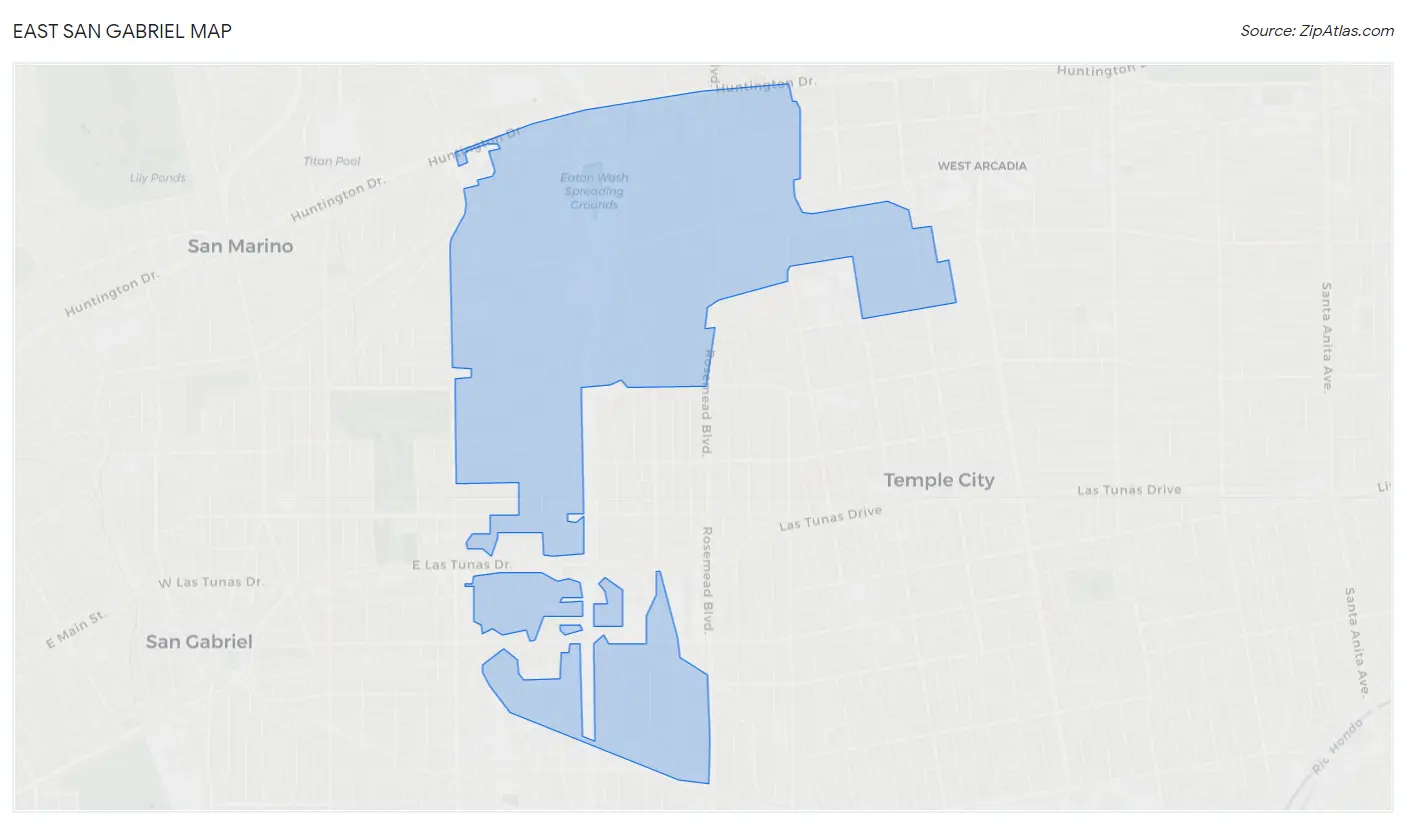
East San Gabriel Map
East San Gabriel Overview
$42,971
PER CAPITA INCOME
$113,475
AVG FAMILY INCOME
$100,952
AVG HOUSEHOLD INCOME
14.9%
WAGE / INCOME GAP [ % ]
85.1¢/ $1
WAGE / INCOME GAP [ $ ]
$11,700
FAMILY INCOME DEFICIT
0.45
INEQUALITY / GINI INDEX
22,654
TOTAL POPULATION
11,419
MALE POPULATION
11,235
FEMALE POPULATION
101.64
MALES / 100 FEMALES
98.39
FEMALES / 100 MALES
41.9
MEDIAN AGE
3.4
AVG FAMILY SIZE
3.0
AVG HOUSEHOLD SIZE
11,817
LABOR FORCE [ PEOPLE ]
63.1%
PERCENT IN LABOR FORCE
7.4%
UNEMPLOYMENT RATE
Income in East San Gabriel
Income Overview in East San Gabriel
Per Capita Income in East San Gabriel is $42,971, while median incomes of families and households are $113,475 and $100,952 respectively.
| Characteristic | Number | Measure |
| Per Capita Income | 22,654 | $42,971 |
| Median Family Income | 5,499 | $113,475 |
| Mean Family Income | 5,499 | $139,369 |
| Median Household Income | 7,638 | $100,952 |
| Mean Household Income | 7,638 | $124,948 |
| Income Deficit | 5,499 | $11,700 |
| Wage / Income Gap (%) | 22,654 | 14.91% |
| Wage / Income Gap ($) | 22,654 | 85.09¢ per $1 |
| Gini / Inequality Index | 22,654 | 0.45 |
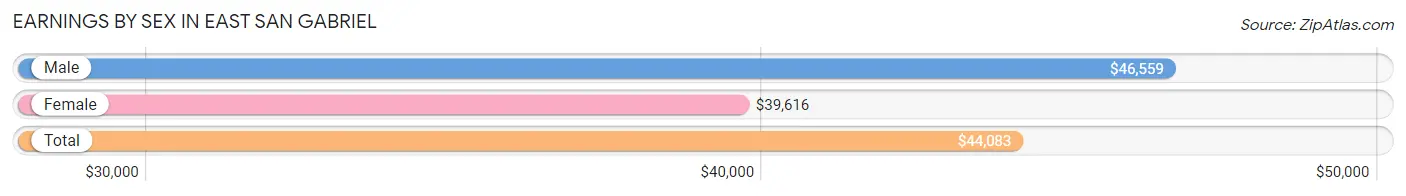
Earnings by Sex in East San Gabriel
Average Earnings in East San Gabriel are $44,083, $46,559 for men and $39,616 for women, a difference of 14.9%.
| Sex | Number | Average Earnings |
| Male | 6,448 (52.6%) | $46,559 |
| Female | 5,819 (47.4%) | $39,616 |
| Total | 12,267 (100.0%) | $44,083 |
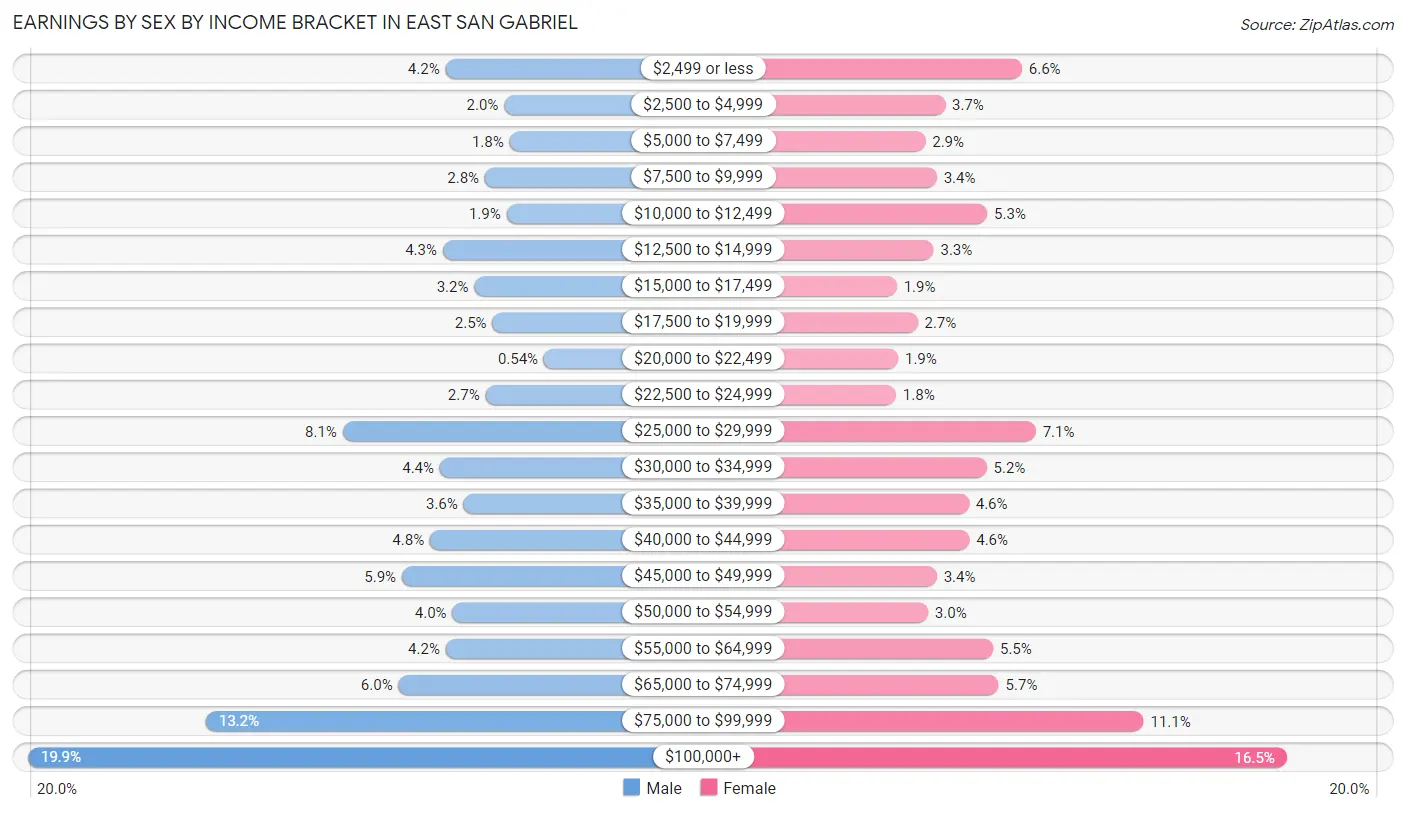
Earnings by Sex by Income Bracket in East San Gabriel
The most common earnings brackets in East San Gabriel are $100,000+ for men (1,282 | 19.9%) and $100,000+ for women (959 | 16.5%).
| Income | Male | Female |
| $2,499 or less | 273 (4.2%) | 382 (6.6%) |
| $2,500 to $4,999 | 131 (2.0%) | 214 (3.7%) |
| $5,000 to $7,499 | 118 (1.8%) | 171 (2.9%) |
| $7,500 to $9,999 | 177 (2.8%) | 196 (3.4%) |
| $10,000 to $12,499 | 125 (1.9%) | 306 (5.3%) |
| $12,500 to $14,999 | 279 (4.3%) | 189 (3.3%) |
| $15,000 to $17,499 | 203 (3.2%) | 109 (1.9%) |
| $17,500 to $19,999 | 159 (2.5%) | 154 (2.6%) |
| $20,000 to $22,499 | 35 (0.5%) | 112 (1.9%) |
| $22,500 to $24,999 | 176 (2.7%) | 107 (1.8%) |
| $25,000 to $29,999 | 521 (8.1%) | 412 (7.1%) |
| $30,000 to $34,999 | 286 (4.4%) | 305 (5.2%) |
| $35,000 to $39,999 | 229 (3.5%) | 266 (4.6%) |
| $40,000 to $44,999 | 310 (4.8%) | 267 (4.6%) |
| $45,000 to $49,999 | 378 (5.9%) | 196 (3.4%) |
| $50,000 to $54,999 | 256 (4.0%) | 177 (3.0%) |
| $55,000 to $64,999 | 272 (4.2%) | 319 (5.5%) |
| $65,000 to $74,999 | 386 (6.0%) | 331 (5.7%) |
| $75,000 to $99,999 | 852 (13.2%) | 647 (11.1%) |
| $100,000+ | 1,282 (19.9%) | 959 (16.5%) |
| Total | 6,448 (100.0%) | 5,819 (100.0%) |
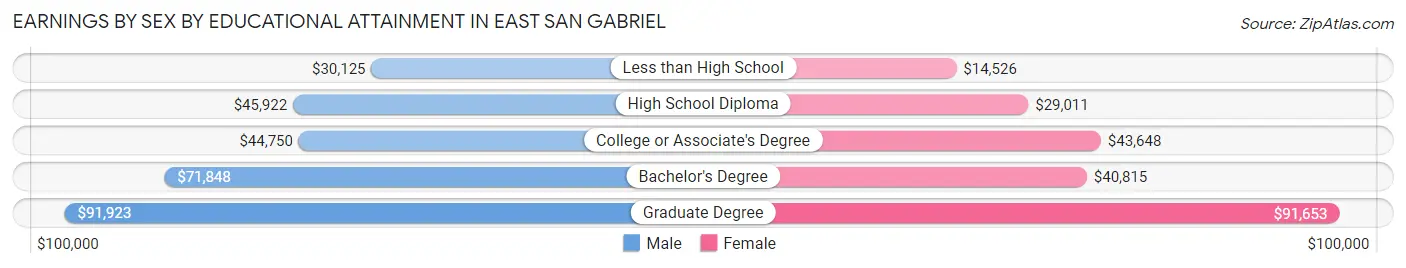
Earnings by Sex by Educational Attainment in East San Gabriel
Average earnings in East San Gabriel are $51,635 for men and $44,567 for women, a difference of 13.7%. Men with an educational attainment of graduate degree enjoy the highest average annual earnings of $91,923, while those with less than high school education earn the least with $30,125. Women with an educational attainment of graduate degree earn the most with the average annual earnings of $91,653, while those with less than high school education have the smallest earnings of $14,526.
| Educational Attainment | Male Income | Female Income |
| Less than High School | $30,125 | $14,526 |
| High School Diploma | $45,922 | $29,011 |
| College or Associate's Degree | $44,750 | $43,648 |
| Bachelor's Degree | $71,848 | $40,815 |
| Graduate Degree | $91,923 | $91,653 |
| Total | $51,635 | $44,567 |
Family Income in East San Gabriel
Family Income Brackets in East San Gabriel
According to the East San Gabriel family income data, there are 1,364 families falling into the $100,000 to $149,999 income range, which is the most common income bracket and makes up 24.8% of all families. Conversely, the $10,000 to $14,999 income bracket is the least frequent group with only 126 families (2.3%) belonging to this category.
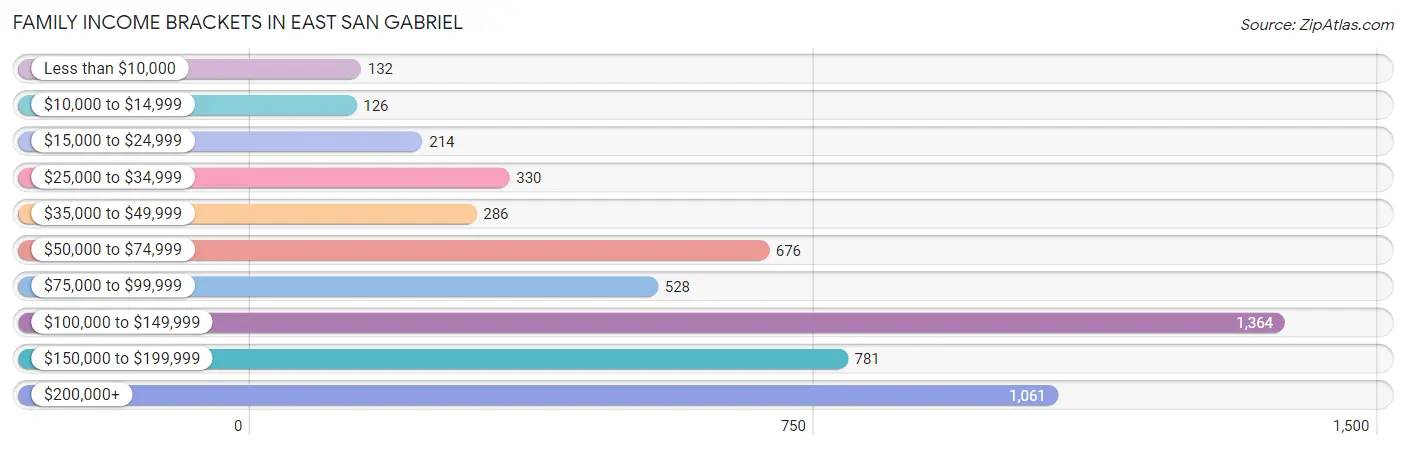
| Income Bracket | # Families | % Families |
| Less than $10,000 | 132 | 2.4% |
| $10,000 to $14,999 | 126 | 2.3% |
| $15,000 to $24,999 | 214 | 3.9% |
| $25,000 to $34,999 | 330 | 6.0% |
| $35,000 to $49,999 | 286 | 5.2% |
| $50,000 to $74,999 | 676 | 12.3% |
| $75,000 to $99,999 | 528 | 9.6% |
| $100,000 to $149,999 | 1,364 | 24.8% |
| $150,000 to $199,999 | 781 | 14.2% |
| $200,000+ | 1,061 | 19.3% |
Family Income by Famaliy Size in East San Gabriel
5-person families (355 | 6.5%) account for the highest median family income in East San Gabriel with $137,543 per family, while 2-person families (1,949 | 35.4%) have the highest median income of $48,386 per family member.
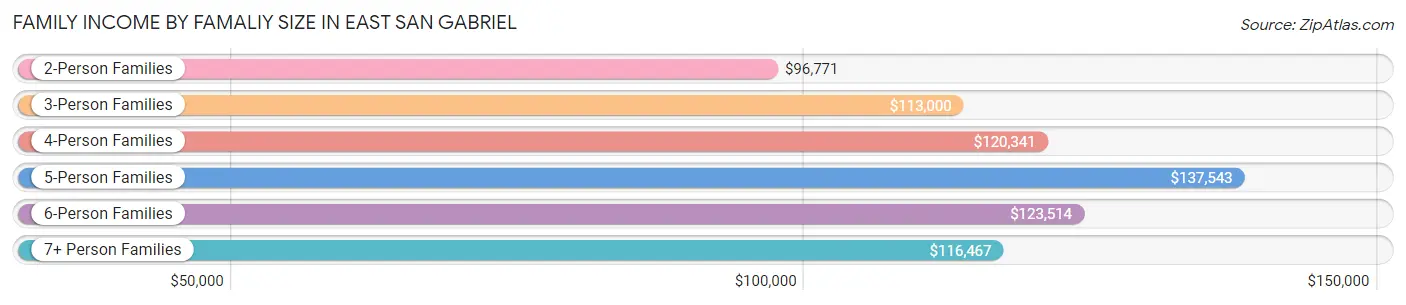
| Income Bracket | # Families | Median Income |
| 2-Person Families | 1,949 (35.4%) | $96,771 |
| 3-Person Families | 1,638 (29.8%) | $113,000 |
| 4-Person Families | 1,099 (20.0%) | $120,341 |
| 5-Person Families | 355 (6.5%) | $137,543 |
| 6-Person Families | 319 (5.8%) | $123,514 |
| 7+ Person Families | 139 (2.5%) | $116,467 |
| Total | 5,499 (100.0%) | $113,475 |
Family Income by Number of Earners in East San Gabriel
The median family income in East San Gabriel is $113,475, with families comprising 2 earners (2,614) having the highest median family income of $138,140, while families with no earners (563) have the lowest median family income of $34,844, accounting for 47.5% and 10.2% of families, respectively.
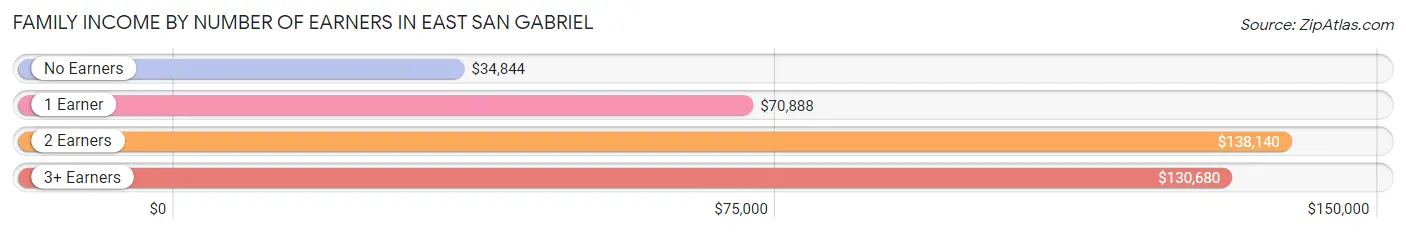
| Number of Earners | # Families | Median Income |
| No Earners | 563 (10.2%) | $34,844 |
| 1 Earner | 1,465 (26.6%) | $70,888 |
| 2 Earners | 2,614 (47.5%) | $138,140 |
| 3+ Earners | 857 (15.6%) | $130,680 |
| Total | 5,499 (100.0%) | $113,475 |
Household Income in East San Gabriel
Household Income Brackets in East San Gabriel
With 1,673 households falling in the category, the $100,000 to $149,999 income range is the most frequent in East San Gabriel, accounting for 21.9% of all households. In contrast, only 260 households (3.4%) fall into the $10,000 to $14,999 income bracket, making it the least populous group.
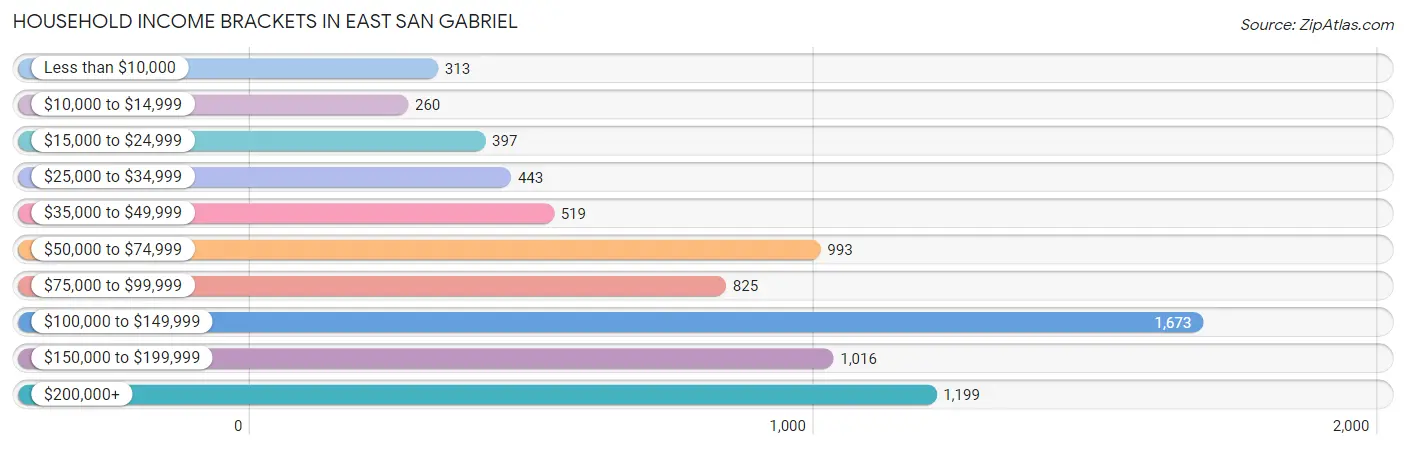
| Income Bracket | # Households | % Households |
| Less than $10,000 | 313 | 4.1% |
| $10,000 to $14,999 | 260 | 3.4% |
| $15,000 to $24,999 | 397 | 5.2% |
| $25,000 to $34,999 | 443 | 5.8% |
| $35,000 to $49,999 | 519 | 6.8% |
| $50,000 to $74,999 | 993 | 13.0% |
| $75,000 to $99,999 | 825 | 10.8% |
| $100,000 to $149,999 | 1,673 | 21.9% |
| $150,000 to $199,999 | 1,016 | 13.3% |
| $200,000+ | 1,199 | 15.7% |
Household Income by Householder Age in East San Gabriel
The median household income in East San Gabriel is $100,952, with the highest median household income of $112,208 found in the 45 to 64 years age bracket for the primary householder. A total of 3,071 households (40.2%) fall into this category. Meanwhile, the 15 to 24 years age bracket for the primary householder has the lowest median household income of $37,941, with 148 households (1.9%) in this group.
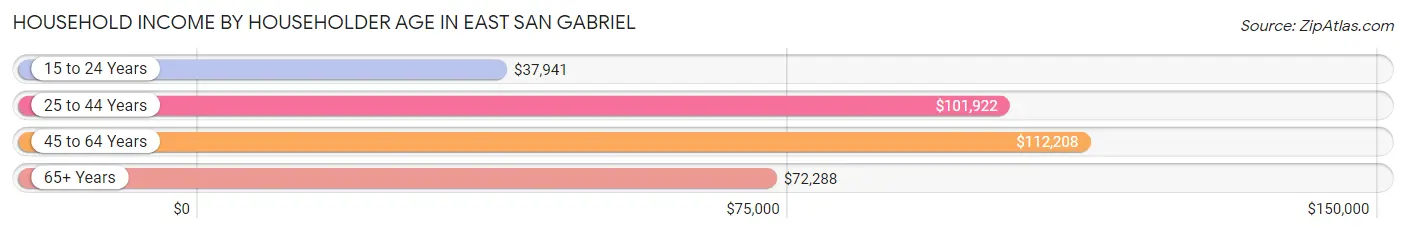
| Income Bracket | # Households | Median Income |
| 15 to 24 Years | 148 (1.9%) | $37,941 |
| 25 to 44 Years | 2,293 (30.0%) | $101,922 |
| 45 to 64 Years | 3,071 (40.2%) | $112,208 |
| 65+ Years | 2,126 (27.8%) | $72,288 |
| Total | 7,638 (100.0%) | $100,952 |
Poverty in East San Gabriel
Income Below Poverty by Sex and Age in East San Gabriel
With 10.6% poverty level for males and 11.6% for females among the residents of East San Gabriel, 15 year old males and 16 and 17 year old females are the most vulnerable to poverty, with 44 males (27.2%) and 95 females (41.3%) in their respective age groups living below the poverty level.
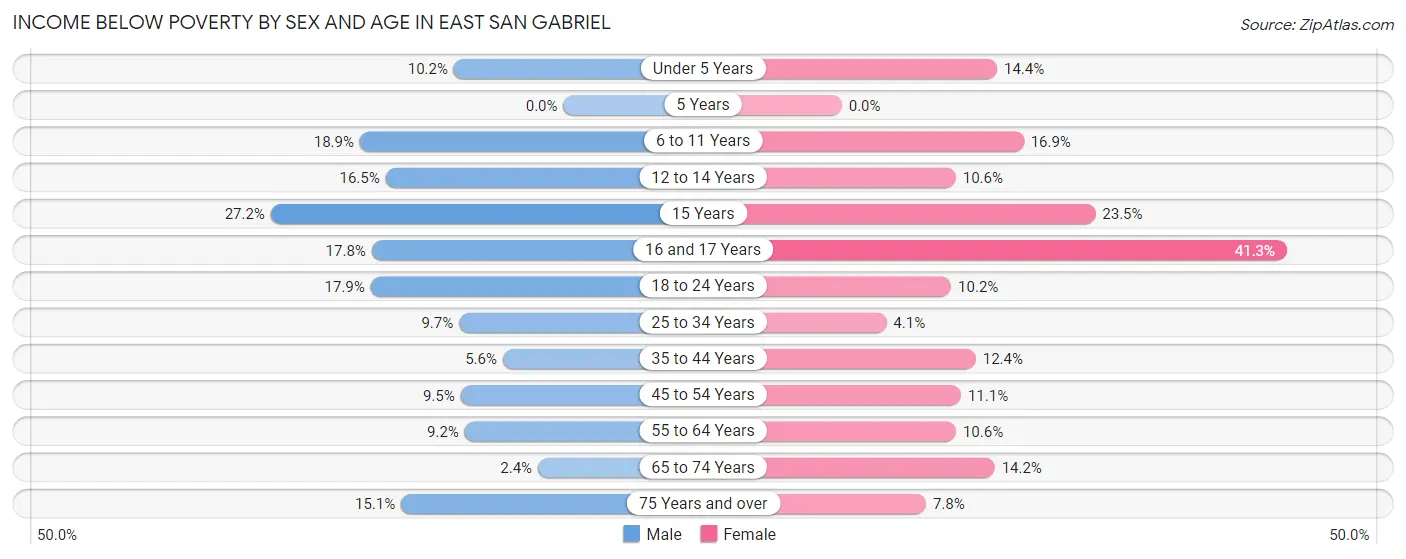
| Age Bracket | Male | Female |
| Under 5 Years | 67 (10.2%) | 84 (14.4%) |
| 5 Years | 0 (0.0%) | 0 (0.0%) |
| 6 to 11 Years | 112 (18.9%) | 94 (16.9%) |
| 12 to 14 Years | 81 (16.5%) | 40 (10.6%) |
| 15 Years | 44 (27.2%) | 32 (23.5%) |
| 16 and 17 Years | 53 (17.8%) | 95 (41.3%) |
| 18 to 24 Years | 153 (17.9%) | 93 (10.2%) |
| 25 to 34 Years | 157 (9.7%) | 49 (4.1%) |
| 35 to 44 Years | 84 (5.6%) | 201 (12.4%) |
| 45 to 54 Years | 142 (9.5%) | 187 (11.1%) |
| 55 to 64 Years | 138 (9.2%) | 163 (10.6%) |
| 65 to 74 Years | 26 (2.4%) | 182 (14.2%) |
| 75 Years and over | 144 (15.1%) | 64 (7.8%) |
| Total | 1,201 (10.6%) | 1,284 (11.6%) |
Income Above Poverty by Sex and Age in East San Gabriel
According to the poverty statistics in East San Gabriel, males aged 5 years and females aged 5 years are the age groups that are most secure financially, with 100.0% of males and 100.0% of females in these age groups living above the poverty line.
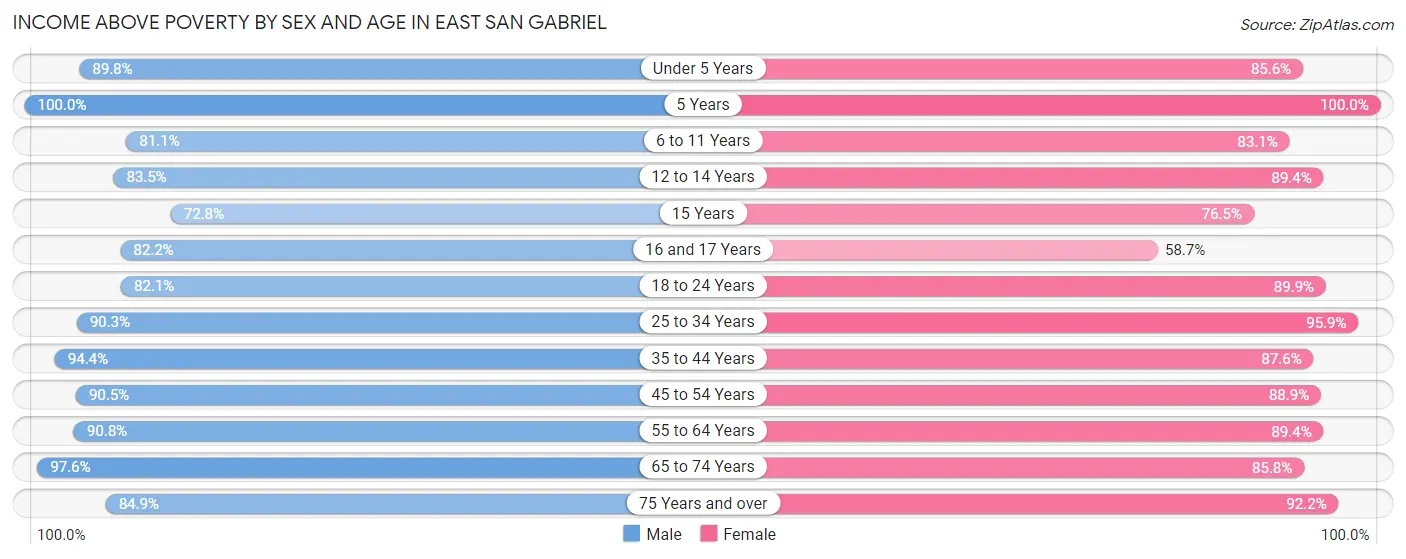
| Age Bracket | Male | Female |
| Under 5 Years | 592 (89.8%) | 499 (85.6%) |
| 5 Years | 117 (100.0%) | 146 (100.0%) |
| 6 to 11 Years | 481 (81.1%) | 463 (83.1%) |
| 12 to 14 Years | 410 (83.5%) | 338 (89.4%) |
| 15 Years | 118 (72.8%) | 104 (76.5%) |
| 16 and 17 Years | 245 (82.2%) | 135 (58.7%) |
| 18 to 24 Years | 702 (82.1%) | 823 (89.8%) |
| 25 to 34 Years | 1,465 (90.3%) | 1,135 (95.9%) |
| 35 to 44 Years | 1,411 (94.4%) | 1,415 (87.6%) |
| 45 to 54 Years | 1,347 (90.5%) | 1,504 (88.9%) |
| 55 to 64 Years | 1,368 (90.8%) | 1,375 (89.4%) |
| 65 to 74 Years | 1,074 (97.6%) | 1,101 (85.8%) |
| 75 Years and over | 812 (84.9%) | 755 (92.2%) |
| Total | 10,142 (89.4%) | 9,793 (88.4%) |
Income Below Poverty Among Married-Couple Families in East San Gabriel
The poverty statistics for married-couple families in East San Gabriel show that 5.3% or 211 of the total 3,983 families live below the poverty line. Families with 3 or 4 children have the highest poverty rate of 30.9%, comprising of 50 families. On the other hand, families with no children have the lowest poverty rate of 3.3%, which includes 76 families.
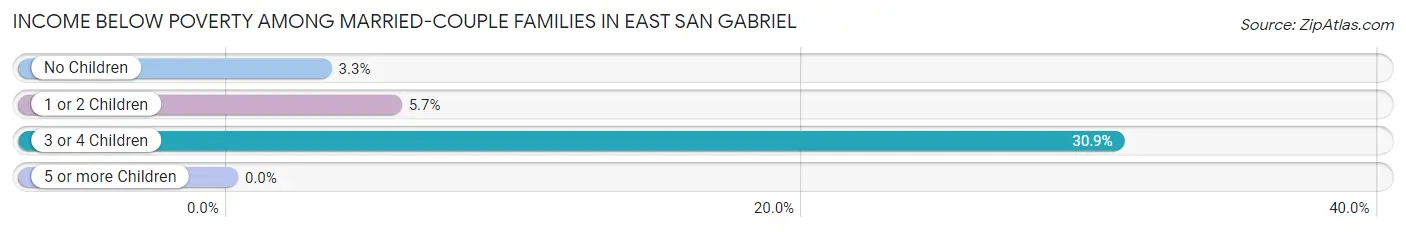
| Children | Above Poverty | Below Poverty |
| No Children | 2,253 (96.7%) | 76 (3.3%) |
| 1 or 2 Children | 1,407 (94.3%) | 85 (5.7%) |
| 3 or 4 Children | 112 (69.1%) | 50 (30.9%) |
| 5 or more Children | 0 (0.0%) | 0 (0.0%) |
| Total | 3,772 (94.7%) | 211 (5.3%) |
Income Below Poverty Among Single-Parent Households in East San Gabriel
According to the poverty data in East San Gabriel, 7.3% or 38 single-father households and 19.5% or 194 single-mother households are living below the poverty line. Among single-father households, those with no children have the highest poverty rate, with 38 households (12.4%) experiencing poverty. Likewise, among single-mother households, those with 3 or 4 children have the highest poverty rate, with 22 households (62.9%) falling below the poverty line.
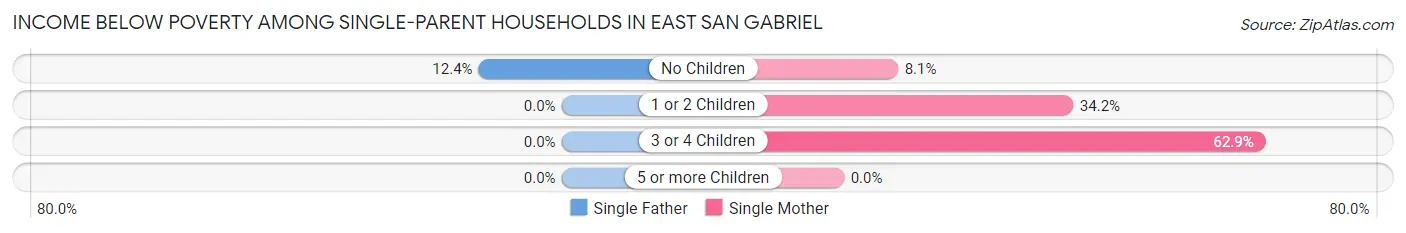
| Children | Single Father | Single Mother |
| No Children | 38 (12.4%) | 48 (8.1%) |
| 1 or 2 Children | 0 (0.0%) | 124 (34.2%) |
| 3 or 4 Children | 0 (0.0%) | 22 (62.9%) |
| 5 or more Children | 0 (0.0%) | 0 (0.0%) |
| Total | 38 (7.3%) | 194 (19.5%) |
Income Below Poverty Among Married-Couple vs Single-Parent Households in East San Gabriel
The poverty data for East San Gabriel shows that 211 of the married-couple family households (5.3%) and 232 of the single-parent households (15.3%) are living below the poverty level. Within the married-couple family households, those with 3 or 4 children have the highest poverty rate, with 50 households (30.9%) falling below the poverty line. Among the single-parent households, those with 3 or 4 children have the highest poverty rate, with 22 household (62.9%) living below poverty.
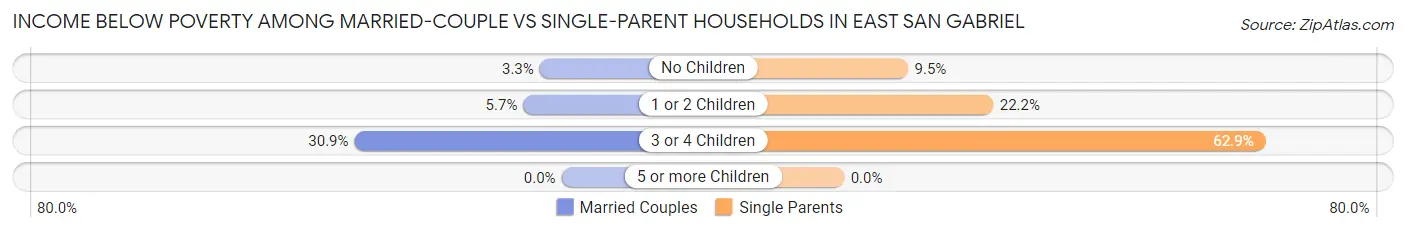
| Children | Married-Couple Families | Single-Parent Households |
| No Children | 76 (3.3%) | 86 (9.5%) |
| 1 or 2 Children | 85 (5.7%) | 124 (22.2%) |
| 3 or 4 Children | 50 (30.9%) | 22 (62.9%) |
| 5 or more Children | 0 (0.0%) | 0 (0.0%) |
| Total | 211 (5.3%) | 232 (15.3%) |
Race in East San Gabriel
The most populous races in East San Gabriel are Asian (12,180 | 53.8%), Hispanic or Latino (5,904 | 26.1%), and White / Caucasian (5,423 | 23.9%).
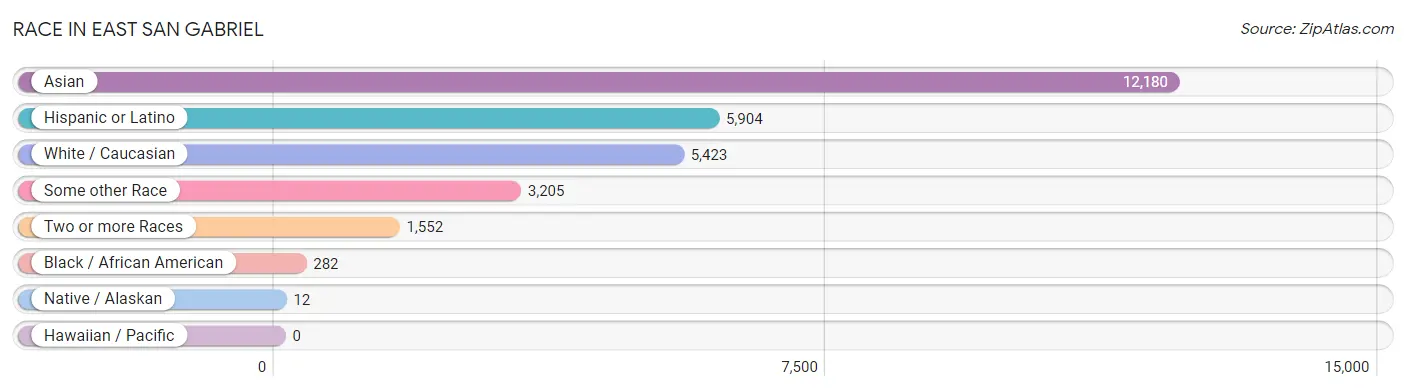
| Race | # Population | % Population |
| Asian | 12,180 | 53.8% |
| Black / African American | 282 | 1.2% |
| Hawaiian / Pacific | 0 | 0.0% |
| Hispanic or Latino | 5,904 | 26.1% |
| Native / Alaskan | 12 | 0.1% |
| White / Caucasian | 5,423 | 23.9% |
| Two or more Races | 1,552 | 6.9% |
| Some other Race | 3,205 | 14.1% |
| Total | 22,654 | 100.0% |
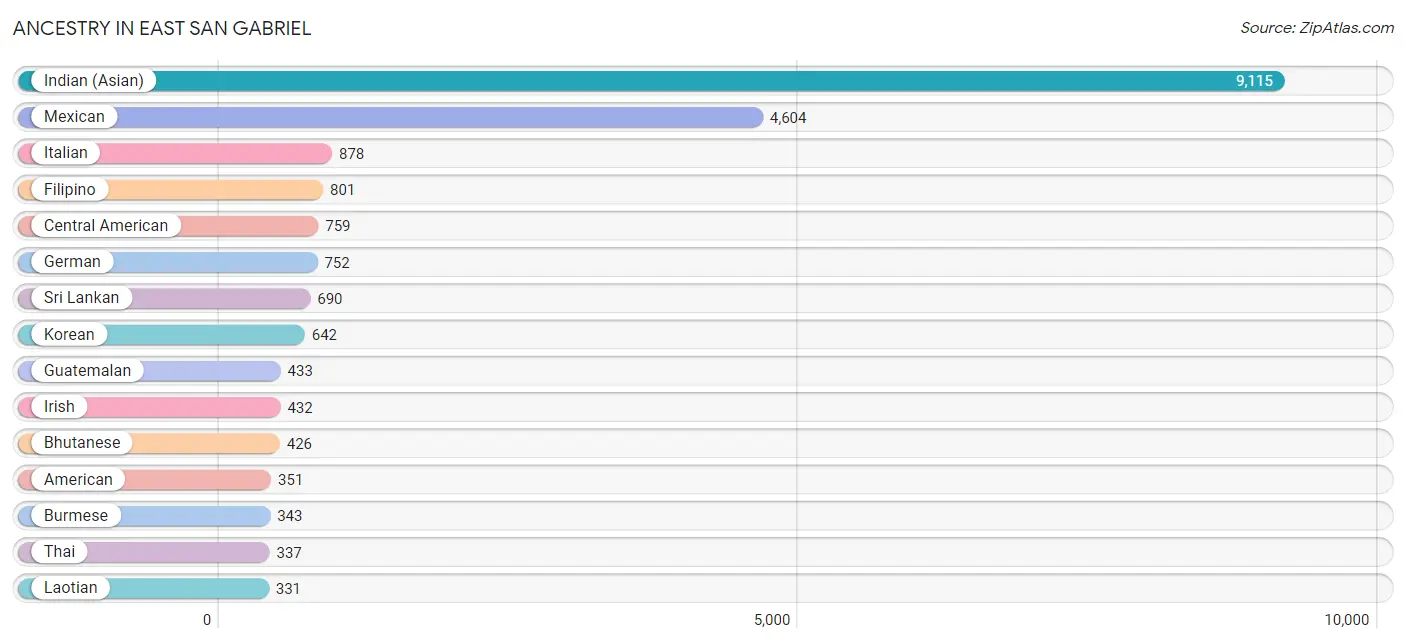
Ancestry in East San Gabriel
The most populous ancestries reported in East San Gabriel are Indian (Asian) (9,115 | 40.2%), Mexican (4,604 | 20.3%), Italian (878 | 3.9%), Filipino (801 | 3.5%), and Central American (759 | 3.4%), together accounting for 71.3% of all East San Gabriel residents.
| Ancestry | # Population | % Population |
| African | 45 | 0.2% |
| American | 351 | 1.5% |
| Arab | 210 | 0.9% |
| Argentinean | 132 | 0.6% |
| Armenian | 128 | 0.6% |
| Australian | 8 | 0.0% |
| Bhutanese | 426 | 1.9% |
| Bolivian | 11 | 0.1% |
| British | 51 | 0.2% |
| Bulgarian | 4 | 0.0% |
| Burmese | 343 | 1.5% |
| Cambodian | 24 | 0.1% |
| Central American | 759 | 3.4% |
| Chilean | 27 | 0.1% |
| Colombian | 9 | 0.0% |
| Costa Rican | 72 | 0.3% |
| Cuban | 22 | 0.1% |
| Czech | 23 | 0.1% |
| Czechoslovakian | 7 | 0.0% |
| Danish | 25 | 0.1% |
| Dutch | 101 | 0.4% |
| Eastern European | 67 | 0.3% |
| Egyptian | 130 | 0.6% |
| English | 319 | 1.4% |
| European | 118 | 0.5% |
| Filipino | 801 | 3.5% |
| Finnish | 9 | 0.0% |
| French | 85 | 0.4% |
| German | 752 | 3.3% |
| Greek | 35 | 0.2% |
| Guatemalan | 433 | 1.9% |
| Hungarian | 45 | 0.2% |
| Indian (Asian) | 9,115 | 40.2% |
| Indonesian | 66 | 0.3% |
| Iranian | 16 | 0.1% |
| Irish | 432 | 1.9% |
| Italian | 878 | 3.9% |
| Japanese | 13 | 0.1% |
| Korean | 642 | 2.8% |
| Laotian | 331 | 1.5% |
| Lebanese | 52 | 0.2% |
| Maltese | 12 | 0.1% |
| Mexican | 4,604 | 20.3% |
| Mongolian | 36 | 0.2% |
| New Zealander | 44 | 0.2% |
| Northern European | 12 | 0.1% |
| Norwegian | 40 | 0.2% |
| Pakistani | 133 | 0.6% |
| Palestinian | 13 | 0.1% |
| Panamanian | 55 | 0.2% |
| Peruvian | 78 | 0.3% |
| Polish | 216 | 0.9% |
| Portuguese | 25 | 0.1% |
| Puerto Rican | 23 | 0.1% |
| Romanian | 70 | 0.3% |
| Russian | 23 | 0.1% |
| Salvadoran | 105 | 0.5% |
| Scandinavian | 17 | 0.1% |
| Scotch-Irish | 20 | 0.1% |
| Scottish | 101 | 0.4% |
| Serbian | 16 | 0.1% |
| South American | 290 | 1.3% |
| Spaniard | 37 | 0.2% |
| Spanish | 86 | 0.4% |
| Sri Lankan | 690 | 3.0% |
| Subsaharan African | 45 | 0.2% |
| Swedish | 134 | 0.6% |
| Syrian | 38 | 0.2% |
| Thai | 337 | 1.5% |
| Ukrainian | 16 | 0.1% |
| Welsh | 14 | 0.1% | View All 71 Rows |
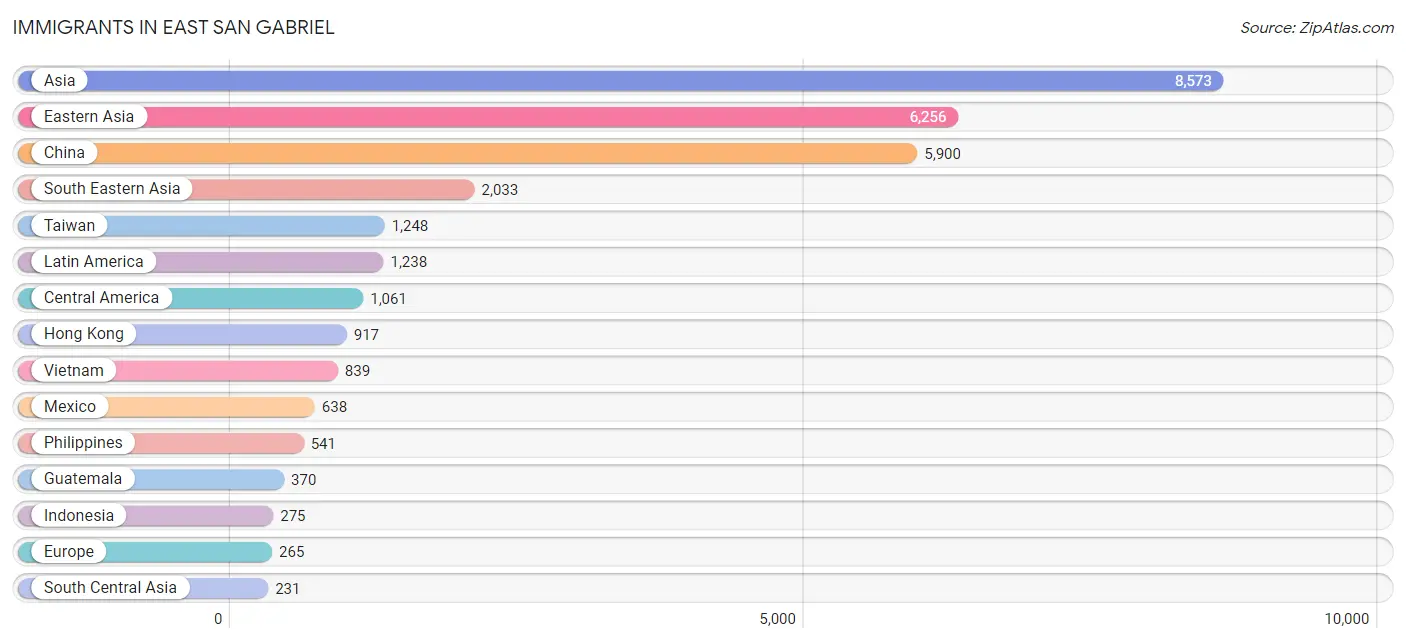
Immigrants in East San Gabriel
The most numerous immigrant groups reported in East San Gabriel came from Asia (8,573 | 37.8%), Eastern Asia (6,256 | 27.6%), China (5,900 | 26.0%), South Eastern Asia (2,033 | 9.0%), and Taiwan (1,248 | 5.5%), together accounting for 106.0% of all East San Gabriel residents.
| Immigration Origin | # Population | % Population |
| Africa | 210 | 0.9% |
| Argentina | 97 | 0.4% |
| Asia | 8,573 | 37.8% |
| Australia | 23 | 0.1% |
| Belgium | 13 | 0.1% |
| Brazil | 17 | 0.1% |
| Cambodia | 90 | 0.4% |
| Cameroon | 27 | 0.1% |
| Canada | 8 | 0.0% |
| Central America | 1,061 | 4.7% |
| Chile | 46 | 0.2% |
| China | 5,900 | 26.0% |
| Colombia | 9 | 0.0% |
| Costa Rica | 11 | 0.1% |
| Eastern Africa | 13 | 0.1% |
| Eastern Asia | 6,256 | 27.6% |
| Eastern Europe | 53 | 0.2% |
| Egypt | 76 | 0.3% |
| El Salvador | 6 | 0.0% |
| Europe | 265 | 1.2% |
| France | 13 | 0.1% |
| Germany | 16 | 0.1% |
| Guatemala | 370 | 1.6% |
| Hong Kong | 917 | 4.1% |
| India | 195 | 0.9% |
| Indonesia | 275 | 1.2% |
| Iran | 16 | 0.1% |
| Italy | 165 | 0.7% |
| Japan | 137 | 0.6% |
| Kenya | 13 | 0.1% |
| Korea | 208 | 0.9% |
| Laos | 9 | 0.0% |
| Latin America | 1,238 | 5.5% |
| Lebanon | 25 | 0.1% |
| Malaysia | 87 | 0.4% |
| Mexico | 638 | 2.8% |
| Middle Africa | 27 | 0.1% |
| Nicaragua | 29 | 0.1% |
| Northern Africa | 76 | 0.3% |
| Northern Europe | 5 | 0.0% |
| Oceania | 67 | 0.3% |
| Panama | 7 | 0.0% |
| Philippines | 541 | 2.4% |
| Poland | 19 | 0.1% |
| Romania | 27 | 0.1% |
| Scotland | 5 | 0.0% |
| South America | 177 | 0.8% |
| South Central Asia | 231 | 1.0% |
| South Eastern Asia | 2,033 | 9.0% |
| Southern Europe | 165 | 0.7% |
| Sri Lanka | 20 | 0.1% |
| Syria | 28 | 0.1% |
| Taiwan | 1,248 | 5.5% |
| Thailand | 57 | 0.3% |
| Vietnam | 839 | 3.7% |
| Western Asia | 53 | 0.2% |
| Western Europe | 42 | 0.2% | View All 57 Rows |
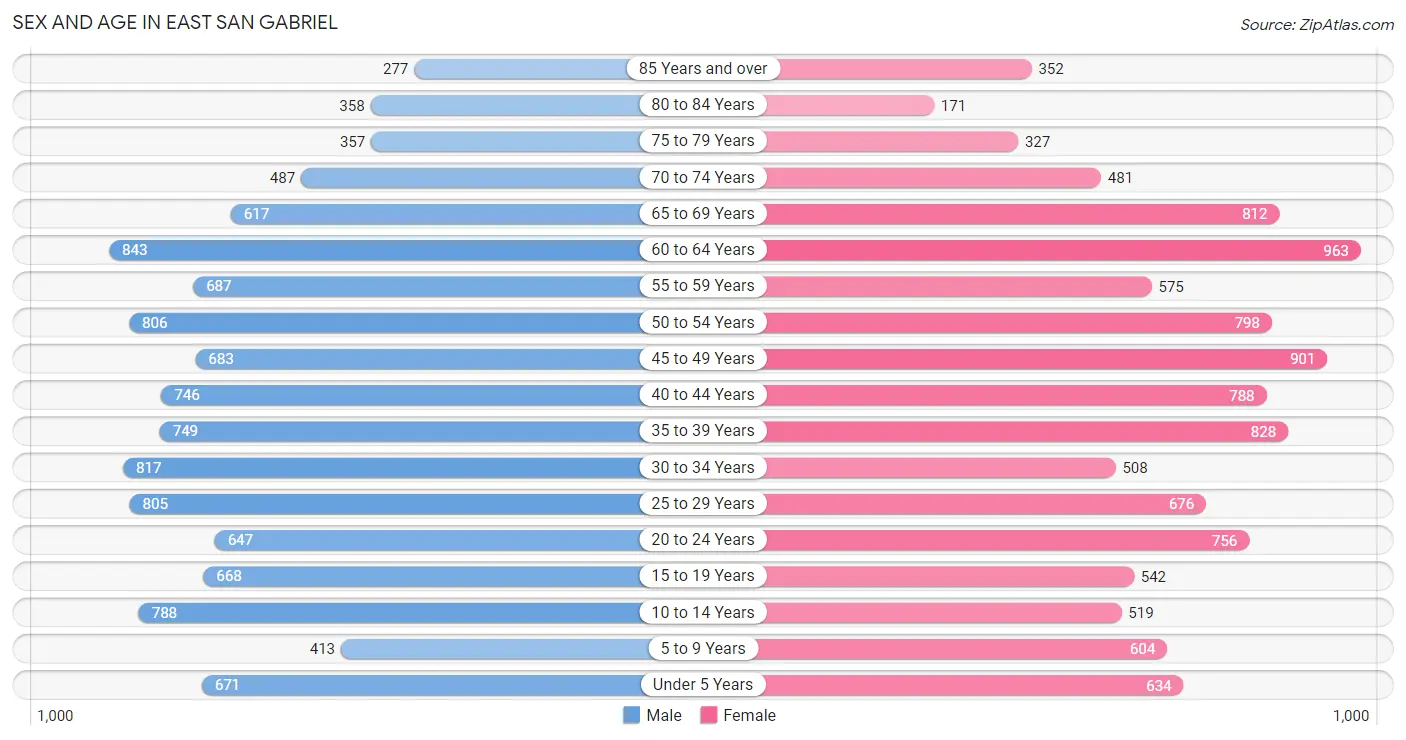
Sex and Age in East San Gabriel
Sex and Age in East San Gabriel
The most populous age groups in East San Gabriel are 60 to 64 Years (843 | 7.4%) for men and 60 to 64 Years (963 | 8.6%) for women.
| Age Bracket | Male | Female |
| Under 5 Years | 671 (5.9%) | 634 (5.6%) |
| 5 to 9 Years | 413 (3.6%) | 604 (5.4%) |
| 10 to 14 Years | 788 (6.9%) | 519 (4.6%) |
| 15 to 19 Years | 668 (5.9%) | 542 (4.8%) |
| 20 to 24 Years | 647 (5.7%) | 756 (6.7%) |
| 25 to 29 Years | 805 (7.0%) | 676 (6.0%) |
| 30 to 34 Years | 817 (7.1%) | 508 (4.5%) |
| 35 to 39 Years | 749 (6.6%) | 828 (7.4%) |
| 40 to 44 Years | 746 (6.5%) | 788 (7.0%) |
| 45 to 49 Years | 683 (6.0%) | 901 (8.0%) |
| 50 to 54 Years | 806 (7.1%) | 798 (7.1%) |
| 55 to 59 Years | 687 (6.0%) | 575 (5.1%) |
| 60 to 64 Years | 843 (7.4%) | 963 (8.6%) |
| 65 to 69 Years | 617 (5.4%) | 812 (7.2%) |
| 70 to 74 Years | 487 (4.3%) | 481 (4.3%) |
| 75 to 79 Years | 357 (3.1%) | 327 (2.9%) |
| 80 to 84 Years | 358 (3.1%) | 171 (1.5%) |
| 85 Years and over | 277 (2.4%) | 352 (3.1%) |
| Total | 11,419 (100.0%) | 11,235 (100.0%) |
Families and Households in East San Gabriel
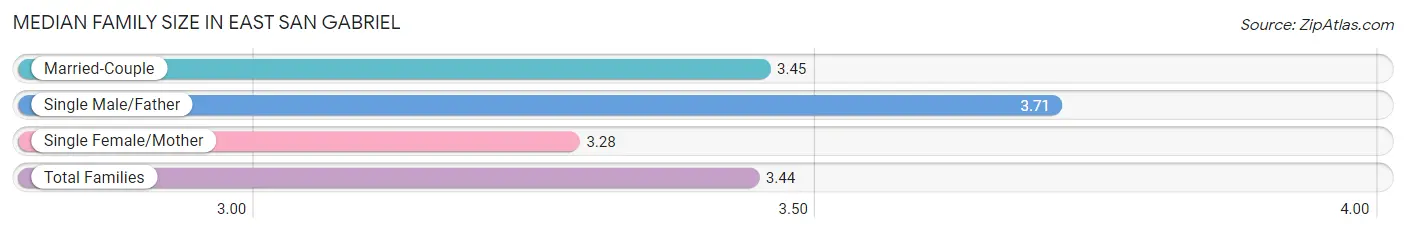
Median Family Size in East San Gabriel
The median family size in East San Gabriel is 3.44 persons per family, with single male/father families (522 | 9.5%) accounting for the largest median family size of 3.71 persons per family. On the other hand, single female/mother families (994 | 18.1%) represent the smallest median family size with 3.28 persons per family.
| Family Type | # Families | Family Size |
| Married-Couple | 3,983 (72.4%) | 3.45 |
| Single Male/Father | 522 (9.5%) | 3.71 |
| Single Female/Mother | 994 (18.1%) | 3.28 |
| Total Families | 5,499 (100.0%) | 3.44 |
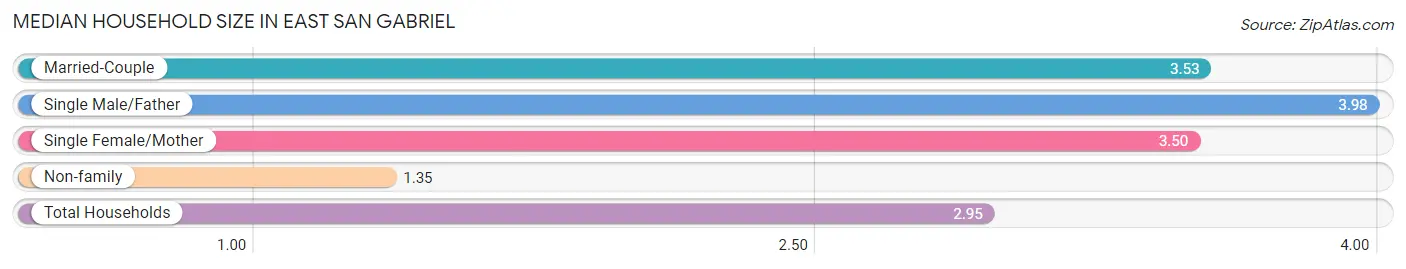
Median Household Size in East San Gabriel
The median household size in East San Gabriel is 2.95 persons per household, with single male/father households (522 | 6.8%) accounting for the largest median household size of 3.98 persons per household. non-family households (2,139 | 28.0%) represent the smallest median household size with 1.35 persons per household.
| Household Type | # Households | Household Size |
| Married-Couple | 3,983 (52.1%) | 3.53 |
| Single Male/Father | 522 (6.8%) | 3.98 |
| Single Female/Mother | 994 (13.0%) | 3.50 |
| Non-family | 2,139 (28.0%) | 1.35 |
| Total Households | 7,638 (100.0%) | 2.95 |
Household Size by Marriage Status in East San Gabriel
Out of a total of 7,638 households in East San Gabriel, 5,499 (72.0%) are family households, while 2,139 (28.0%) are nonfamily households. The most numerous type of family households are 2-person households, comprising 1,789, and the most common type of nonfamily households are 1-person households, comprising 1,592.
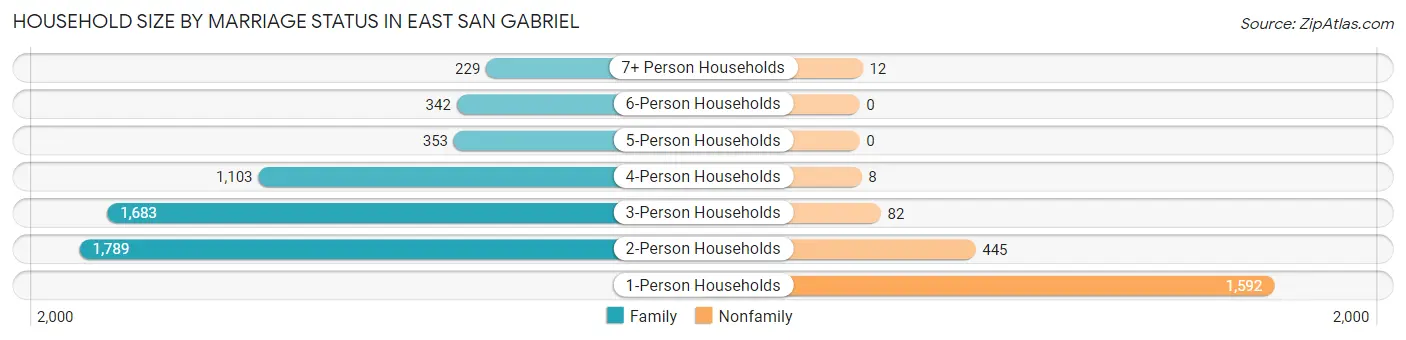
| Household Size | Family Households | Nonfamily Households |
| 1-Person Households | - | 1,592 (20.8%) |
| 2-Person Households | 1,789 (23.4%) | 445 (5.8%) |
| 3-Person Households | 1,683 (22.0%) | 82 (1.1%) |
| 4-Person Households | 1,103 (14.4%) | 8 (0.1%) |
| 5-Person Households | 353 (4.6%) | 0 (0.0%) |
| 6-Person Households | 342 (4.5%) | 0 (0.0%) |
| 7+ Person Households | 229 (3.0%) | 12 (0.2%) |
| Total | 5,499 (72.0%) | 2,139 (28.0%) |
Female Fertility in East San Gabriel
Fertility by Age in East San Gabriel
Average fertility rate in East San Gabriel is 45.0 births per 1,000 women. Women in the age bracket of 35 to 50 years have the highest fertility rate with 55.0 births per 1,000 women. Women in the age bracket of 35 to 50 years acount for 63.8% of all women with births.
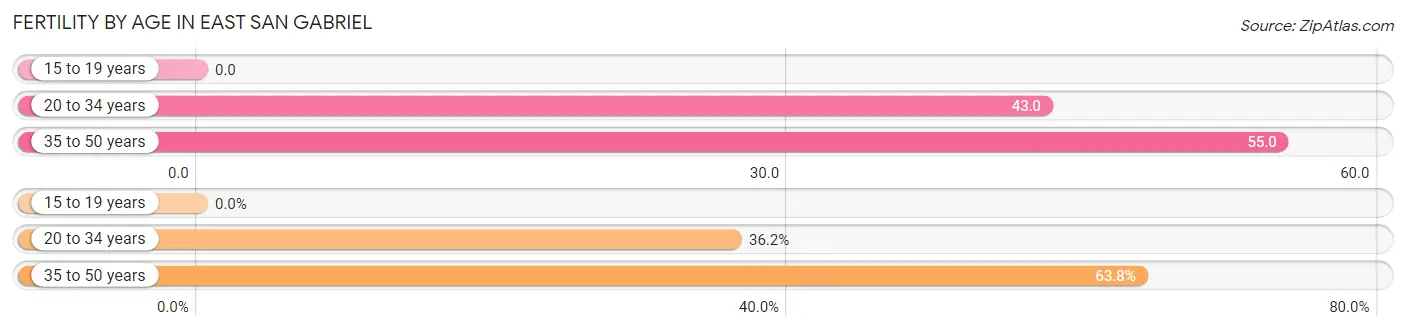
| Age Bracket | Women with Births | Births / 1,000 Women |
| 15 to 19 years | 0 (0.0%) | 0.0 |
| 20 to 34 years | 83 (36.2%) | 43.0 |
| 35 to 50 years | 146 (63.8%) | 55.0 |
| Total | 229 (100.0%) | 45.0 |
Fertility by Age by Marriage Status in East San Gabriel
91.3% of women with births (229) in East San Gabriel are married. The highest percentage of unmarried women with births falls into 20 to 34 years age bracket with 24.1% of them unmarried at the time of birth, while the lowest percentage of unmarried women with births belong to 35 to 50 years age bracket with 0.0% of them unmarried.
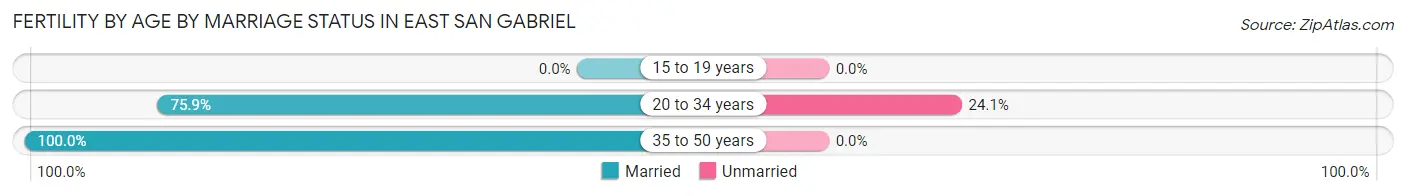
| Age Bracket | Married | Unmarried |
| 15 to 19 years | 0 (0.0%) | 0 (0.0%) |
| 20 to 34 years | 63 (75.9%) | 20 (24.1%) |
| 35 to 50 years | 146 (100.0%) | 0 (0.0%) |
| Total | 209 (91.3%) | 20 (8.7%) |
Fertility by Education in East San Gabriel
Average fertility rate in East San Gabriel is 45.0 births per 1,000 women. Women with the education attainment of graduate degree have the highest fertility rate of 72.0 births per 1,000 women, while women with the education attainment of high school diploma have the lowest fertility at 14.0 births per 1,000 women. Women with the education attainment of college or associate's degree represent 36.7% of all women with births.
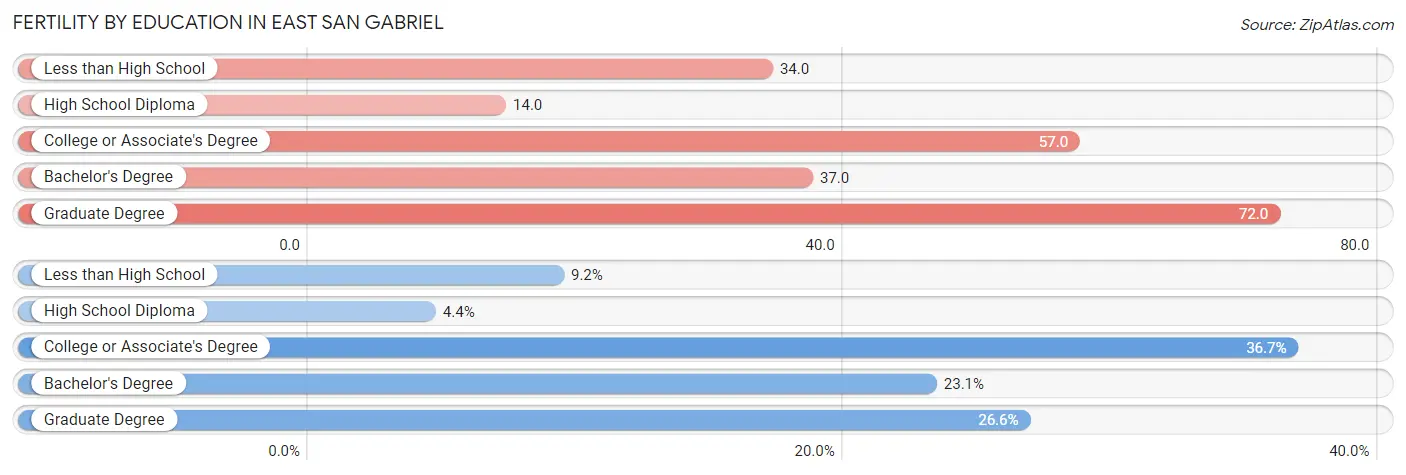
| Educational Attainment | Women with Births | Births / 1,000 Women |
| Less than High School | 21 (9.2%) | 34.0 |
| High School Diploma | 10 (4.4%) | 14.0 |
| College or Associate's Degree | 84 (36.7%) | 57.0 |
| Bachelor's Degree | 53 (23.1%) | 37.0 |
| Graduate Degree | 61 (26.6%) | 72.0 |
| Total | 229 (100.0%) | 45.0 |
Fertility by Education by Marriage Status in East San Gabriel
8.7% of women with births in East San Gabriel are unmarried. Women with the educational attainment of less than high school are most likely to be married with 100.0% of them married at childbirth, while women with the educational attainment of high school diploma are least likely to be married with 100.0% of them unmarried at childbirth.
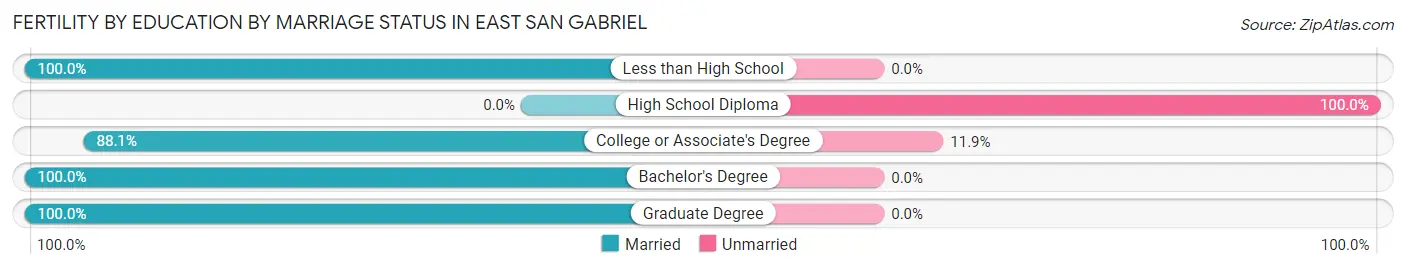
| Educational Attainment | Married | Unmarried |
| Less than High School | 21 (100.0%) | 0 (0.0%) |
| High School Diploma | 0 (0.0%) | 10 (100.0%) |
| College or Associate's Degree | 74 (88.1%) | 10 (11.9%) |
| Bachelor's Degree | 53 (100.0%) | 0 (0.0%) |
| Graduate Degree | 61 (100.0%) | 0 (0.0%) |
| Total | 209 (91.3%) | 20 (8.7%) |
Employment Characteristics in East San Gabriel
Employment by Class of Employer in East San Gabriel
Among the 10,617 employed individuals in East San Gabriel, private company employees (6,757 | 63.6%), local government employees (1,362 | 12.8%), and not-for-profit organizations (711 | 6.7%) make up the most common classes of employment.
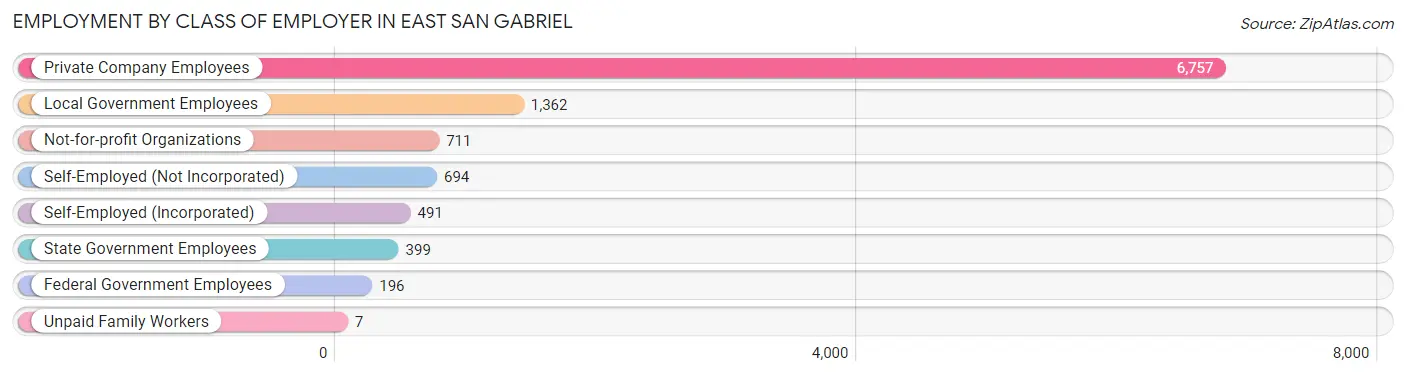
| Employer Class | # Employees | % Employees |
| Private Company Employees | 6,757 | 63.6% |
| Self-Employed (Incorporated) | 491 | 4.6% |
| Self-Employed (Not Incorporated) | 694 | 6.5% |
| Not-for-profit Organizations | 711 | 6.7% |
| Local Government Employees | 1,362 | 12.8% |
| State Government Employees | 399 | 3.8% |
| Federal Government Employees | 196 | 1.8% |
| Unpaid Family Workers | 7 | 0.1% |
| Total | 10,617 | 100.0% |
Employment Status by Age in East San Gabriel
According to the labor force statistics for East San Gabriel, out of the total population over 16 years of age (18,727), 63.1% or 11,817 individuals are in the labor force, with 7.4% or 874 of them unemployed. The age group with the highest labor force participation rate is 30 to 34 years, with 92.2% or 1,222 individuals in the labor force. Within the labor force, the 60 to 64 years age range has the highest percentage of unemployed individuals, with 13.2% or 148 of them being unemployed.
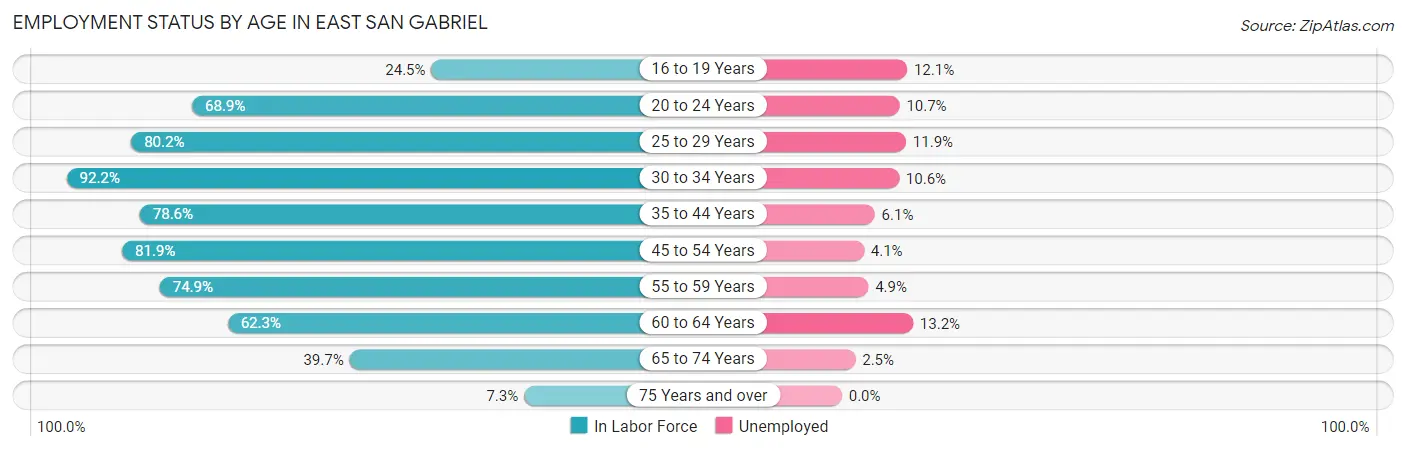
| Age Bracket | In Labor Force | Unemployed |
| 16 to 19 Years | 223 (24.5%) | 27 (12.1%) |
| 20 to 24 Years | 967 (68.9%) | 103 (10.7%) |
| 25 to 29 Years | 1,188 (80.2%) | 141 (11.9%) |
| 30 to 34 Years | 1,222 (92.2%) | 130 (10.6%) |
| 35 to 44 Years | 2,445 (78.6%) | 149 (6.1%) |
| 45 to 54 Years | 2,611 (81.9%) | 107 (4.1%) |
| 55 to 59 Years | 945 (74.9%) | 46 (4.9%) |
| 60 to 64 Years | 1,125 (62.3%) | 148 (13.2%) |
| 65 to 74 Years | 952 (39.7%) | 24 (2.5%) |
| 75 Years and over | 134 (7.3%) | 0 (0.0%) |
| Total | 11,817 (63.1%) | 874 (7.4%) |
Employment Status by Educational Attainment in East San Gabriel
According to labor force statistics for East San Gabriel, 78.3% of individuals (9,531) out of the total population between 25 and 64 years of age (12,173) are in the labor force, with 7.6% or 724 of them being unemployed. The group with the highest labor force participation rate are those with the educational attainment of bachelor's degree or higher, with 83.4% or 4,751 individuals in the labor force. Within the labor force, individuals with high school diploma education have the highest percentage of unemployment, with 15.0% or 197 of them being unemployed.
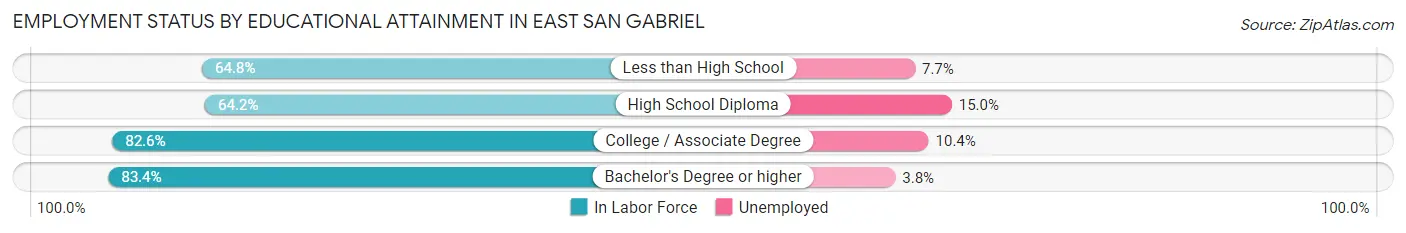
| Educational Attainment | In Labor Force | Unemployed |
| Less than High School | 674 (64.8%) | 80 (7.7%) |
| High School Diploma | 1,315 (64.2%) | 307 (15.0%) |
| College / Associate Degree | 2,798 (82.6%) | 352 (10.4%) |
| Bachelor's Degree or higher | 4,751 (83.4%) | 216 (3.8%) |
| Total | 9,531 (78.3%) | 925 (7.6%) |
Employment Occupations by Sex in East San Gabriel
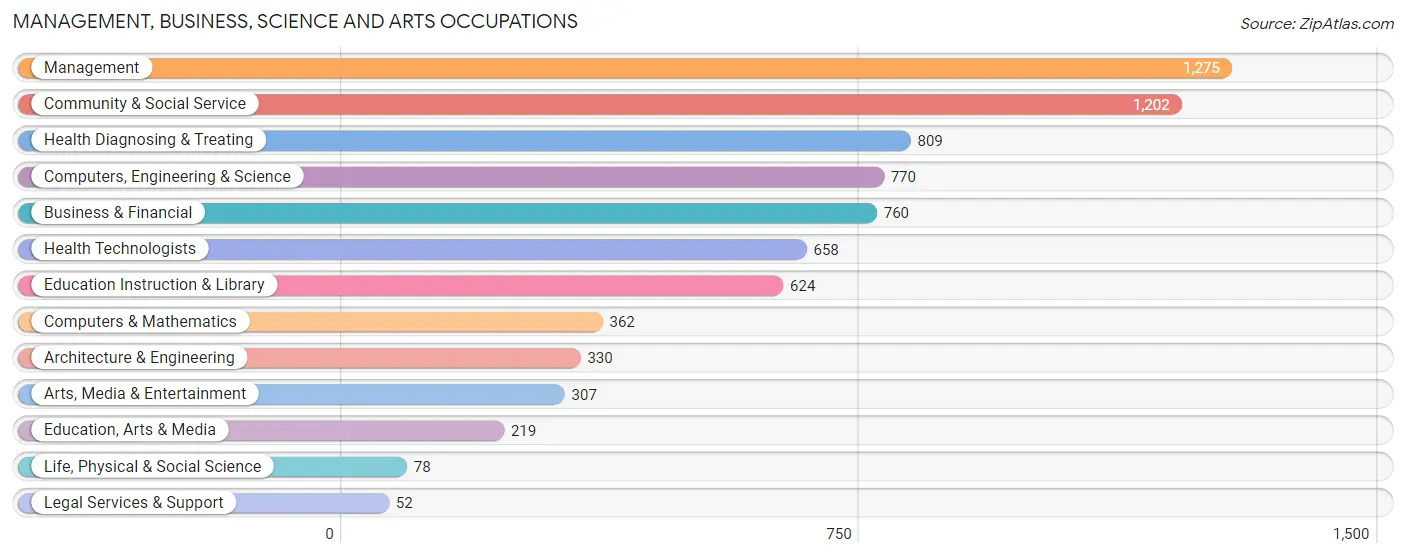
Management, Business, Science and Arts Occupations
The most common Management, Business, Science and Arts occupations in East San Gabriel are Management (1,275 | 11.7%), Community & Social Service (1,202 | 11.0%), Health Diagnosing & Treating (809 | 7.4%), Computers, Engineering & Science (770 | 7.0%), and Business & Financial (760 | 7.0%).
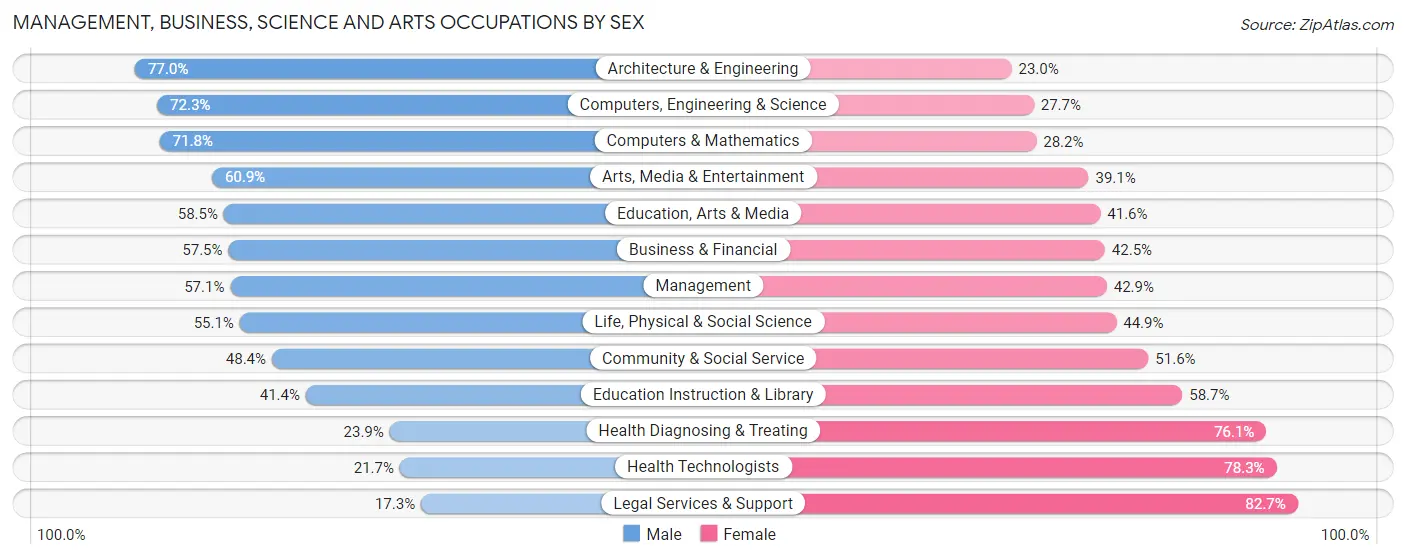
Management, Business, Science and Arts Occupations by Sex
Within the Management, Business, Science and Arts occupations in East San Gabriel, the most male-oriented occupations are Architecture & Engineering (77.0%), Computers, Engineering & Science (72.3%), and Computers & Mathematics (71.8%), while the most female-oriented occupations are Legal Services & Support (82.7%), Health Technologists (78.3%), and Health Diagnosing & Treating (76.1%).
| Occupation | Male | Female |
| Management | 728 (57.1%) | 547 (42.9%) |
| Business & Financial | 437 (57.5%) | 323 (42.5%) |
| Computers, Engineering & Science | 557 (72.3%) | 213 (27.7%) |
| Computers & Mathematics | 260 (71.8%) | 102 (28.2%) |
| Architecture & Engineering | 254 (77.0%) | 76 (23.0%) |
| Life, Physical & Social Science | 43 (55.1%) | 35 (44.9%) |
| Community & Social Service | 582 (48.4%) | 620 (51.6%) |
| Education, Arts & Media | 128 (58.5%) | 91 (41.5%) |
| Legal Services & Support | 9 (17.3%) | 43 (82.7%) |
| Education Instruction & Library | 258 (41.3%) | 366 (58.7%) |
| Arts, Media & Entertainment | 187 (60.9%) | 120 (39.1%) |
| Health Diagnosing & Treating | 193 (23.9%) | 616 (76.1%) |
| Health Technologists | 143 (21.7%) | 515 (78.3%) |
| Total (Category) | 2,497 (51.8%) | 2,319 (48.1%) |
| Total (Overall) | 5,781 (52.9%) | 5,148 (47.1%) |
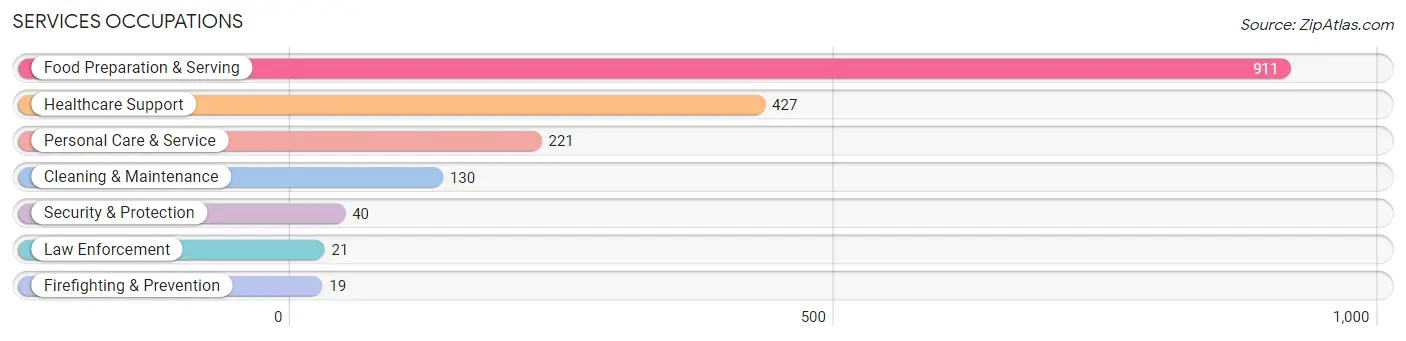
Services Occupations
The most common Services occupations in East San Gabriel are Food Preparation & Serving (911 | 8.3%), Healthcare Support (427 | 3.9%), Personal Care & Service (221 | 2.0%), Cleaning & Maintenance (130 | 1.2%), and Security & Protection (40 | 0.4%).
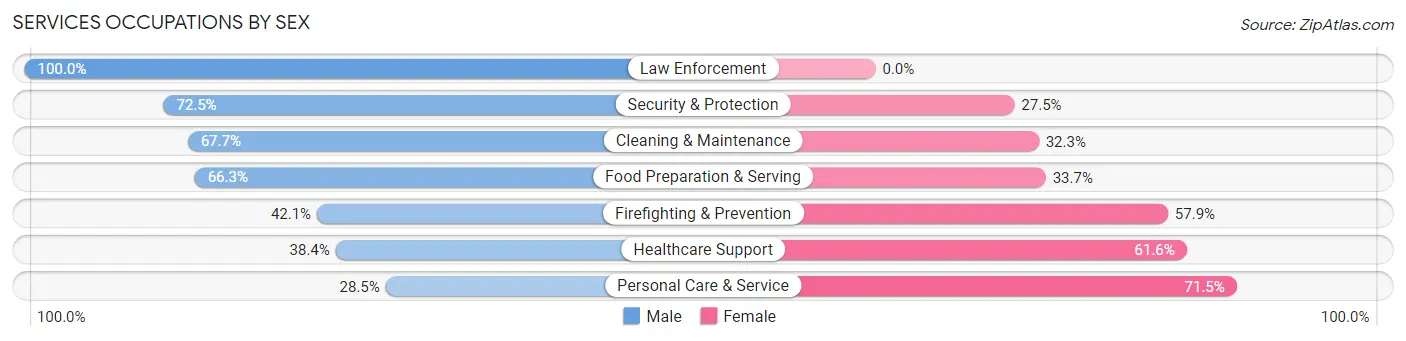
Services Occupations by Sex
Within the Services occupations in East San Gabriel, the most male-oriented occupations are Law Enforcement (100.0%), Security & Protection (72.5%), and Cleaning & Maintenance (67.7%), while the most female-oriented occupations are Personal Care & Service (71.5%), Healthcare Support (61.6%), and Firefighting & Prevention (57.9%).
| Occupation | Male | Female |
| Healthcare Support | 164 (38.4%) | 263 (61.6%) |
| Security & Protection | 29 (72.5%) | 11 (27.5%) |
| Firefighting & Prevention | 8 (42.1%) | 11 (57.9%) |
| Law Enforcement | 21 (100.0%) | 0 (0.0%) |
| Food Preparation & Serving | 604 (66.3%) | 307 (33.7%) |
| Cleaning & Maintenance | 88 (67.7%) | 42 (32.3%) |
| Personal Care & Service | 63 (28.5%) | 158 (71.5%) |
| Total (Category) | 948 (54.8%) | 781 (45.2%) |
| Total (Overall) | 5,781 (52.9%) | 5,148 (47.1%) |
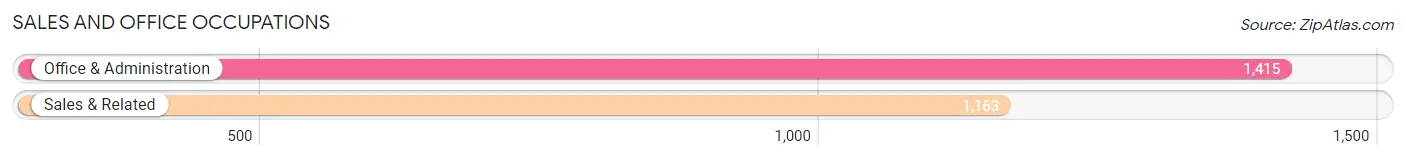
Sales and Office Occupations
The most common Sales and Office occupations in East San Gabriel are Office & Administration (1,415 | 13.0%), and Sales & Related (1,163 | 10.6%).
Sales and Office Occupations by Sex
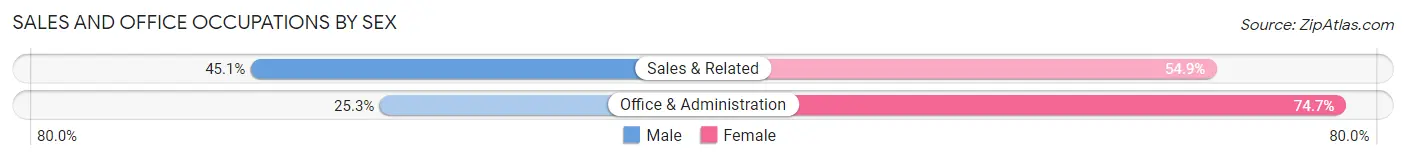
| Occupation | Male | Female |
| Sales & Related | 525 (45.1%) | 638 (54.9%) |
| Office & Administration | 358 (25.3%) | 1,057 (74.7%) |
| Total (Category) | 883 (34.3%) | 1,695 (65.7%) |
| Total (Overall) | 5,781 (52.9%) | 5,148 (47.1%) |
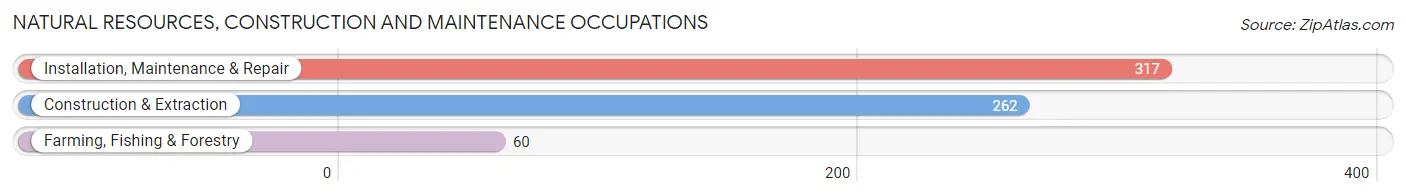
Natural Resources, Construction and Maintenance Occupations
The most common Natural Resources, Construction and Maintenance occupations in East San Gabriel are Installation, Maintenance & Repair (317 | 2.9%), Construction & Extraction (262 | 2.4%), and Farming, Fishing & Forestry (60 | 0.5%).
Natural Resources, Construction and Maintenance Occupations by Sex
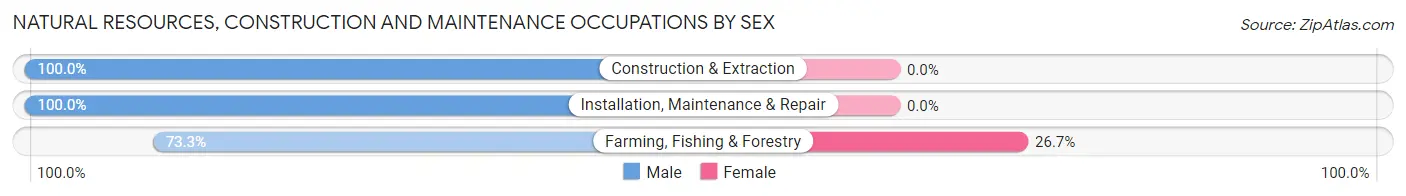
| Occupation | Male | Female |
| Farming, Fishing & Forestry | 44 (73.3%) | 16 (26.7%) |
| Construction & Extraction | 262 (100.0%) | 0 (0.0%) |
| Installation, Maintenance & Repair | 317 (100.0%) | 0 (0.0%) |
| Total (Category) | 623 (97.5%) | 16 (2.5%) |
| Total (Overall) | 5,781 (52.9%) | 5,148 (47.1%) |
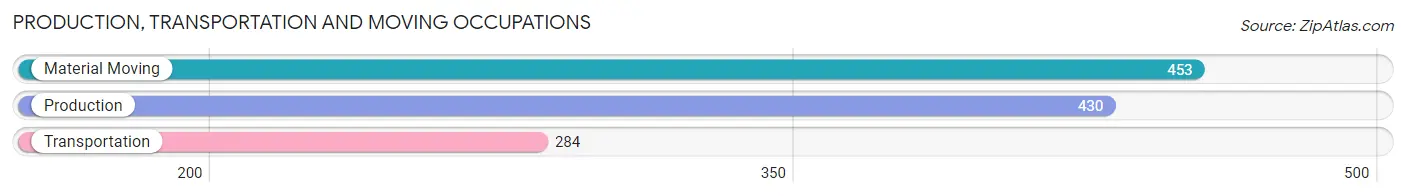
Production, Transportation and Moving Occupations
The most common Production, Transportation and Moving occupations in East San Gabriel are Material Moving (453 | 4.1%), Production (430 | 3.9%), and Transportation (284 | 2.6%).
Production, Transportation and Moving Occupations by Sex
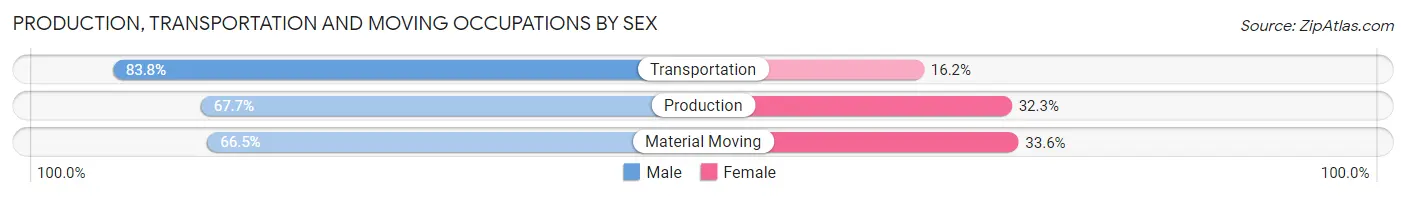
| Occupation | Male | Female |
| Production | 291 (67.7%) | 139 (32.3%) |
| Transportation | 238 (83.8%) | 46 (16.2%) |
| Material Moving | 301 (66.4%) | 152 (33.6%) |
| Total (Category) | 830 (71.1%) | 337 (28.9%) |
| Total (Overall) | 5,781 (52.9%) | 5,148 (47.1%) |
Employment Industries by Sex in East San Gabriel
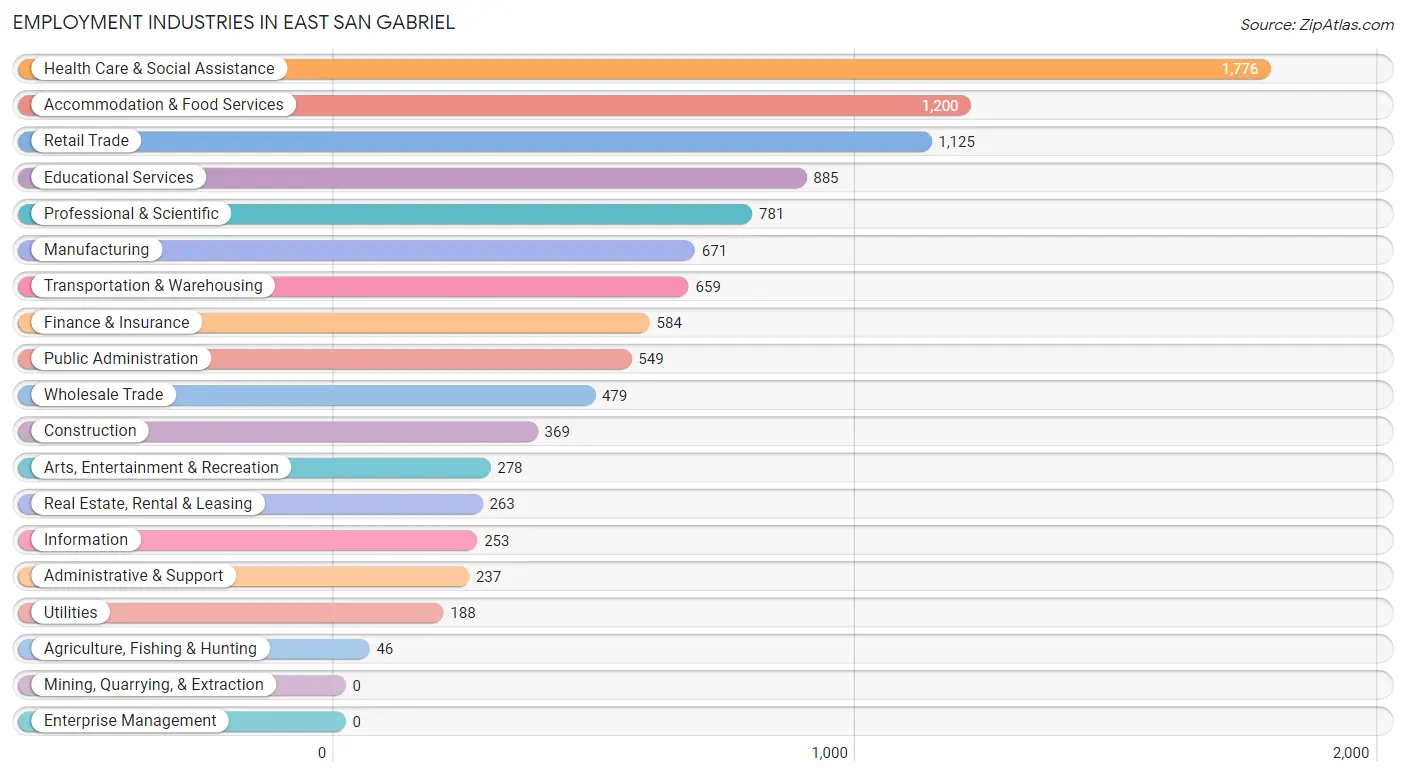
Employment Industries in East San Gabriel
The major employment industries in East San Gabriel include Health Care & Social Assistance (1,776 | 16.3%), Accommodation & Food Services (1,200 | 11.0%), Retail Trade (1,125 | 10.3%), Educational Services (885 | 8.1%), and Professional & Scientific (781 | 7.1%).
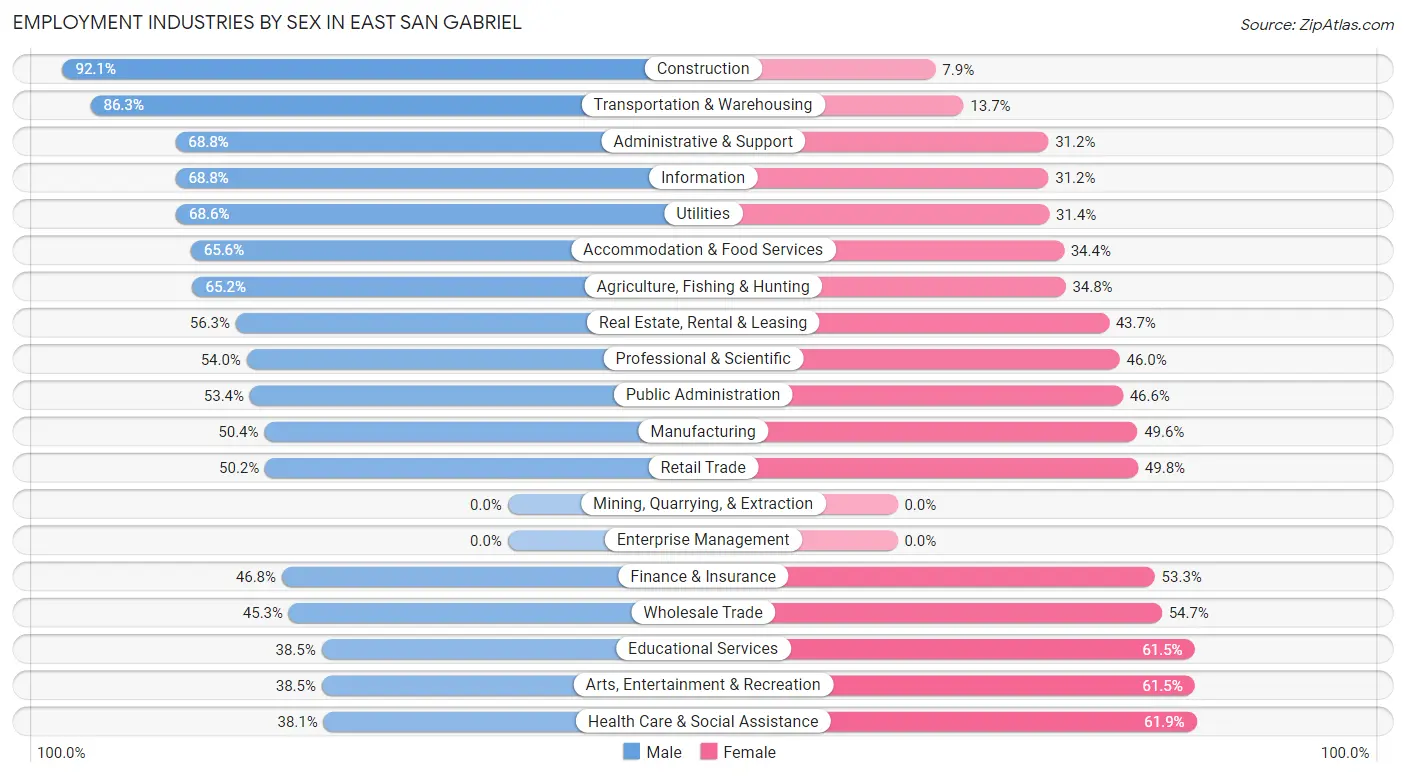
Employment Industries by Sex in East San Gabriel
The East San Gabriel industries that see more men than women are Construction (92.1%), Transportation & Warehousing (86.3%), and Administrative & Support (68.8%), whereas the industries that tend to have a higher number of women are Health Care & Social Assistance (61.9%), Arts, Entertainment & Recreation (61.5%), and Educational Services (61.5%).
| Industry | Male | Female |
| Agriculture, Fishing & Hunting | 30 (65.2%) | 16 (34.8%) |
| Mining, Quarrying, & Extraction | 0 (0.0%) | 0 (0.0%) |
| Construction | 340 (92.1%) | 29 (7.9%) |
| Manufacturing | 338 (50.4%) | 333 (49.6%) |
| Wholesale Trade | 217 (45.3%) | 262 (54.7%) |
| Retail Trade | 565 (50.2%) | 560 (49.8%) |
| Transportation & Warehousing | 569 (86.3%) | 90 (13.7%) |
| Utilities | 129 (68.6%) | 59 (31.4%) |
| Information | 174 (68.8%) | 79 (31.2%) |
| Finance & Insurance | 273 (46.8%) | 311 (53.2%) |
| Real Estate, Rental & Leasing | 148 (56.3%) | 115 (43.7%) |
| Professional & Scientific | 422 (54.0%) | 359 (46.0%) |
| Enterprise Management | 0 (0.0%) | 0 (0.0%) |
| Administrative & Support | 163 (68.8%) | 74 (31.2%) |
| Educational Services | 341 (38.5%) | 544 (61.5%) |
| Health Care & Social Assistance | 677 (38.1%) | 1,099 (61.9%) |
| Arts, Entertainment & Recreation | 107 (38.5%) | 171 (61.5%) |
| Accommodation & Food Services | 787 (65.6%) | 413 (34.4%) |
| Public Administration | 293 (53.4%) | 256 (46.6%) |
| Total | 5,781 (52.9%) | 5,148 (47.1%) |
Education in East San Gabriel
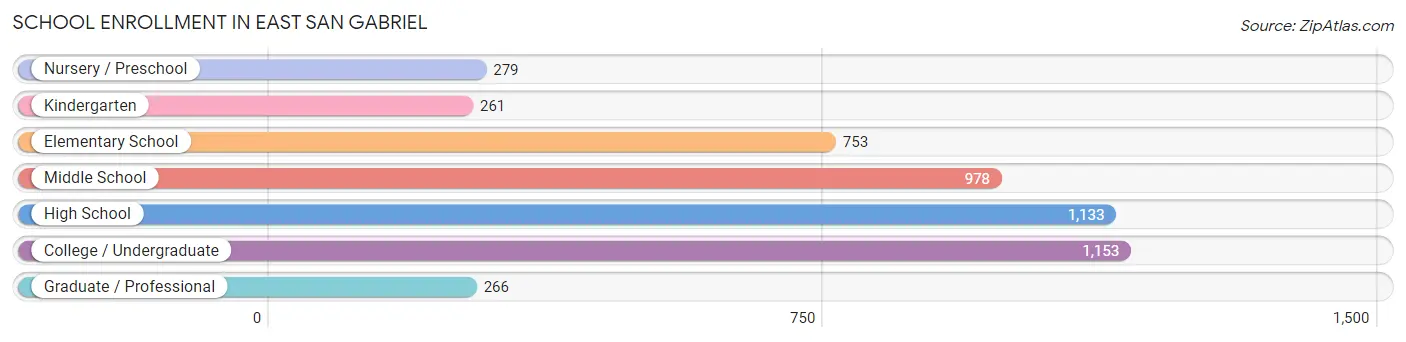
School Enrollment in East San Gabriel
The most common levels of schooling among the 4,823 students in East San Gabriel are college / undergraduate (1,153 | 23.9%), high school (1,133 | 23.5%), and middle school (978 | 20.3%).
| School Level | # Students | % Students |
| Nursery / Preschool | 279 | 5.8% |
| Kindergarten | 261 | 5.4% |
| Elementary School | 753 | 15.6% |
| Middle School | 978 | 20.3% |
| High School | 1,133 | 23.5% |
| College / Undergraduate | 1,153 | 23.9% |
| Graduate / Professional | 266 | 5.5% |
| Total | 4,823 | 100.0% |
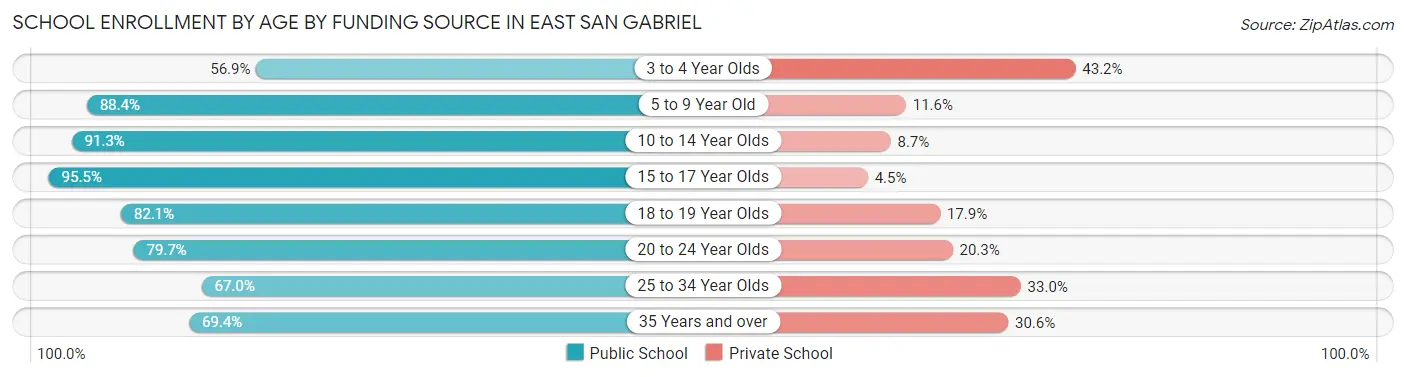
School Enrollment by Age by Funding Source in East San Gabriel
Out of a total of 4,823 students who are enrolled in schools in East San Gabriel, 719 (14.9%) attend a private institution, while the remaining 4,104 (85.1%) are enrolled in public schools. The age group of 3 to 4 year olds has the highest likelihood of being enrolled in private schools, with 85 (43.1% in the age bracket) enrolled. Conversely, the age group of 15 to 17 year olds has the lowest likelihood of being enrolled in a private school, with 789 (95.5% in the age bracket) attending a public institution.
| Age Bracket | Public School | Private School |
| 3 to 4 Year Olds | 112 (56.9%) | 85 (43.1%) |
| 5 to 9 Year Old | 887 (88.4%) | 116 (11.6%) |
| 10 to 14 Year Olds | 1,171 (91.3%) | 112 (8.7%) |
| 15 to 17 Year Olds | 789 (95.5%) | 37 (4.5%) |
| 18 to 19 Year Olds | 183 (82.1%) | 40 (17.9%) |
| 20 to 24 Year Olds | 570 (79.7%) | 145 (20.3%) |
| 25 to 34 Year Olds | 246 (67.0%) | 121 (33.0%) |
| 35 Years and over | 145 (69.4%) | 64 (30.6%) |
| Total | 4,104 (85.1%) | 719 (14.9%) |
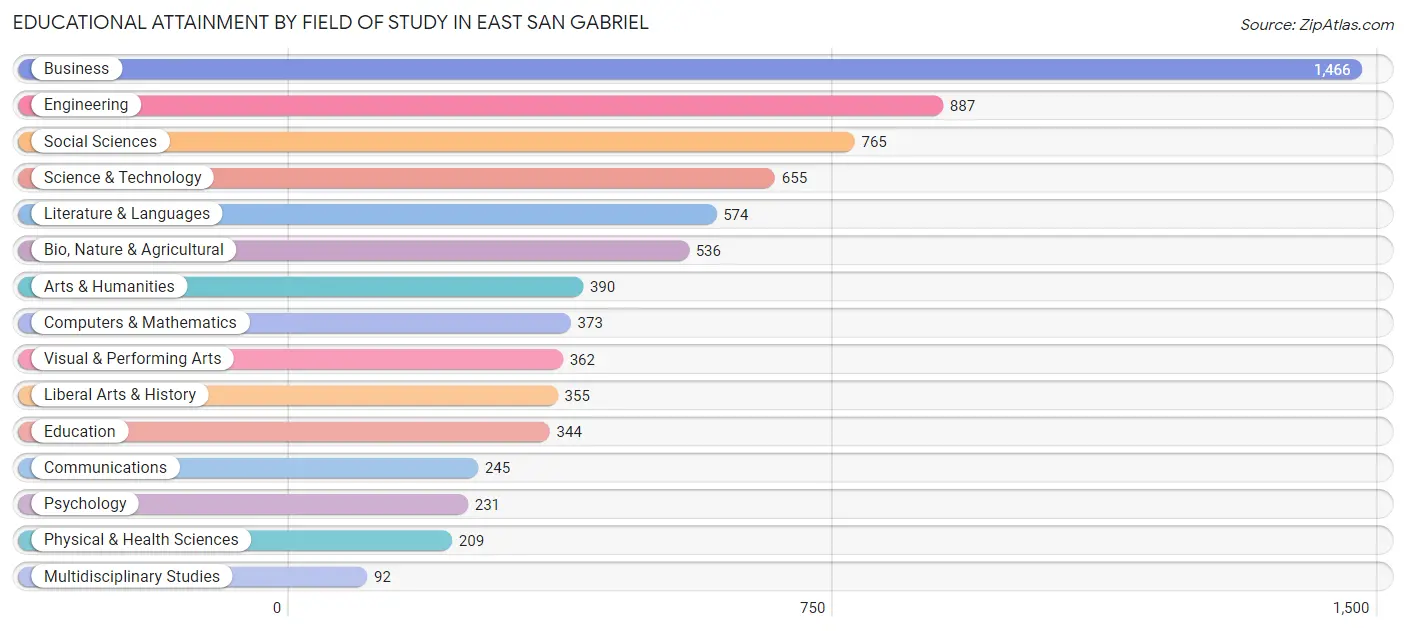
Educational Attainment by Field of Study in East San Gabriel
Business (1,466 | 19.6%), engineering (887 | 11.8%), social sciences (765 | 10.2%), science & technology (655 | 8.7%), and literature & languages (574 | 7.7%) are the most common fields of study among 7,484 individuals in East San Gabriel who have obtained a bachelor's degree or higher.
| Field of Study | # Graduates | % Graduates |
| Computers & Mathematics | 373 | 5.0% |
| Bio, Nature & Agricultural | 536 | 7.2% |
| Physical & Health Sciences | 209 | 2.8% |
| Psychology | 231 | 3.1% |
| Social Sciences | 765 | 10.2% |
| Engineering | 887 | 11.8% |
| Multidisciplinary Studies | 92 | 1.2% |
| Science & Technology | 655 | 8.7% |
| Business | 1,466 | 19.6% |
| Education | 344 | 4.6% |
| Literature & Languages | 574 | 7.7% |
| Liberal Arts & History | 355 | 4.7% |
| Visual & Performing Arts | 362 | 4.8% |
| Communications | 245 | 3.3% |
| Arts & Humanities | 390 | 5.2% |
| Total | 7,484 | 100.0% |
Transportation & Commute in East San Gabriel
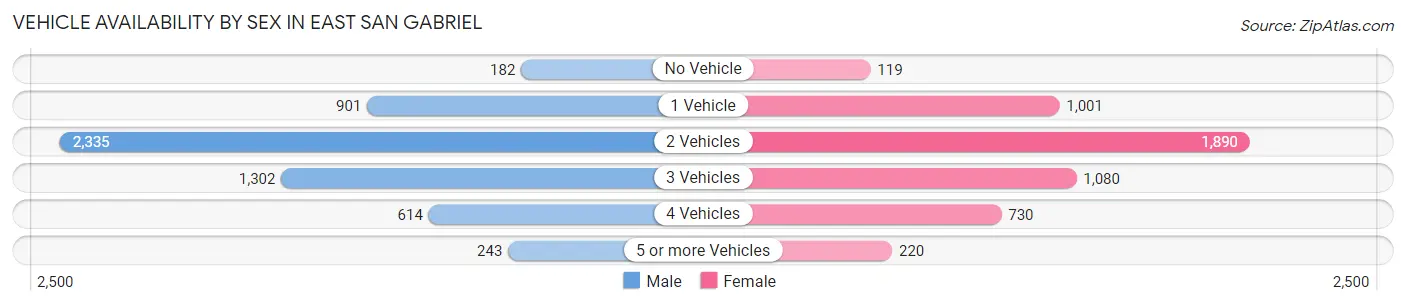
Vehicle Availability by Sex in East San Gabriel
The most prevalent vehicle ownership categories in East San Gabriel are males with 2 vehicles (2,335, accounting for 41.9%) and females with 2 vehicles (1,890, making up 46.3%).
| Vehicles Available | Male | Female |
| No Vehicle | 182 (3.3%) | 119 (2.4%) |
| 1 Vehicle | 901 (16.2%) | 1,001 (19.9%) |
| 2 Vehicles | 2,335 (41.9%) | 1,890 (37.5%) |
| 3 Vehicles | 1,302 (23.4%) | 1,080 (21.4%) |
| 4 Vehicles | 614 (11.0%) | 730 (14.5%) |
| 5 or more Vehicles | 243 (4.4%) | 220 (4.4%) |
| Total | 5,577 (100.0%) | 5,040 (100.0%) |
Commute Time in East San Gabriel
The most frequently occuring commute durations in East San Gabriel are 30 to 34 minutes (1,541 commuters, 16.7%), 15 to 19 minutes (1,433 commuters, 15.6%), and 20 to 24 minutes (1,359 commuters, 14.7%).
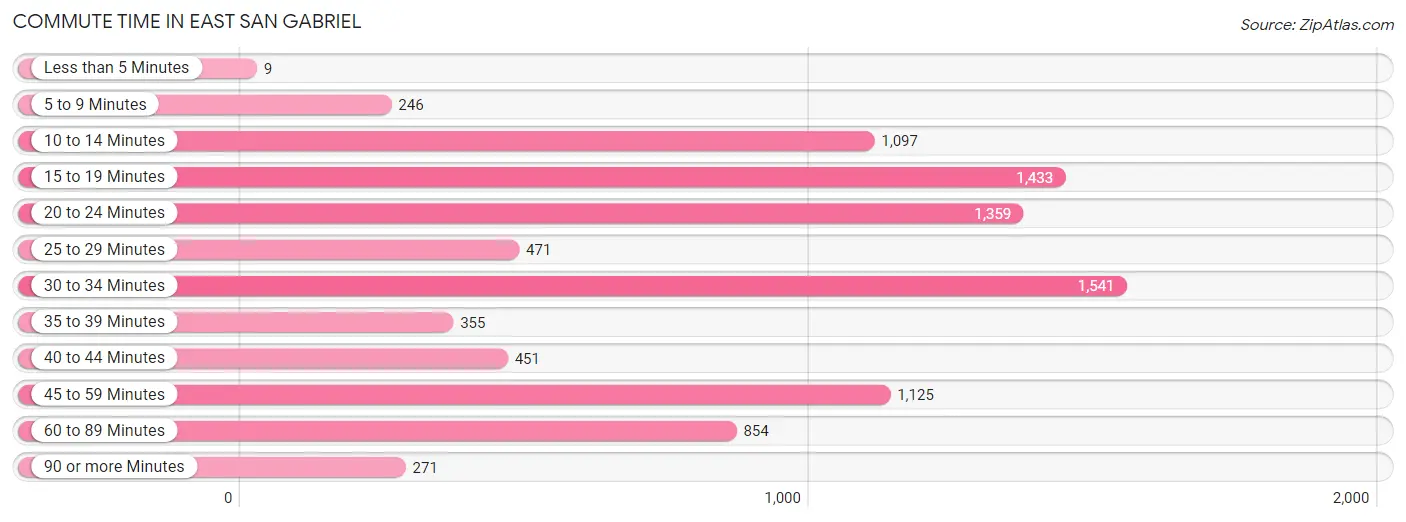
| Commute Time | # Commuters | % Commuters |
| Less than 5 Minutes | 9 | 0.1% |
| 5 to 9 Minutes | 246 | 2.7% |
| 10 to 14 Minutes | 1,097 | 11.9% |
| 15 to 19 Minutes | 1,433 | 15.6% |
| 20 to 24 Minutes | 1,359 | 14.7% |
| 25 to 29 Minutes | 471 | 5.1% |
| 30 to 34 Minutes | 1,541 | 16.7% |
| 35 to 39 Minutes | 355 | 3.8% |
| 40 to 44 Minutes | 451 | 4.9% |
| 45 to 59 Minutes | 1,125 | 12.2% |
| 60 to 89 Minutes | 854 | 9.3% |
| 90 or more Minutes | 271 | 2.9% |
Commute Time by Sex in East San Gabriel
The most common commute times in East San Gabriel are 30 to 34 minutes (942 commuters, 19.2%) for males and 15 to 19 minutes (791 commuters, 18.4%) for females.
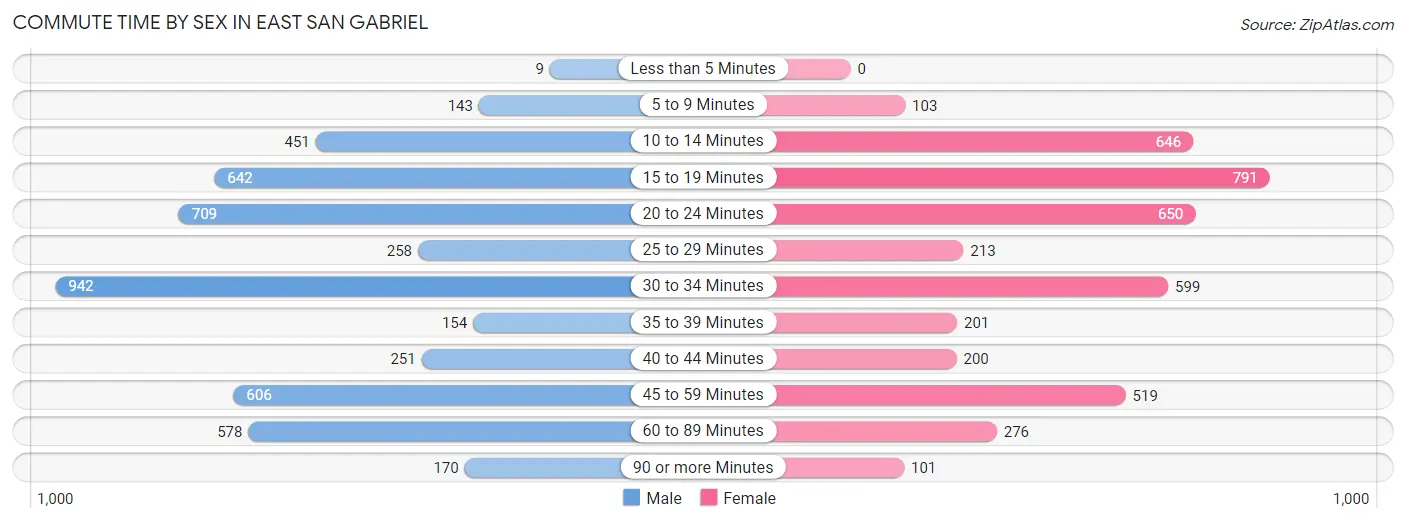
| Commute Time | Male | Female |
| Less than 5 Minutes | 9 (0.2%) | 0 (0.0%) |
| 5 to 9 Minutes | 143 (2.9%) | 103 (2.4%) |
| 10 to 14 Minutes | 451 (9.2%) | 646 (15.0%) |
| 15 to 19 Minutes | 642 (13.1%) | 791 (18.4%) |
| 20 to 24 Minutes | 709 (14.4%) | 650 (15.1%) |
| 25 to 29 Minutes | 258 (5.2%) | 213 (5.0%) |
| 30 to 34 Minutes | 942 (19.2%) | 599 (13.9%) |
| 35 to 39 Minutes | 154 (3.1%) | 201 (4.7%) |
| 40 to 44 Minutes | 251 (5.1%) | 200 (4.6%) |
| 45 to 59 Minutes | 606 (12.3%) | 519 (12.1%) |
| 60 to 89 Minutes | 578 (11.8%) | 276 (6.4%) |
| 90 or more Minutes | 170 (3.5%) | 101 (2.4%) |
Time of Departure to Work by Sex in East San Gabriel
The most frequent times of departure to work in East San Gabriel are 8:00 AM to 8:29 AM (979, 19.9%) for males and 8:30 AM to 8:59 AM (648, 15.1%) for females.
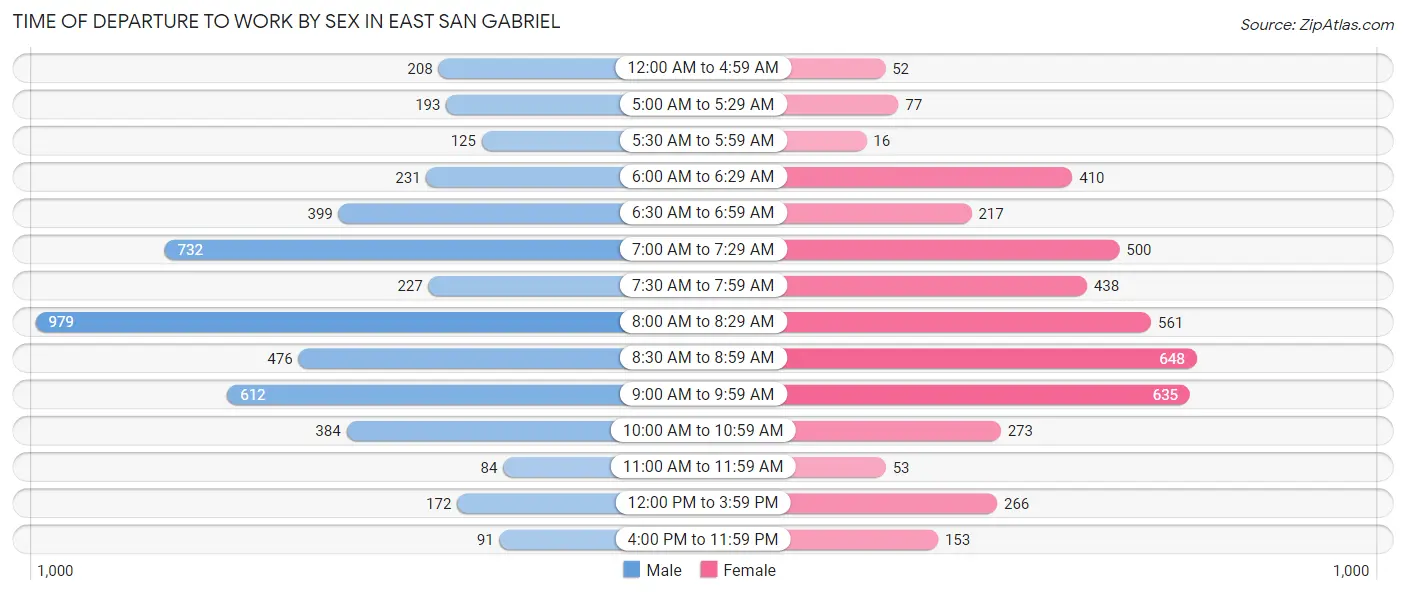
| Time of Departure | Male | Female |
| 12:00 AM to 4:59 AM | 208 (4.2%) | 52 (1.2%) |
| 5:00 AM to 5:29 AM | 193 (3.9%) | 77 (1.8%) |
| 5:30 AM to 5:59 AM | 125 (2.5%) | 16 (0.4%) |
| 6:00 AM to 6:29 AM | 231 (4.7%) | 410 (9.5%) |
| 6:30 AM to 6:59 AM | 399 (8.1%) | 217 (5.1%) |
| 7:00 AM to 7:29 AM | 732 (14.9%) | 500 (11.6%) |
| 7:30 AM to 7:59 AM | 227 (4.6%) | 438 (10.2%) |
| 8:00 AM to 8:29 AM | 979 (19.9%) | 561 (13.1%) |
| 8:30 AM to 8:59 AM | 476 (9.7%) | 648 (15.1%) |
| 9:00 AM to 9:59 AM | 612 (12.5%) | 635 (14.8%) |
| 10:00 AM to 10:59 AM | 384 (7.8%) | 273 (6.4%) |
| 11:00 AM to 11:59 AM | 84 (1.7%) | 53 (1.2%) |
| 12:00 PM to 3:59 PM | 172 (3.5%) | 266 (6.2%) |
| 4:00 PM to 11:59 PM | 91 (1.8%) | 153 (3.6%) |
| Total | 4,913 (100.0%) | 4,299 (100.0%) |
Housing Occupancy in East San Gabriel
Occupancy by Ownership in East San Gabriel
Of the total 7,638 dwellings in East San Gabriel, owner-occupied units account for 4,411 (57.8%), while renter-occupied units make up 3,227 (42.2%).
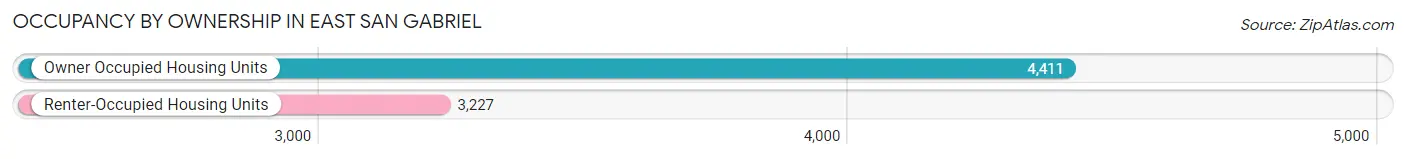
| Occupancy | # Housing Units | % Housing Units |
| Owner Occupied Housing Units | 4,411 | 57.8% |
| Renter-Occupied Housing Units | 3,227 | 42.2% |
| Total Occupied Housing Units | 7,638 | 100.0% |
Occupancy by Household Size in East San Gabriel
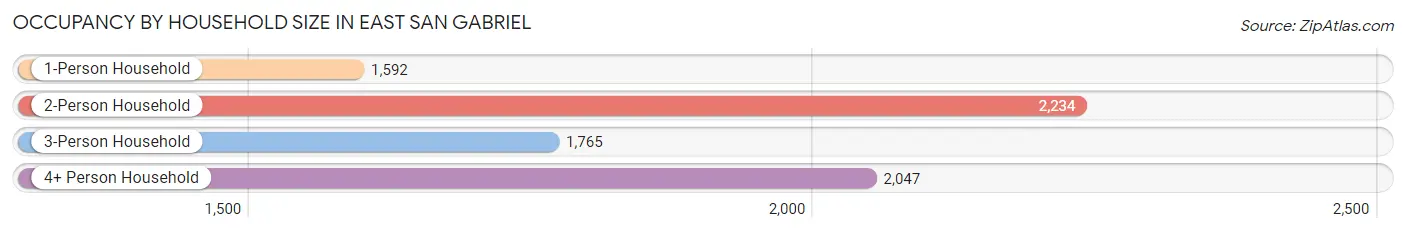
| Household Size | # Housing Units | % Housing Units |
| 1-Person Household | 1,592 | 20.8% |
| 2-Person Household | 2,234 | 29.2% |
| 3-Person Household | 1,765 | 23.1% |
| 4+ Person Household | 2,047 | 26.8% |
| Total Housing Units | 7,638 | 100.0% |
Occupancy by Ownership by Household Size in East San Gabriel
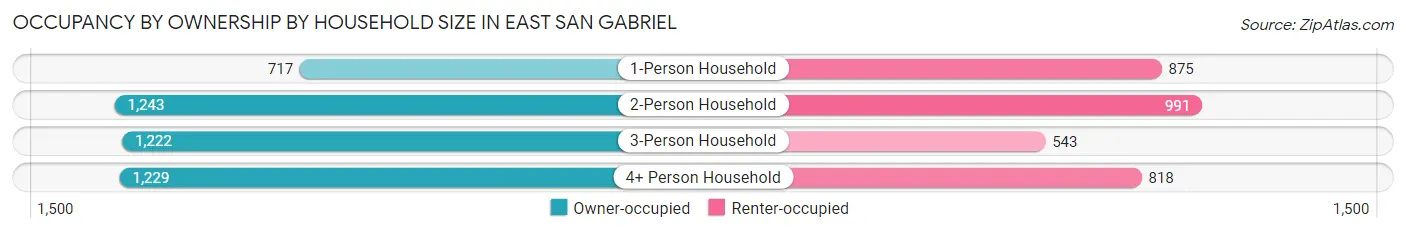
| Household Size | Owner-occupied | Renter-occupied |
| 1-Person Household | 717 (45.0%) | 875 (55.0%) |
| 2-Person Household | 1,243 (55.6%) | 991 (44.4%) |
| 3-Person Household | 1,222 (69.2%) | 543 (30.8%) |
| 4+ Person Household | 1,229 (60.0%) | 818 (40.0%) |
| Total Housing Units | 4,411 (57.8%) | 3,227 (42.2%) |
Occupancy by Educational Attainment in East San Gabriel
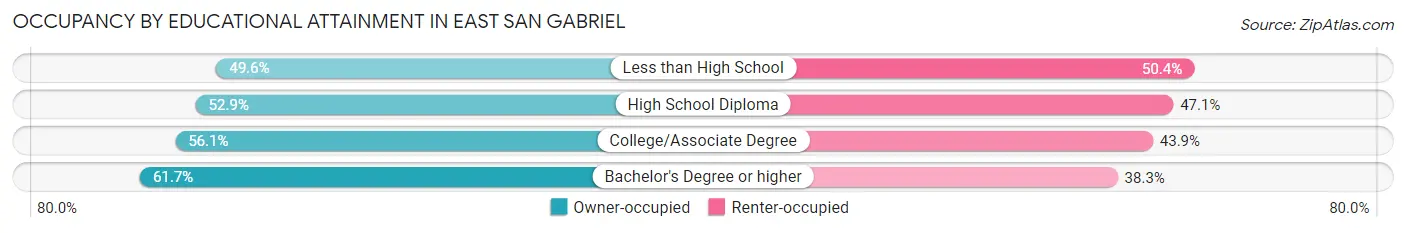
| Household Size | Owner-occupied | Renter-occupied |
| Less than High School | 425 (49.6%) | 432 (50.4%) |
| High School Diploma | 585 (52.9%) | 521 (47.1%) |
| College/Associate Degree | 1,006 (56.1%) | 787 (43.9%) |
| Bachelor's Degree or higher | 2,395 (61.7%) | 1,487 (38.3%) |
Occupancy by Age of Householder in East San Gabriel
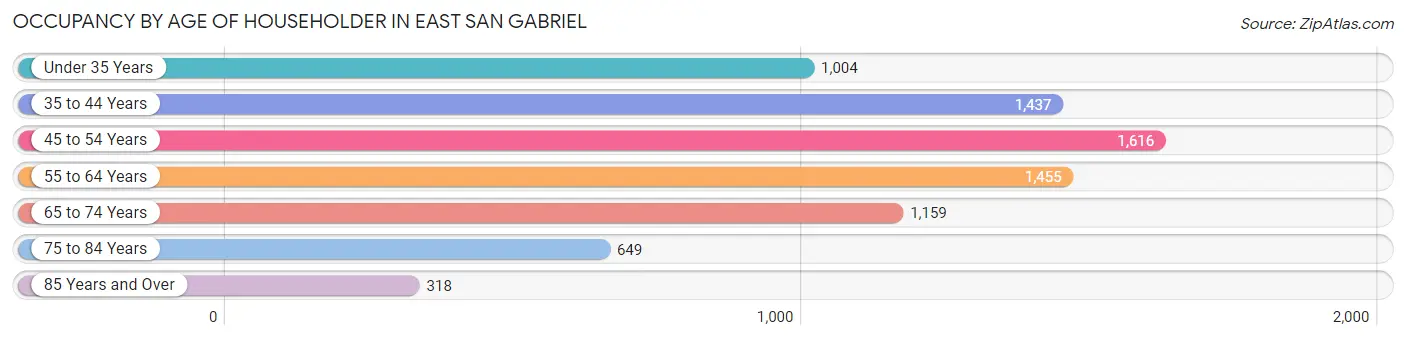
| Age Bracket | # Households | % Households |
| Under 35 Years | 1,004 | 13.1% |
| 35 to 44 Years | 1,437 | 18.8% |
| 45 to 54 Years | 1,616 | 21.2% |
| 55 to 64 Years | 1,455 | 19.1% |
| 65 to 74 Years | 1,159 | 15.2% |
| 75 to 84 Years | 649 | 8.5% |
| 85 Years and Over | 318 | 4.2% |
| Total | 7,638 | 100.0% |
Housing Finances in East San Gabriel
Median Income by Occupancy in East San Gabriel
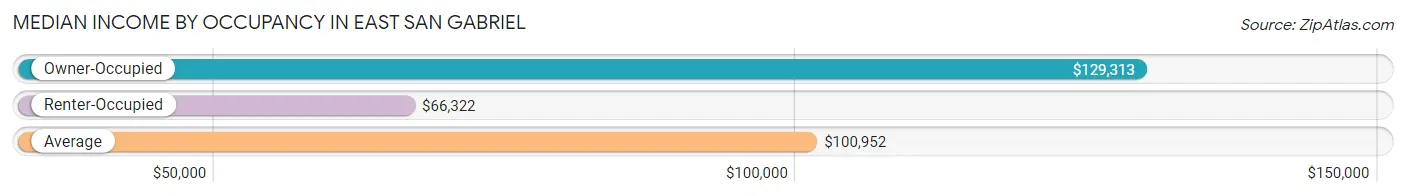
| Occupancy Type | # Households | Median Income |
| Owner-Occupied | 4,411 (57.8%) | $129,313 |
| Renter-Occupied | 3,227 (42.2%) | $66,322 |
| Average | 7,638 (100.0%) | $100,952 |
Occupancy by Householder Income Bracket in East San Gabriel
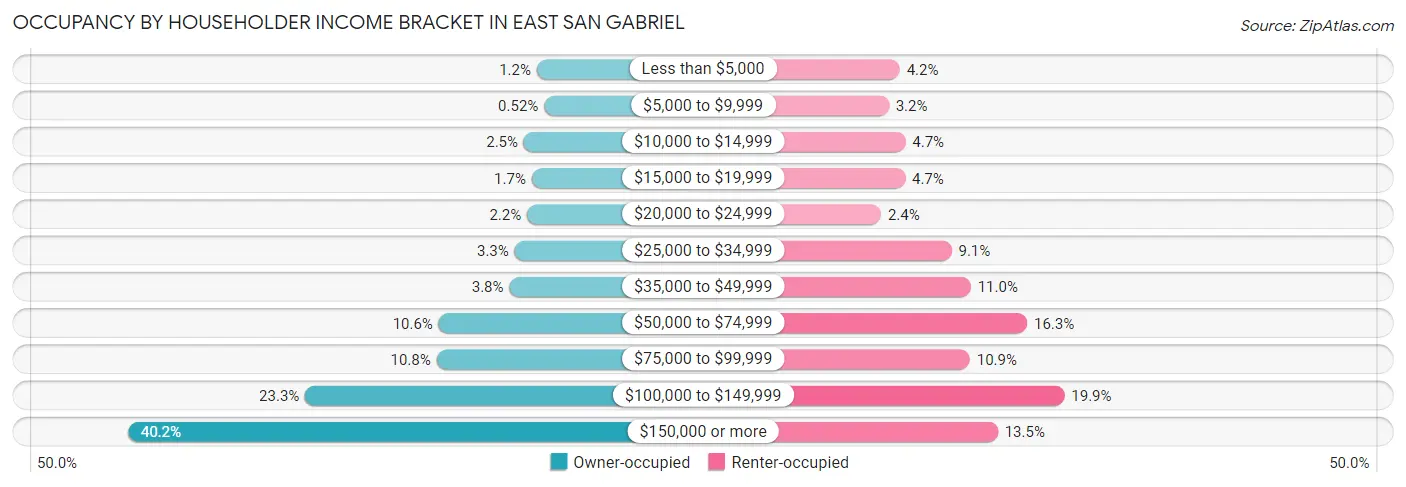
| Income Bracket | Owner-occupied | Renter-occupied |
| Less than $5,000 | 54 (1.2%) | 136 (4.2%) |
| $5,000 to $9,999 | 23 (0.5%) | 102 (3.2%) |
| $10,000 to $14,999 | 108 (2.5%) | 153 (4.7%) |
| $15,000 to $19,999 | 75 (1.7%) | 152 (4.7%) |
| $20,000 to $24,999 | 95 (2.1%) | 78 (2.4%) |
| $25,000 to $34,999 | 147 (3.3%) | 295 (9.1%) |
| $35,000 to $49,999 | 169 (3.8%) | 354 (11.0%) |
| $50,000 to $74,999 | 466 (10.6%) | 527 (16.3%) |
| $75,000 to $99,999 | 475 (10.8%) | 351 (10.9%) |
| $100,000 to $149,999 | 1,027 (23.3%) | 642 (19.9%) |
| $150,000 or more | 1,772 (40.2%) | 437 (13.5%) |
| Total | 4,411 (100.0%) | 3,227 (100.0%) |
Monthly Housing Cost Tiers in East San Gabriel
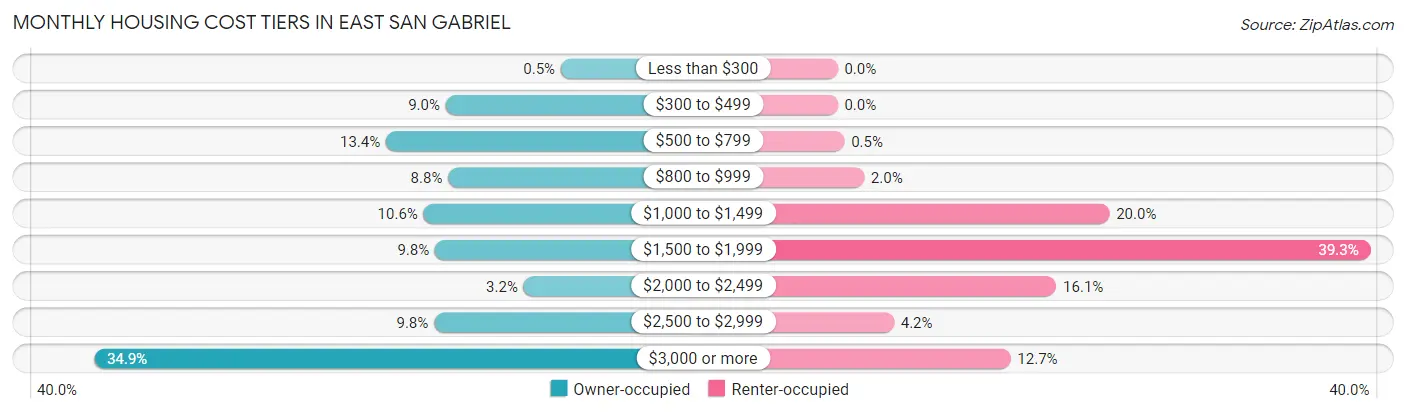
| Monthly Cost | Owner-occupied | Renter-occupied |
| Less than $300 | 22 (0.5%) | 0 (0.0%) |
| $300 to $499 | 396 (9.0%) | 0 (0.0%) |
| $500 to $799 | 590 (13.4%) | 16 (0.5%) |
| $800 to $999 | 388 (8.8%) | 63 (1.9%) |
| $1,000 to $1,499 | 468 (10.6%) | 646 (20.0%) |
| $1,500 to $1,999 | 431 (9.8%) | 1,267 (39.3%) |
| $2,000 to $2,499 | 143 (3.2%) | 520 (16.1%) |
| $2,500 to $2,999 | 434 (9.8%) | 134 (4.2%) |
| $3,000 or more | 1,539 (34.9%) | 411 (12.7%) |
| Total | 4,411 (100.0%) | 3,227 (100.0%) |
Physical Housing Characteristics in East San Gabriel
Housing Structures in East San Gabriel
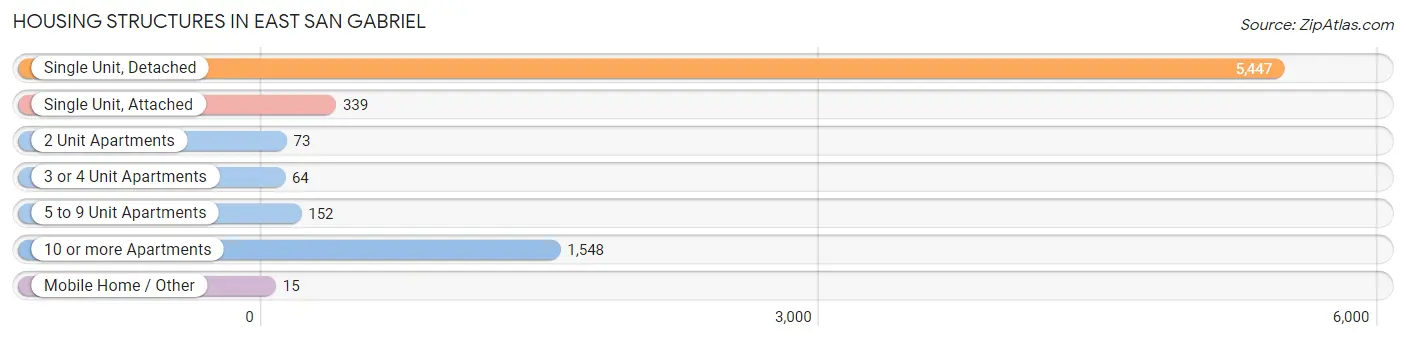
| Structure Type | # Housing Units | % Housing Units |
| Single Unit, Detached | 5,447 | 71.3% |
| Single Unit, Attached | 339 | 4.4% |
| 2 Unit Apartments | 73 | 1.0% |
| 3 or 4 Unit Apartments | 64 | 0.8% |
| 5 to 9 Unit Apartments | 152 | 2.0% |
| 10 or more Apartments | 1,548 | 20.3% |
| Mobile Home / Other | 15 | 0.2% |
| Total | 7,638 | 100.0% |
Housing Structures by Occupancy in East San Gabriel
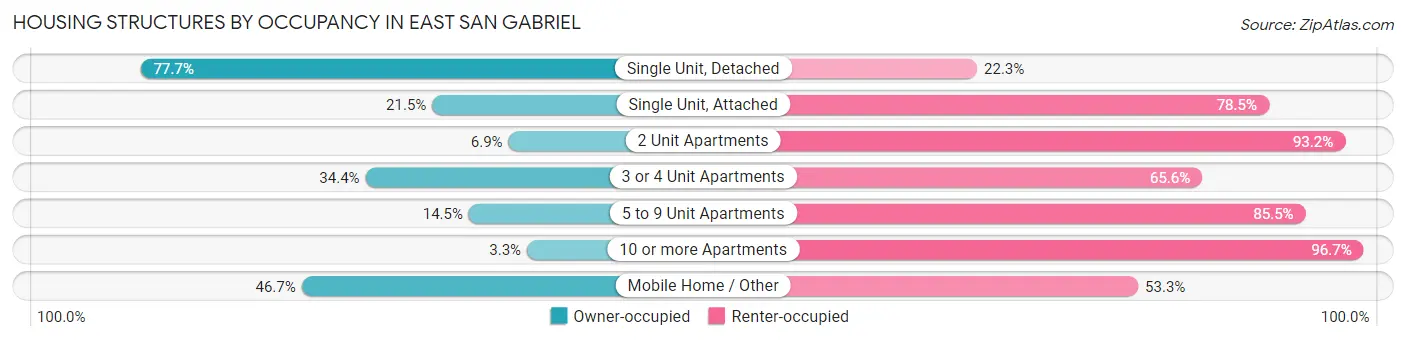
| Structure Type | Owner-occupied | Renter-occupied |
| Single Unit, Detached | 4,231 (77.7%) | 1,216 (22.3%) |
| Single Unit, Attached | 73 (21.5%) | 266 (78.5%) |
| 2 Unit Apartments | 5 (6.9%) | 68 (93.1%) |
| 3 or 4 Unit Apartments | 22 (34.4%) | 42 (65.6%) |
| 5 to 9 Unit Apartments | 22 (14.5%) | 130 (85.5%) |
| 10 or more Apartments | 51 (3.3%) | 1,497 (96.7%) |
| Mobile Home / Other | 7 (46.7%) | 8 (53.3%) |
| Total | 4,411 (57.8%) | 3,227 (42.2%) |
Housing Structures by Number of Rooms in East San Gabriel
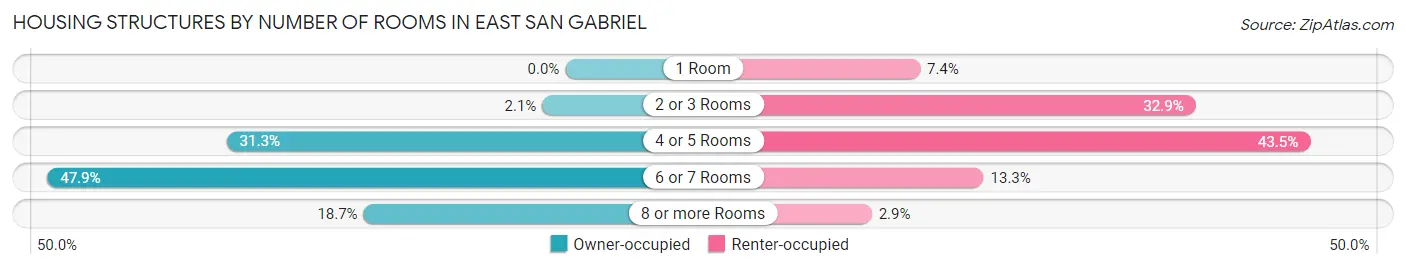
| Number of Rooms | Owner-occupied | Renter-occupied |
| 1 Room | 0 (0.0%) | 239 (7.4%) |
| 2 or 3 Rooms | 94 (2.1%) | 1,061 (32.9%) |
| 4 or 5 Rooms | 1,381 (31.3%) | 1,403 (43.5%) |
| 6 or 7 Rooms | 2,113 (47.9%) | 429 (13.3%) |
| 8 or more Rooms | 823 (18.7%) | 95 (2.9%) |
| Total | 4,411 (100.0%) | 3,227 (100.0%) |
Housing Structure by Heating Type in East San Gabriel
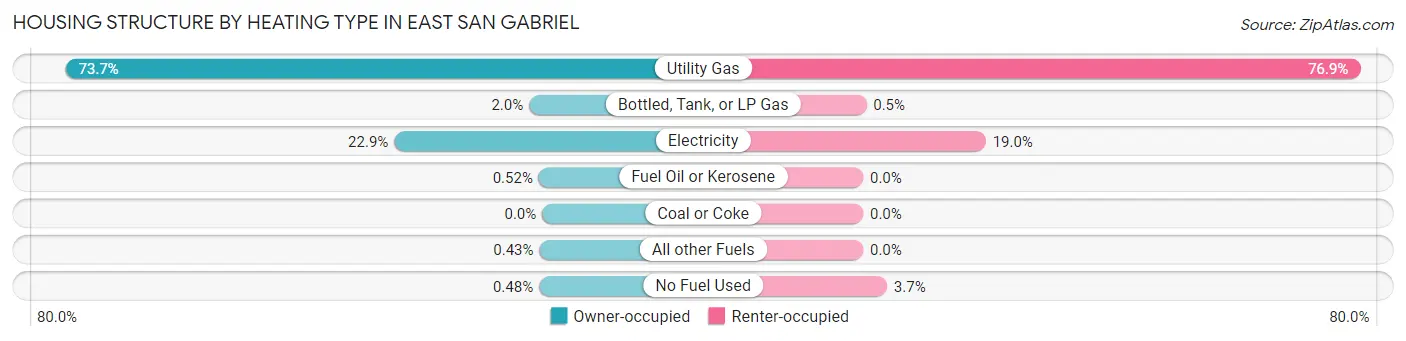
| Heating Type | Owner-occupied | Renter-occupied |
| Utility Gas | 3,250 (73.7%) | 2,480 (76.8%) |
| Bottled, Tank, or LP Gas | 89 (2.0%) | 16 (0.5%) |
| Electricity | 1,009 (22.9%) | 612 (19.0%) |
| Fuel Oil or Kerosene | 23 (0.5%) | 0 (0.0%) |
| Coal or Coke | 0 (0.0%) | 0 (0.0%) |
| All other Fuels | 19 (0.4%) | 0 (0.0%) |
| No Fuel Used | 21 (0.5%) | 119 (3.7%) |
| Total | 4,411 (100.0%) | 3,227 (100.0%) |
Household Vehicle Usage in East San Gabriel
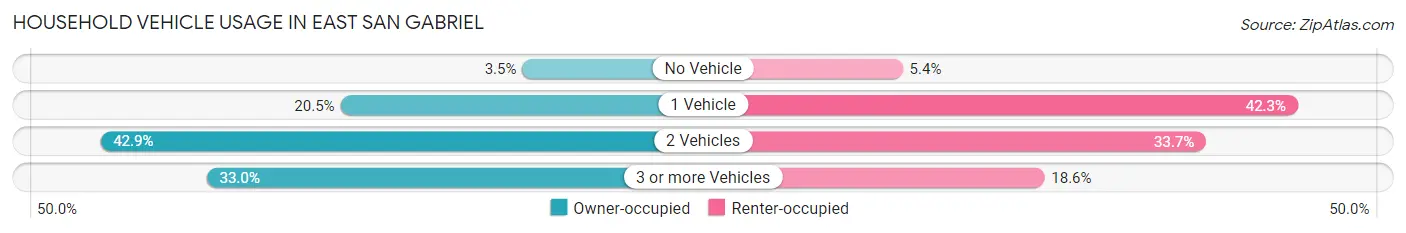
| Vehicles per Household | Owner-occupied | Renter-occupied |
| No Vehicle | 156 (3.5%) | 174 (5.4%) |
| 1 Vehicle | 905 (20.5%) | 1,364 (42.3%) |
| 2 Vehicles | 1,894 (42.9%) | 1,088 (33.7%) |
| 3 or more Vehicles | 1,456 (33.0%) | 601 (18.6%) |
| Total | 4,411 (100.0%) | 3,227 (100.0%) |
Real Estate & Mortgages in East San Gabriel
Real Estate and Mortgage Overview in East San Gabriel
| Characteristic | Without Mortgage | With Mortgage |
| Housing Units | 1,808 | 2,603 |
| Median Property Value | $897,000 | $915,700 |
| Median Household Income | $105,930 | $1,241 |
| Monthly Housing Costs | $751 | $1,539 |
| Real Estate Taxes | $5,408 | $96 |
Property Value by Mortgage Status in East San Gabriel
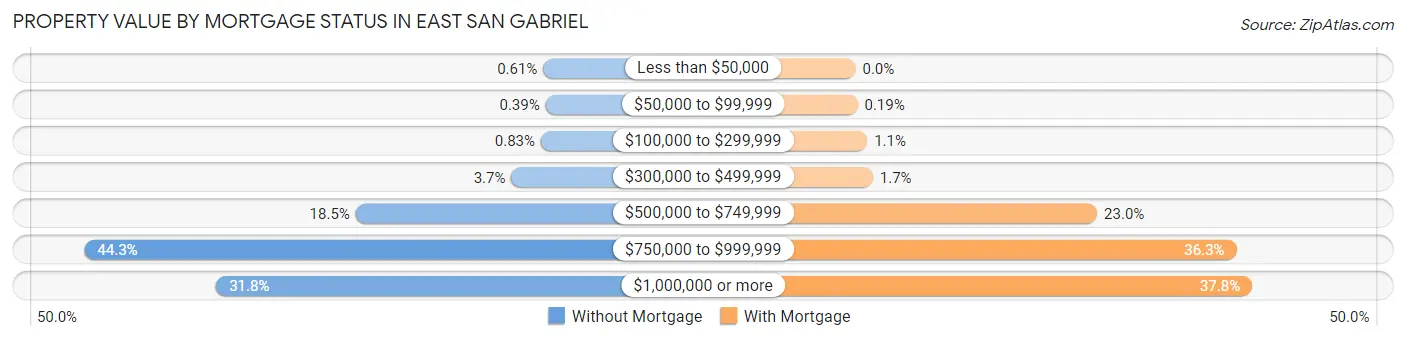
| Property Value | Without Mortgage | With Mortgage |
| Less than $50,000 | 11 (0.6%) | 0 (0.0%) |
| $50,000 to $99,999 | 7 (0.4%) | 5 (0.2%) |
| $100,000 to $299,999 | 15 (0.8%) | 29 (1.1%) |
| $300,000 to $499,999 | 66 (3.6%) | 43 (1.7%) |
| $500,000 to $749,999 | 334 (18.5%) | 599 (23.0%) |
| $750,000 to $999,999 | 801 (44.3%) | 944 (36.3%) |
| $1,000,000 or more | 574 (31.8%) | 983 (37.8%) |
| Total | 1,808 (100.0%) | 2,603 (100.0%) |
Household Income by Mortgage Status in East San Gabriel
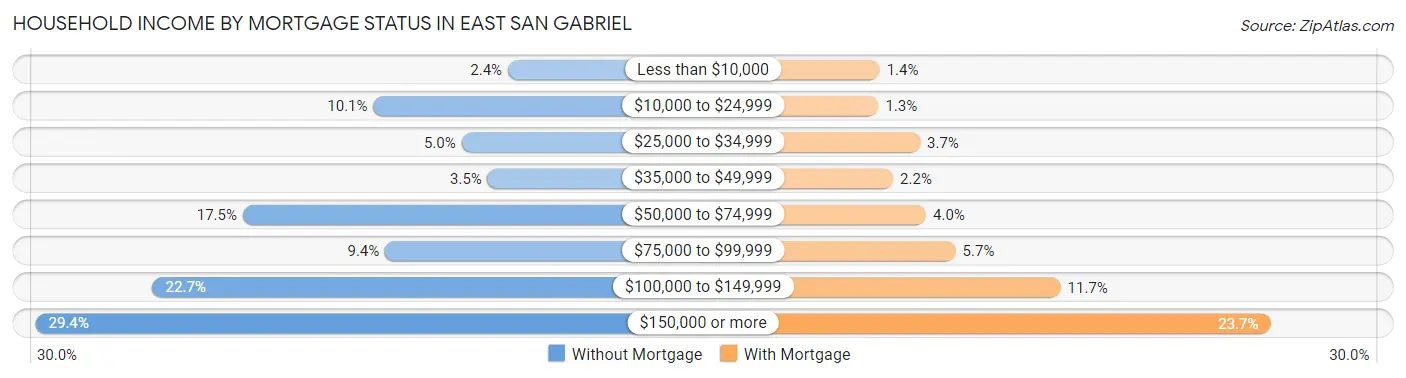
| Household Income | Without Mortgage | With Mortgage |
| Less than $10,000 | 43 (2.4%) | 36 (1.4%) |
| $10,000 to $24,999 | 182 (10.1%) | 34 (1.3%) |
| $25,000 to $34,999 | 91 (5.0%) | 96 (3.7%) |
| $35,000 to $49,999 | 64 (3.5%) | 56 (2.1%) |
| $50,000 to $74,999 | 317 (17.5%) | 105 (4.0%) |
| $75,000 to $99,999 | 170 (9.4%) | 149 (5.7%) |
| $100,000 to $149,999 | 410 (22.7%) | 305 (11.7%) |
| $150,000 or more | 531 (29.4%) | 617 (23.7%) |
| Total | 1,808 (100.0%) | 2,603 (100.0%) |
Property Value to Household Income Ratio in East San Gabriel
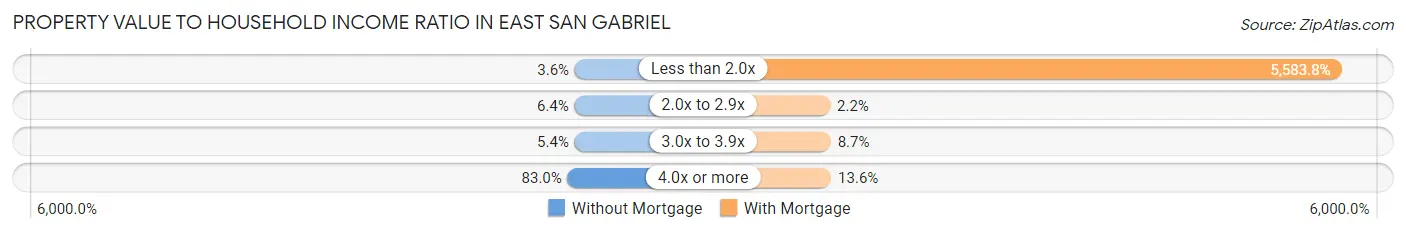
| Value-to-Income Ratio | Without Mortgage | With Mortgage |
| Less than 2.0x | 65 (3.6%) | 145,346 (5,583.8%) |
| 2.0x to 2.9x | 116 (6.4%) | 56 (2.1%) |
| 3.0x to 3.9x | 98 (5.4%) | 227 (8.7%) |
| 4.0x or more | 1,500 (83.0%) | 353 (13.6%) |
| Total | 1,808 (100.0%) | 2,603 (100.0%) |
Real Estate Taxes by Mortgage Status in East San Gabriel
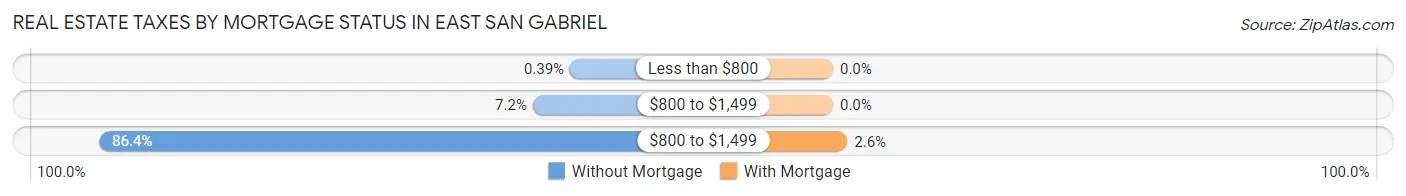
| Property Taxes | Without Mortgage | With Mortgage |
| Less than $800 | 7 (0.4%) | 0 (0.0%) |
| $800 to $1,499 | 130 (7.2%) | 0 (0.0%) |
| $800 to $1,499 | 1,562 (86.4%) | 68 (2.6%) |
| Total | 1,808 (100.0%) | 2,603 (100.0%) |
Health & Disability in East San Gabriel
Health Insurance Coverage by Age in East San Gabriel
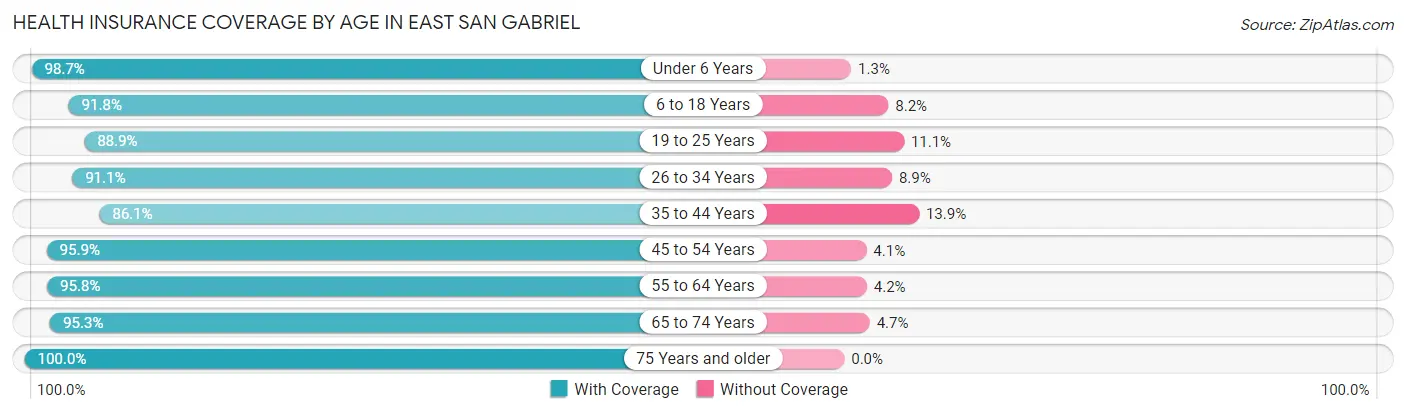
| Age Bracket | With Coverage | Without Coverage |
| Under 6 Years | 1,548 (98.7%) | 20 (1.3%) |
| 6 to 18 Years | 2,905 (91.8%) | 260 (8.2%) |
| 19 to 25 Years | 1,655 (88.9%) | 207 (11.1%) |
| 26 to 34 Years | 2,235 (91.1%) | 218 (8.9%) |
| 35 to 44 Years | 2,670 (86.1%) | 432 (13.9%) |
| 45 to 54 Years | 3,049 (95.9%) | 131 (4.1%) |
| 55 to 64 Years | 2,916 (95.8%) | 128 (4.2%) |
| 65 to 74 Years | 2,270 (95.3%) | 113 (4.7%) |
| 75 Years and older | 1,775 (100.0%) | 0 (0.0%) |
| Total | 21,023 (93.3%) | 1,509 (6.7%) |
Health Insurance Coverage by Citizenship Status in East San Gabriel
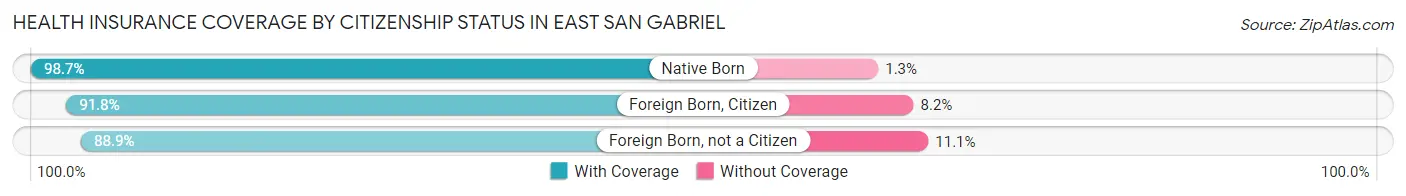
| Citizenship Status | With Coverage | Without Coverage |
| Native Born | 1,548 (98.7%) | 20 (1.3%) |
| Foreign Born, Citizen | 2,905 (91.8%) | 260 (8.2%) |
| Foreign Born, not a Citizen | 1,655 (88.9%) | 207 (11.1%) |
Health Insurance Coverage by Household Income in East San Gabriel
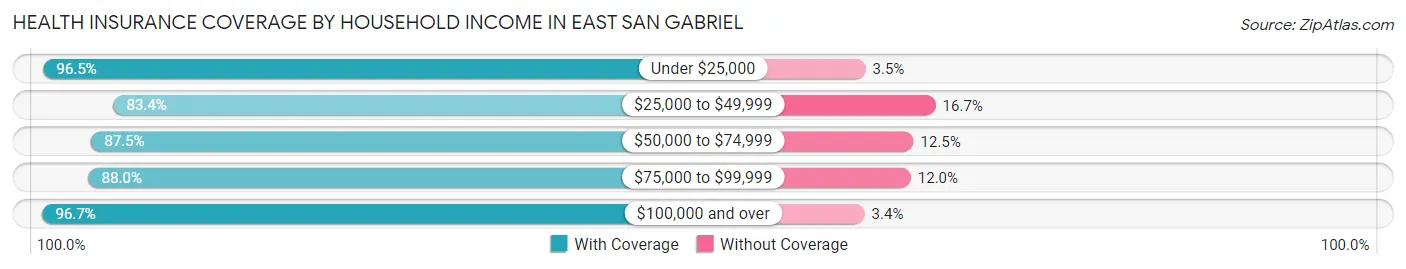
| Household Income | With Coverage | Without Coverage |
| Under $25,000 | 1,885 (96.5%) | 69 (3.5%) |
| $25,000 to $49,999 | 1,997 (83.4%) | 399 (16.7%) |
| $50,000 to $74,999 | 2,465 (87.5%) | 352 (12.5%) |
| $75,000 to $99,999 | 1,774 (88.0%) | 242 (12.0%) |
| $100,000 and over | 12,886 (96.7%) | 447 (3.4%) |
Public vs Private Health Insurance Coverage by Age in East San Gabriel
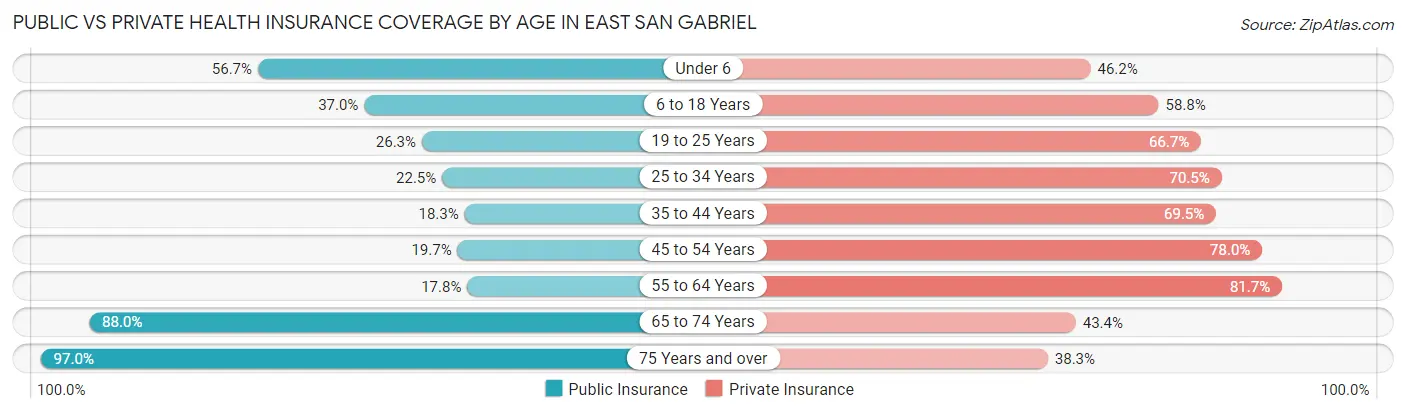
| Age Bracket | Public Insurance | Private Insurance |
| Under 6 | 889 (56.7%) | 724 (46.2%) |
| 6 to 18 Years | 1,170 (37.0%) | 1,861 (58.8%) |
| 19 to 25 Years | 489 (26.3%) | 1,242 (66.7%) |
| 25 to 34 Years | 552 (22.5%) | 1,729 (70.5%) |
| 35 to 44 Years | 569 (18.3%) | 2,155 (69.5%) |
| 45 to 54 Years | 625 (19.7%) | 2,481 (78.0%) |
| 55 to 64 Years | 543 (17.8%) | 2,487 (81.7%) |
| 65 to 74 Years | 2,098 (88.0%) | 1,035 (43.4%) |
| 75 Years and over | 1,722 (97.0%) | 679 (38.3%) |
| Total | 8,657 (38.4%) | 14,393 (63.9%) |
Disability Status by Sex by Age in East San Gabriel
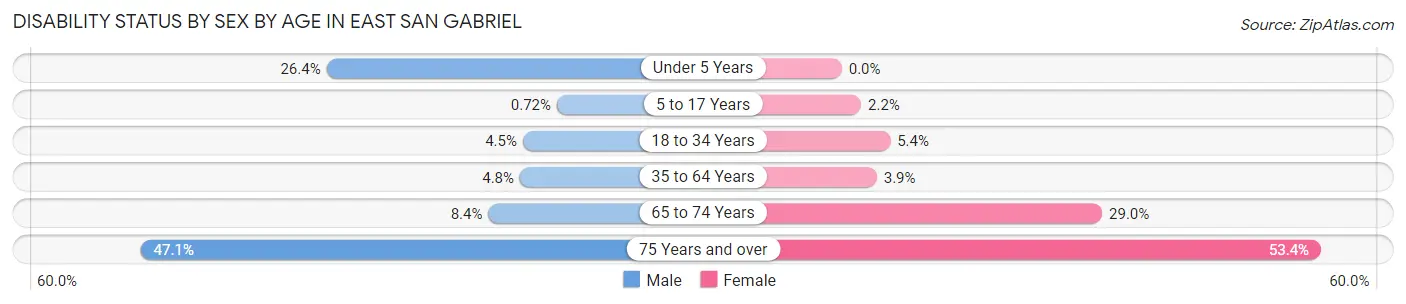
| Age Bracket | Male | Female |
| Under 5 Years | 177 (26.4%) | 0 (0.0%) |
| 5 to 17 Years | 12 (0.7%) | 32 (2.1%) |
| 18 to 34 Years | 112 (4.5%) | 114 (5.4%) |
| 35 to 64 Years | 217 (4.8%) | 189 (3.9%) |
| 65 to 74 Years | 92 (8.4%) | 372 (29.0%) |
| 75 Years and over | 450 (47.1%) | 437 (53.4%) |
Disability Class by Sex by Age in East San Gabriel
Disability Class: Hearing Difficulty
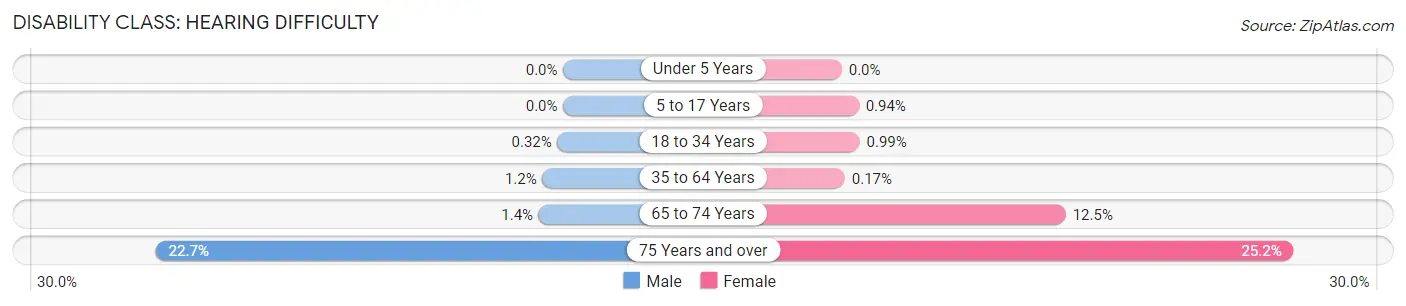
| Age Bracket | Male | Female |
| Under 5 Years | 0 (0.0%) | 0 (0.0%) |
| 5 to 17 Years | 0 (0.0%) | 14 (0.9%) |
| 18 to 34 Years | 8 (0.3%) | 21 (1.0%) |
| 35 to 64 Years | 52 (1.2%) | 8 (0.2%) |
| 65 to 74 Years | 15 (1.4%) | 160 (12.5%) |
| 75 Years and over | 217 (22.7%) | 206 (25.2%) |
Disability Class: Vision Difficulty
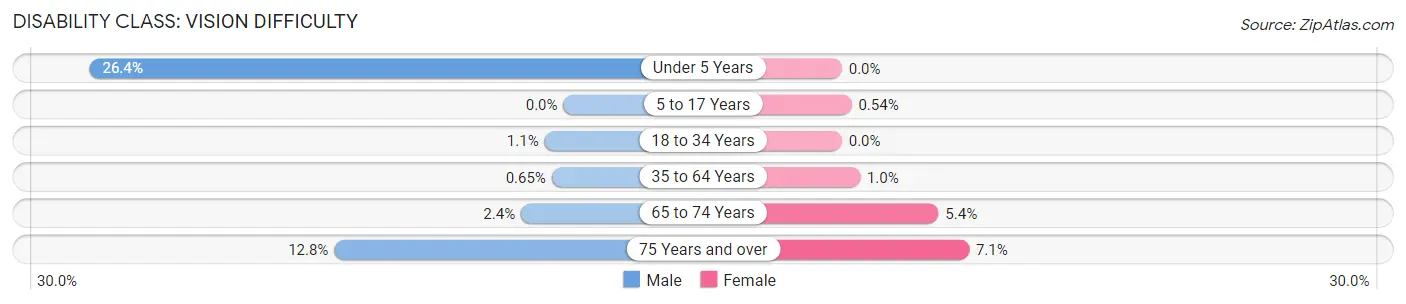
| Age Bracket | Male | Female |
| Under 5 Years | 177 (26.4%) | 0 (0.0%) |
| 5 to 17 Years | 0 (0.0%) | 8 (0.5%) |
| 18 to 34 Years | 26 (1.1%) | 0 (0.0%) |
| 35 to 64 Years | 29 (0.6%) | 49 (1.0%) |
| 65 to 74 Years | 26 (2.4%) | 69 (5.4%) |
| 75 Years and over | 122 (12.8%) | 58 (7.1%) |
Disability Class: Cognitive Difficulty
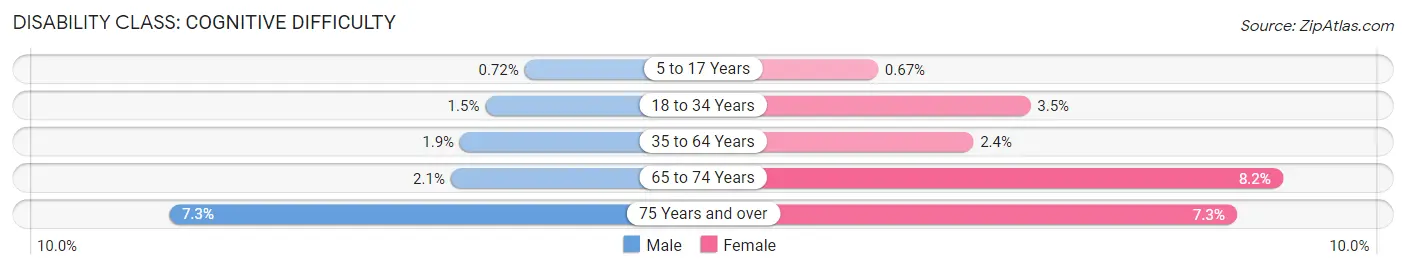
| Age Bracket | Male | Female |
| 5 to 17 Years | 12 (0.7%) | 10 (0.7%) |
| 18 to 34 Years | 36 (1.5%) | 74 (3.5%) |
| 35 to 64 Years | 86 (1.9%) | 118 (2.4%) |
| 65 to 74 Years | 23 (2.1%) | 105 (8.2%) |
| 75 Years and over | 70 (7.3%) | 60 (7.3%) |
Disability Class: Ambulatory Difficulty
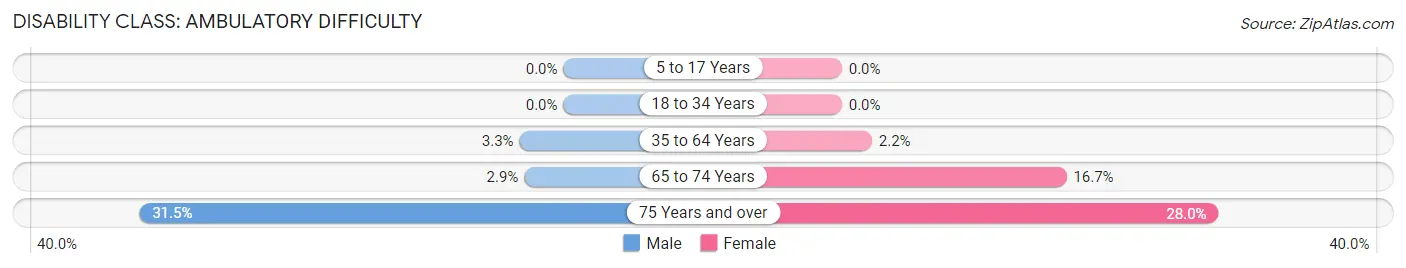
| Age Bracket | Male | Female |
| 5 to 17 Years | 0 (0.0%) | 0 (0.0%) |
| 18 to 34 Years | 0 (0.0%) | 0 (0.0%) |
| 35 to 64 Years | 146 (3.3%) | 108 (2.2%) |
| 65 to 74 Years | 32 (2.9%) | 214 (16.7%) |
| 75 Years and over | 301 (31.5%) | 229 (28.0%) |
Disability Class: Self-Care Difficulty
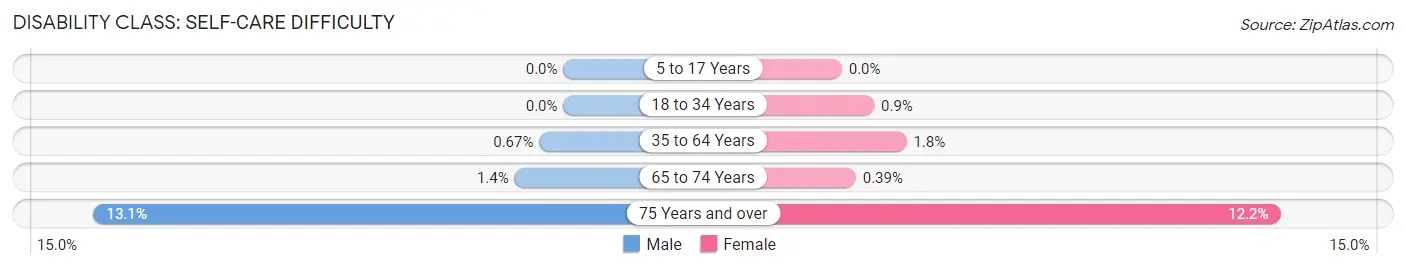
| Age Bracket | Male | Female |
| 5 to 17 Years | 0 (0.0%) | 0 (0.0%) |
| 18 to 34 Years | 0 (0.0%) | 19 (0.9%) |
| 35 to 64 Years | 30 (0.7%) | 87 (1.8%) |
| 65 to 74 Years | 15 (1.4%) | 5 (0.4%) |
| 75 Years and over | 125 (13.1%) | 100 (12.2%) |
Technology Access in East San Gabriel
Computing Device Access in East San Gabriel
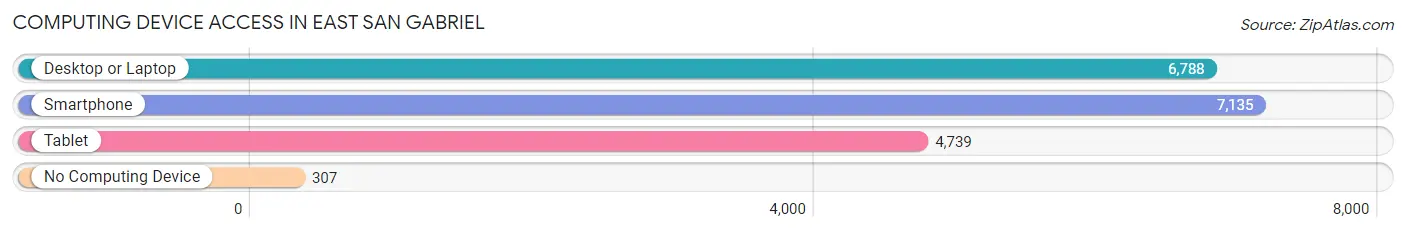
| Device Type | # Households | % Households |
| Desktop or Laptop | 6,788 | 88.9% |
| Smartphone | 7,135 | 93.4% |
| Tablet | 4,739 | 62.1% |
| No Computing Device | 307 | 4.0% |
| Total | 7,638 | 100.0% |
Internet Access in East San Gabriel
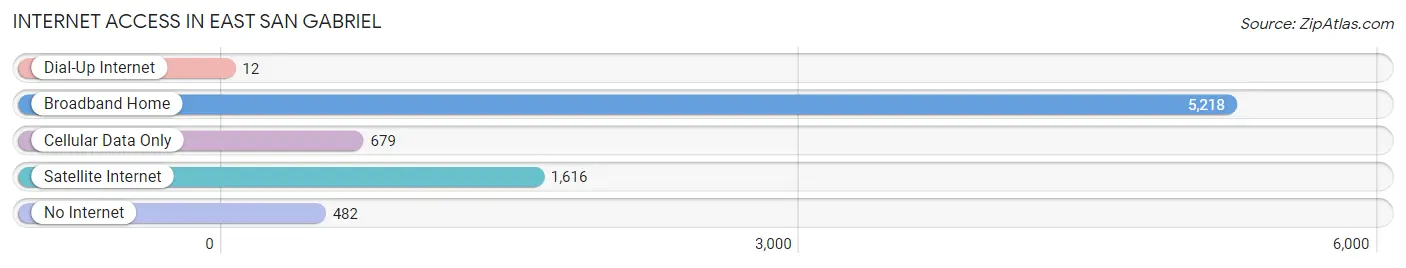
| Internet Type | # Households | % Households |
| Dial-Up Internet | 12 | 0.2% |
| Broadband Home | 5,218 | 68.3% |
| Cellular Data Only | 679 | 8.9% |
| Satellite Internet | 1,616 | 21.2% |
| No Internet | 482 | 6.3% |
| Total | 7,638 | 100.0% |
East San Gabriel Summary
East San Gabriel is a census-designated place (CDP) located in Los Angeles County, California. It is located in the San Gabriel Valley, east of the city of San Gabriel. The population was 8,845 at the 2010 census, up from 8,541 at the 2000 census.
Geography
East San Gabriel is located at 34°5'7" North, 118°6'17" West (34.085278, -118.104722). It is bordered by the city of San Gabriel to the west, the city of Rosemead to the north, the city of Temple City to the east, and the city of El Monte to the south.
According to the United States Census Bureau, the CDP has a total area of 1.2 square miles (3.1 km2), all of it land.
Demographics
As of the census of 2000, there were 8,541 people, 2,845 households, and 2,092 families residing in the CDP. The population density was 7,093.3 people per square mile (2,735.2/km2). There were 2,919 housing units at an average density of 2,427.2 per square mile (936.2/km2). The racial makeup of the CDP was 44.2% White, 0.9% African American, 1.2% Native American, 24.2% Asian, 0.2% Pacific Islander, 24.2% from other races, and 5.1% from two or more races. Hispanic or Latino of any race were 51.2% of the population.
There were 2,845 households, out of which 33.2% had children under the age of 18 living with them, 51.2% were married couples living together, 14.2% had a female householder with no husband present, and 27.2% were non-families. 21.2% of all households were made up of individuals, and 8.2% had someone living alone who was 65 years of age or older. The average household size was 3.00 and the average family size was 3.50.
In the CDP, the population was spread out, with 24.2% under the age of 18, 9.2% from 18 to 24, 30.2% from 25 to 44, 22.2% from 45 to 64, and 14.2% who were 65 years of age or older. The median age was 36 years. For every 100 females, there were 94.2 males. For every 100 females age 18 and over, there were 91.2 males.
The median income for a household in the CDP was $41,944, and the median income for a family was $45,938. Males had a median income of $31,944 versus $27,944 for females. The per capita income for the CDP was $17,944. About 10.2% of families and 12.2% of the population were below the poverty line, including 15.2% of those under age 18 and 8.2% of those age 65 or over.
Economy
East San Gabriel is home to a variety of businesses, including restaurants, retail stores, and professional services. The largest employers in the area are the San Gabriel Valley Medical Center, the San Gabriel Unified School District, and the City of San Gabriel.
The San Gabriel Valley Medical Center is a full-service hospital that provides a wide range of medical services, including emergency care, surgery, and rehabilitation. The hospital also offers a variety of specialty services, such as cardiology, neurology, and oncology.
The San Gabriel Unified School District serves the communities of East San Gabriel, San Gabriel, and Rosemead. The district operates a total of 18 elementary schools, four middle schools, and two high schools.
The City of San Gabriel is the largest employer in the area, with a workforce of over 1,000 employees. The city provides a variety of services, including public safety, parks and recreation, and public works. The city also operates a number of cultural and recreational facilities, including the San Gabriel Mission Playhouse, the San Gabriel Civic Auditorium, and the San Gabriel Valley Historical Museum.
Conclusion
East San Gabriel is a census-designated place located in Los Angeles County, California. It is located in the San Gabriel Valley, east of the city of San Gabriel. The population was 8,845 at the 2010 census, up from 8,541 at the 2000 census. The area is home to a variety of businesses, including restaurants, retail stores, and professional services. The largest employers in the area are the San Gabriel Valley Medical Center, the San Gabriel Unified School District, and the City of San Gabriel. The population is diverse, with a mix of White, African American, Native American, Asian, and Hispanic or Latino residents. The median income for a household in the CDP was $41,944, and the median income for a family was $45,938.
Common Questions
What is Per Capita Income in East San Gabriel?
Per Capita income in East San Gabriel is $42,971.
What is the Median Family Income in East San Gabriel?
Median Family Income in East San Gabriel is $113,475.
What is the Median Household income in East San Gabriel?
Median Household Income in East San Gabriel is $100,952.
What is Income or Wage Gap in East San Gabriel?
Income or Wage Gap in East San Gabriel is 14.9%.
Women in East San Gabriel earn 85.1 cents for every dollar earned by a man.
What is Family Income Deficit in East San Gabriel?
Family Income Deficit in East San Gabriel is $11,700.
Families that are below poverty line in East San Gabriel earn $11,700 less on average than the poverty threshold level.
What is Inequality or Gini Index in East San Gabriel?
Inequality or Gini Index in East San Gabriel is 0.45.
What is the Total Population of East San Gabriel?
Total Population of East San Gabriel is 22,654.
What is the Total Male Population of East San Gabriel?
Total Male Population of East San Gabriel is 11,419.
What is the Total Female Population of East San Gabriel?
Total Female Population of East San Gabriel is 11,235.
What is the Ratio of Males per 100 Females in East San Gabriel?
There are 101.64 Males per 100 Females in East San Gabriel.
What is the Ratio of Females per 100 Males in East San Gabriel?
There are 98.39 Females per 100 Males in East San Gabriel.
What is the Median Population Age in East San Gabriel?
Median Population Age in East San Gabriel is 41.9 Years.
What is the Average Family Size in East San Gabriel
Average Family Size in East San Gabriel is 3.4 People.
What is the Average Household Size in East San Gabriel
Average Household Size in East San Gabriel is 3.0 People.
How Large is the Labor Force in East San Gabriel?
There are 11,817 People in the Labor Forcein in East San Gabriel.
What is the Percentage of People in the Labor Force in East San Gabriel?
63.1% of People are in the Labor Force in East San Gabriel.
What is the Unemployment Rate in East San Gabriel?
Unemployment Rate in East San Gabriel is 7.4%.