Cities with the Highest Percentage of Guatemalan Population in Michigan
RELATED REPORTS & OPTIONS
Guatemalan
Michigan
Compare Cities
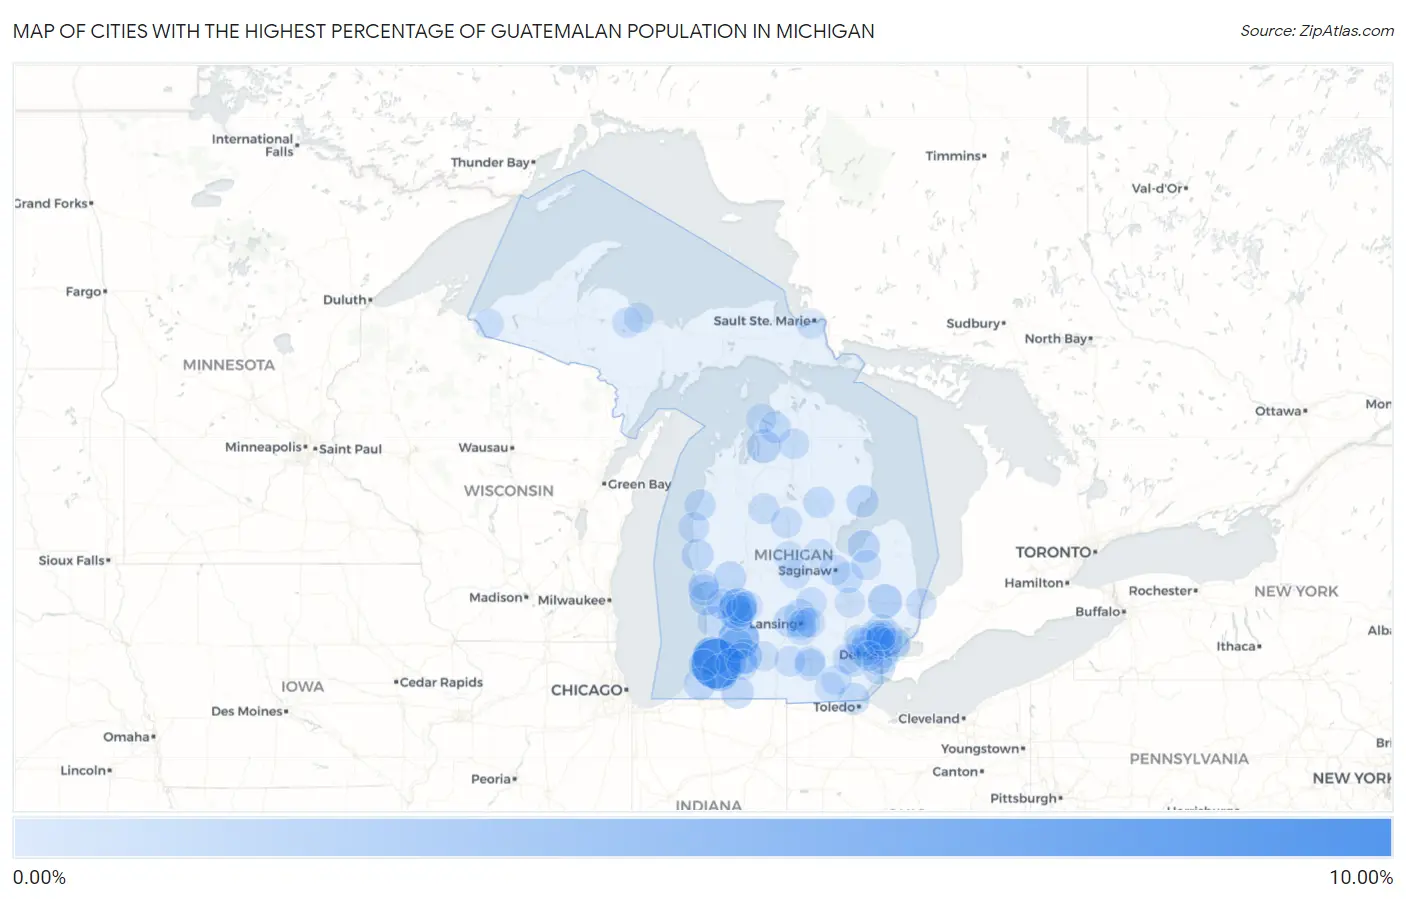
Map of Cities with the Highest Percentage of Guatemalan Population in Michigan
0.00%
10.00%
Cities with the Highest Percentage of Guatemalan Population in Michigan
| City | Guatemalan | vs State | vs National | |
| 1. | Falmouth | 8.30% | 0.13%(+8.17)#1 | 0.50%(+7.80)#167 |
| 2. | Lawrence | 6.65% | 0.13%(+6.52)#2 | 0.50%(+6.15)#225 |
| 3. | Martin | 3.58% | 0.13%(+3.46)#3 | 0.50%(+3.08)#477 |
| 4. | Bangor | 3.14% | 0.13%(+3.01)#4 | 0.50%(+2.64)#536 |
| 5. | Ramsay | 2.94% | 0.13%(+2.81)#5 | 0.50%(+2.44)#586 |
| 6. | Decatur | 2.28% | 0.13%(+2.15)#6 | 0.50%(+1.78)#762 |
| 7. | Grand Rapids | 2.15% | 0.13%(+2.02)#7 | 0.50%(+1.64)#798 |
| 8. | Wyoming | 1.48% | 0.13%(+1.35)#8 | 0.50%(+0.971)#1,092 |
| 9. | Eastwood | 1.43% | 0.13%(+1.30)#9 | 0.50%(+0.927)#1,130 |
| 10. | Imlay City | 1.35% | 0.13%(+1.22)#10 | 0.50%(+0.848)#1,182 |
| 11. | Bellaire | 1.15% | 0.13%(+1.02)#11 | 0.50%(+0.648)#1,350 |
| 12. | Grand Haven | 1.12% | 0.13%(+0.993)#12 | 0.50%(+0.618)#1,382 |
| 13. | Otsego | 1.08% | 0.13%(+0.949)#13 | 0.50%(+0.574)#1,425 |
| 14. | Sebewaing | 0.77% | 0.13%(+0.640)#14 | 0.50%(+0.265)#1,798 |
| 15. | Grant | 0.74% | 0.13%(+0.614)#15 | 0.50%(+0.238)#1,849 |
| 16. | Berrien Springs | 0.74% | 0.13%(+0.613)#16 | 0.50%(+0.238)#1,851 |
| 17. | Constantine | 0.72% | 0.13%(+0.594)#17 | 0.50%(+0.219)#1,894 |
| 18. | Grand Ledge | 0.72% | 0.13%(+0.590)#18 | 0.50%(+0.214)#1,903 |
| 19. | East Tawas | 0.67% | 0.13%(+0.544)#19 | 0.50%(+0.168)#1,971 |
| 20. | Shelby | 0.63% | 0.13%(+0.506)#20 | 0.50%(+0.131)#2,054 |
| 21. | Dewitt | 0.63% | 0.13%(+0.499)#21 | 0.50%(+0.124)#2,068 |
| 22. | Kalamazoo | 0.59% | 0.13%(+0.462)#22 | 0.50%(+0.086)#2,155 |
| 23. | Lambertville | 0.57% | 0.13%(+0.440)#23 | 0.50%(+0.065)#2,199 |
| 24. | Boyne City | 0.50% | 0.13%(+0.369)#24 | 0.50%(-0.007)#2,391 |
| 25. | Cutlerville | 0.46% | 0.13%(+0.328)#25 | 0.50%(-0.048)#2,509 |
| 26. | Vandercook Lake | 0.45% | 0.13%(+0.324)#26 | 0.50%(-0.051)#2,525 |
| 27. | Walker | 0.41% | 0.13%(+0.280)#27 | 0.50%(-0.095)#2,654 |
| 28. | Norton Shores | 0.39% | 0.13%(+0.264)#28 | 0.50%(-0.112)#2,716 |
| 29. | Trenton | 0.37% | 0.13%(+0.246)#29 | 0.50%(-0.130)#2,779 |
| 30. | Manistee | 0.37% | 0.13%(+0.239)#30 | 0.50%(-0.136)#2,807 |
| 31. | West Branch | 0.36% | 0.13%(+0.235)#31 | 0.50%(-0.140)#2,826 |
| 32. | Kentwood | 0.36% | 0.13%(+0.232)#32 | 0.50%(-0.143)#2,839 |
| 33. | Frankenmuth | 0.36% | 0.13%(+0.227)#33 | 0.50%(-0.149)#2,861 |
| 34. | Mcbain | 0.27% | 0.13%(+0.139)#34 | 0.50%(-0.236)#3,274 |
| 35. | Watervliet | 0.27% | 0.13%(+0.137)#35 | 0.50%(-0.239)#3,285 |
| 36. | East Grand Rapids | 0.26% | 0.13%(+0.135)#36 | 0.50%(-0.241)#3,300 |
| 37. | Harrison | 0.26% | 0.13%(+0.131)#37 | 0.50%(-0.244)#3,321 |
| 38. | Ypsilanti | 0.24% | 0.13%(+0.109)#38 | 0.50%(-0.267)#3,447 |
| 39. | Gaylord | 0.23% | 0.13%(+0.106)#39 | 0.50%(-0.269)#3,465 |
| 40. | River Rouge | 0.22% | 0.13%(+0.093)#40 | 0.50%(-0.282)#3,540 |
| 41. | Holland | 0.20% | 0.13%(+0.067)#41 | 0.50%(-0.308)#3,690 |
| 42. | Detroit | 0.18% | 0.13%(+0.055)#42 | 0.50%(-0.320)#3,762 |
| 43. | Albion | 0.18% | 0.13%(+0.052)#43 | 0.50%(-0.323)#3,781 |
| 44. | Allendale | 0.17% | 0.13%(+0.046)#44 | 0.50%(-0.330)#3,825 |
| 45. | Ludington | 0.17% | 0.13%(+0.040)#45 | 0.50%(-0.335)#3,860 |
| 46. | Wixom | 0.16% | 0.13%(+0.030)#46 | 0.50%(-0.345)#3,927 |
| 47. | Portage | 0.14% | 0.13%(+0.012)#47 | 0.50%(-0.363)#4,031 |
| 48. | Ovid | 0.14% | 0.13%(+0.010)#48 | 0.50%(-0.366)#4,052 |
| 49. | Alma | 0.14% | 0.13%(+0.009)#49 | 0.50%(-0.366)#4,054 |
| 50. | Farmington | 0.12% | 0.13%(-0.007)#50 | 0.50%(-0.382)#4,169 |
| 51. | Muskegon | 0.12% | 0.13%(-0.009)#51 | 0.50%(-0.384)#4,182 |
| 52. | Mattawan | 0.12% | 0.13%(-0.012)#52 | 0.50%(-0.387)#4,215 |
| 53. | Pleasant Ridge | 0.11% | 0.13%(-0.014)#53 | 0.50%(-0.389)#4,231 |
| 54. | Farmington Hills | 0.11% | 0.13%(-0.020)#54 | 0.50%(-0.395)#4,288 |
| 55. | Negaunee | 0.11% | 0.13%(-0.021)#55 | 0.50%(-0.397)#4,299 |
| 56. | Saginaw | 0.10% | 0.13%(-0.025)#56 | 0.50%(-0.400)#4,326 |
| 57. | East Lansing | 0.10% | 0.13%(-0.025)#57 | 0.50%(-0.401)#4,329 |
| 58. | Livonia | 0.093% | 0.13%(-0.036)#58 | 0.50%(-0.411)#4,410 |
| 59. | Port Huron | 0.090% | 0.13%(-0.039)#59 | 0.50%(-0.414)#4,423 |
| 60. | Holt | 0.087% | 0.13%(-0.042)#60 | 0.50%(-0.417)#4,450 |
| 61. | Plymouth | 0.086% | 0.13%(-0.043)#61 | 0.50%(-0.418)#4,456 |
| 62. | Ann Arbor | 0.079% | 0.13%(-0.049)#62 | 0.50%(-0.425)#4,522 |
| 63. | Rochester Hills | 0.079% | 0.13%(-0.050)#63 | 0.50%(-0.425)#4,526 |
| 64. | Mount Pleasant | 0.078% | 0.13%(-0.051)#64 | 0.50%(-0.426)#4,545 |
| 65. | Jackson | 0.076% | 0.13%(-0.052)#65 | 0.50%(-0.428)#4,567 |
| 66. | Caro | 0.070% | 0.13%(-0.059)#66 | 0.50%(-0.434)#4,620 |
| 67. | Tecumseh | 0.069% | 0.13%(-0.060)#67 | 0.50%(-0.435)#4,634 |
| 68. | Battle Creek | 0.069% | 0.13%(-0.060)#68 | 0.50%(-0.435)#4,638 |
| 69. | Midland | 0.068% | 0.13%(-0.060)#69 | 0.50%(-0.436)#4,640 |
| 70. | Lansing | 0.068% | 0.13%(-0.061)#70 | 0.50%(-0.436)#4,641 |
| 71. | Haslett | 0.068% | 0.13%(-0.061)#71 | 0.50%(-0.436)#4,644 |
| 72. | Grosse Pointe Woods | 0.067% | 0.13%(-0.061)#72 | 0.50%(-0.437)#4,653 |
| 73. | Birmingham | 0.064% | 0.13%(-0.064)#73 | 0.50%(-0.440)#4,672 |
| 74. | Adrian | 0.063% | 0.13%(-0.066)#74 | 0.50%(-0.441)#4,682 |
| 75. | Clawson | 0.061% | 0.13%(-0.067)#75 | 0.50%(-0.443)#4,697 |
| 76. | Bessemer | 0.059% | 0.13%(-0.070)#76 | 0.50%(-0.446)#4,718 |
| 77. | Berkley | 0.046% | 0.13%(-0.083)#77 | 0.50%(-0.458)#4,802 |
| 78. | Forest Hills | 0.046% | 0.13%(-0.083)#78 | 0.50%(-0.458)#4,804 |
| 79. | Charlevoix | 0.040% | 0.13%(-0.088)#79 | 0.50%(-0.464)#4,846 |
| 80. | Flint | 0.029% | 0.13%(-0.099)#80 | 0.50%(-0.475)#4,922 |
| 81. | Marquette | 0.029% | 0.13%(-0.100)#81 | 0.50%(-0.475)#4,923 |
| 82. | Sterling Heights | 0.024% | 0.13%(-0.105)#82 | 0.50%(-0.480)#4,972 |
| 83. | Bloomfield Hills | 0.023% | 0.13%(-0.106)#83 | 0.50%(-0.481)#4,986 |
| 84. | Novi | 0.021% | 0.13%(-0.107)#84 | 0.50%(-0.483)#4,999 |
| 85. | Royal Oak | 0.021% | 0.13%(-0.108)#85 | 0.50%(-0.483)#5,008 |
| 86. | Warren | 0.019% | 0.13%(-0.109)#86 | 0.50%(-0.485)#5,025 |
| 87. | Allen Park | 0.018% | 0.13%(-0.111)#87 | 0.50%(-0.487)#5,039 |
| 88. | St Clair Shores | 0.015% | 0.13%(-0.113)#88 | 0.50%(-0.489)#5,057 |
| 89. | Troy | 0.014% | 0.13%(-0.115)#89 | 0.50%(-0.490)#5,066 |
| 90. | Westland | 0.0094% | 0.13%(-0.119)#90 | 0.50%(-0.495)#5,103 |
| 91. | Sault Ste Marie | 0.0075% | 0.13%(-0.121)#91 | 0.50%(-0.497)#5,121 |
Common Questions
What are the Top 10 Cities with the Highest Percentage of Guatemalan Population in Michigan?
Top 10 Cities with the Highest Percentage of Guatemalan Population in Michigan are:
#1
6.65%
#2
3.58%
#3
3.14%
#4
2.28%
#5
2.15%
#6
1.48%
#7
1.43%
#8
1.35%
#9
1.15%
#10
1.12%
What city has the Highest Percentage of Guatemalan Population in Michigan?
Lawrence has the Highest Percentage of Guatemalan Population in Michigan with 6.65%.
What is the Percentage of Guatemalan Population in the State of Michigan?
Percentage of Guatemalan Population in Michigan is 0.13%.
What is the Percentage of Guatemalan Population in the United States?
Percentage of Guatemalan Population in the United States is 0.50%.