Cities with the Highest Percentage of Guatemalan Population in Minnesota
RELATED REPORTS & OPTIONS
Guatemalan
Minnesota
Compare Cities
Map of Cities with the Highest Percentage of Guatemalan Population in Minnesota
0.00%
40.00%
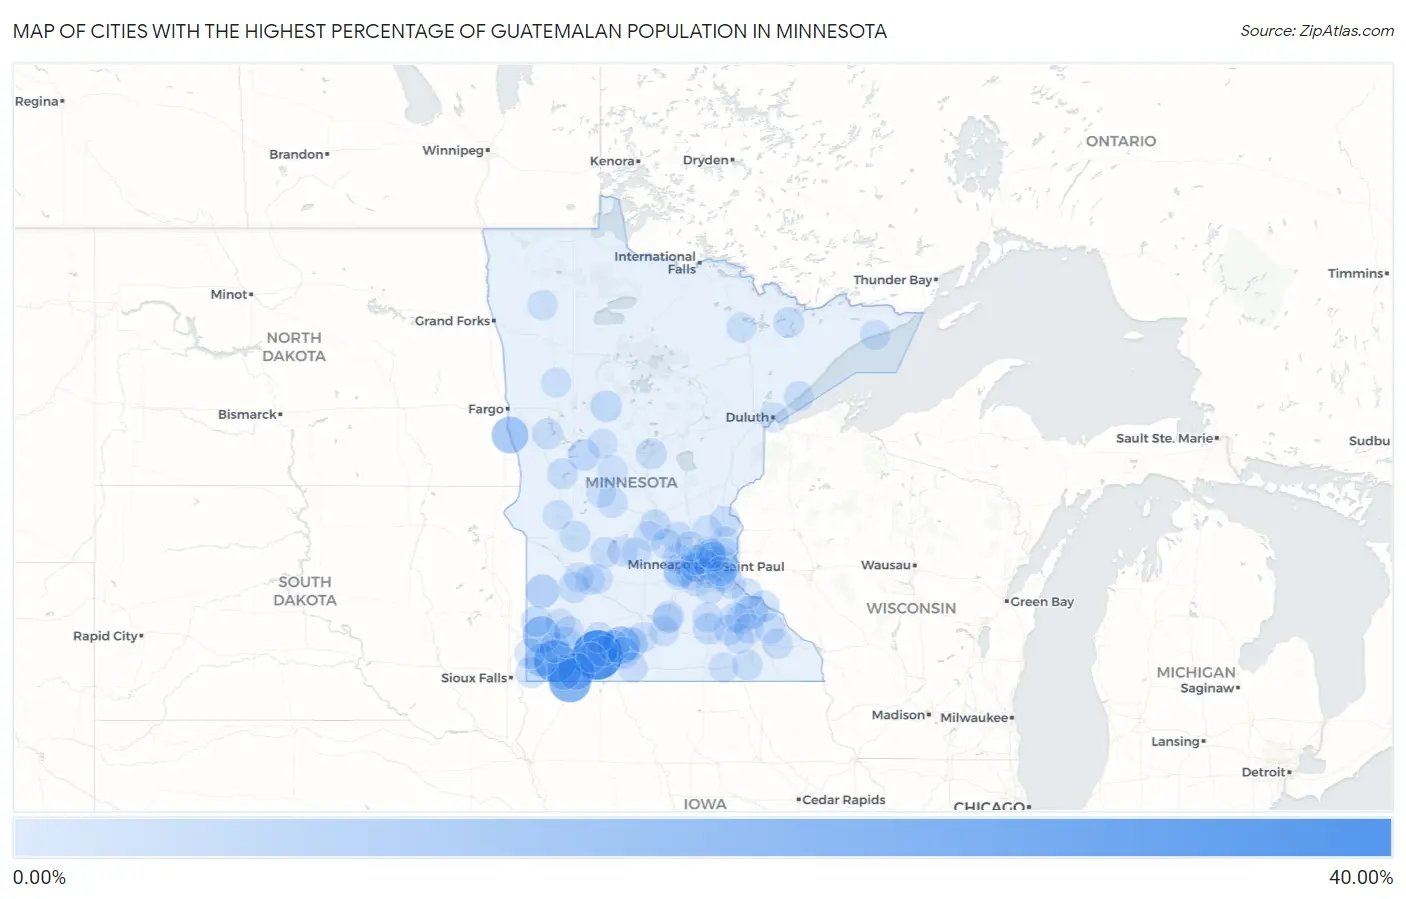
Cities with the Highest Percentage of Guatemalan Population in Minnesota
| City | Guatemalan | vs State | vs National | |
| 1. | Wilder | 38.10% | 0.19% (+37.9)#1 | 0.50% (+37.6)#11 |
| 2. | Bigelow | 23.37% | 0.19% (+23.2)#2 | 0.50% (+22.9)#33 |
| 3. | Lismore | 23.29% | 0.19% (+23.1)#3 | 0.50% (+22.8)#34 |
| 4. | Butterfield | 13.66% | 0.19% (+13.5)#4 | 0.50% (+13.2)#77 |
| 5. | Holland | 13.36% | 0.19% (+13.2)#5 | 0.50% (+12.9)#80 |
| 6. | Worthington | 13.30% | 0.19% (+13.1)#6 | 0.50% (+12.8)#83 |
| 7. | Wolverton | 12.77% | 0.19% (+12.6)#7 | 0.50% (+12.3)#89 |
| 8. | Rushmore | 8.90% | 0.19% (+8.71)#8 | 0.50% (+8.40)#154 |
| 9. | Porter | 6.49% | 0.19% (+6.29)#9 | 0.50% (+5.98)#235 |
| 10. | Bellechester | 6.03% | 0.19% (+5.84)#10 | 0.50% (+5.53)#259 |
| 11. | St Bonifacius | 5.88% | 0.19% (+5.68)#11 | 0.50% (+5.38)#275 |
| 12. | Hardwick | 5.85% | 0.19% (+5.65)#12 | 0.50% (+5.34)#276 |
| 13. | St James | 4.81% | 0.19% (+4.62)#13 | 0.50% (+4.31)#338 |
| 14. | Mountain Lake | 4.63% | 0.19% (+4.44)#14 | 0.50% (+4.13)#351 |
| 15. | Henning | 3.50% | 0.19% (+3.31)#15 | 0.50% (+3.00)#491 |
| 16. | Medford | 2.70% | 0.19% (+2.51)#16 | 0.50% (+2.20)#645 |
| 17. | Odin | 2.67% | 0.19% (+2.47)#17 | 0.50% (+2.16)#654 |
| 18. | Monticello | 2.66% | 0.19% (+2.47)#18 | 0.50% (+2.16)#655 |
| 19. | Park Rapids | 2.47% | 0.19% (+2.28)#19 | 0.50% (+1.97)#707 |
| 20. | Lake City | 2.47% | 0.19% (+2.27)#20 | 0.50% (+1.96)#710 |
| 21. | Landfall | 2.27% | 0.19% (+2.08)#21 | 0.50% (+1.77)#764 |
| 22. | Beaver Creek | 2.26% | 0.19% (+2.06)#22 | 0.50% (+1.75)#773 |
| 23. | Slayton | 2.14% | 0.19% (+1.95)#23 | 0.50% (+1.64)#800 |
| 24. | Benson | 2.09% | 0.19% (+1.89)#24 | 0.50% (+1.58)#817 |
| 25. | St Augusta | 2.05% | 0.19% (+1.85)#25 | 0.50% (+1.54)#827 |
| 26. | Lake Benton | 1.82% | 0.19% (+1.63)#26 | 0.50% (+1.32)#910 |
| 27. | Hanley Falls | 1.74% | 0.19% (+1.55)#27 | 0.50% (+1.24)#949 |
| 28. | St Peter | 1.54% | 0.19% (+1.34)#28 | 0.50% (+1.03)#1,051 |
| 29. | Ashby | 1.51% | 0.19% (+1.31)#29 | 0.50% (+1.00)#1,070 |
| 30. | Pelican Rapids | 1.51% | 0.19% (+1.31)#30 | 0.50% (+1.00)#1,071 |
| 31. | Willmar | 1.50% | 0.19% (+1.31)#31 | 0.50% (+1.00)#1,072 |
| 32. | Baxter | 1.48% | 0.19% (+1.28)#32 | 0.50% (+0.973)#1,091 |
| 33. | Plainview | 1.44% | 0.19% (+1.24)#33 | 0.50% (+0.934)#1,126 |
| 34. | Windom | 1.40% | 0.19% (+1.21)#34 | 0.50% (+0.901)#1,145 |
| 35. | Zumbrota | 1.38% | 0.19% (+1.18)#35 | 0.50% (+0.873)#1,166 |
| 36. | Brooklyn Center | 1.22% | 0.19% (+1.02)#36 | 0.50% (+0.713)#1,298 |
| 37. | Ely | 1.19% | 0.19% (+1.000)#37 | 0.50% (+0.690)#1,308 |
| 38. | Jasper | 1.19% | 0.19% (+0.992)#38 | 0.50% (+0.682)#1,322 |
| 39. | Red Wing | 1.18% | 0.19% (+0.984)#39 | 0.50% (+0.675)#1,327 |
| 40. | Chandler | 1.11% | 0.19% (+0.919)#40 | 0.50% (+0.610)#1,390 |
| 41. | North St Paul | 1.08% | 0.19% (+0.880)#41 | 0.50% (+0.571)#1,427 |
| 42. | Grand Meadow | 1.05% | 0.19% (+0.854)#42 | 0.50% (+0.545)#1,458 |
| 43. | North Branch | 1.05% | 0.19% (+0.854)#43 | 0.50% (+0.544)#1,460 |
| 44. | Welcome | 0.97% | 0.19% (+0.776)#44 | 0.50% (+0.467)#1,534 |
| 45. | Jeffers | 0.93% | 0.19% (+0.731)#45 | 0.50% (+0.422)#1,590 |
| 46. | Spring Lake Park | 0.88% | 0.19% (+0.681)#46 | 0.50% (+0.372)#1,650 |
| 47. | Grand Marais | 0.85% | 0.19% (+0.654)#47 | 0.50% (+0.344)#1,694 |
| 48. | Atwater | 0.83% | 0.19% (+0.632)#48 | 0.50% (+0.322)#1,728 |
| 49. | Madelia | 0.81% | 0.19% (+0.613)#49 | 0.50% (+0.304)#1,755 |
| 50. | Deephaven | 0.80% | 0.19% (+0.610)#50 | 0.50% (+0.301)#1,759 |
| 51. | St Charles | 0.80% | 0.19% (+0.609)#51 | 0.50% (+0.300)#1,760 |
| 52. | West Concord | 0.80% | 0.19% (+0.607)#52 | 0.50% (+0.298)#1,766 |
| 53. | Delano | 0.80% | 0.19% (+0.600)#53 | 0.50% (+0.291)#1,772 |
| 54. | Skyline | 0.74% | 0.19% (+0.546)#54 | 0.50% (+0.237)#1,857 |
| 55. | Balaton | 0.73% | 0.19% (+0.535)#55 | 0.50% (+0.226)#1,886 |
| 56. | Shakopee | 0.70% | 0.19% (+0.510)#56 | 0.50% (+0.201)#1,927 |
| 57. | The Lakes | 0.62% | 0.19% (+0.423)#57 | 0.50% (+0.114)#2,090 |
| 58. | Sauk Centre | 0.59% | 0.19% (+0.396)#58 | 0.50% (+0.087)#2,154 |
| 59. | Wanamingo | 0.59% | 0.19% (+0.394)#59 | 0.50% (+0.085)#2,160 |
| 60. | Renville | 0.57% | 0.19% (+0.378)#60 | 0.50% (+0.069)#2,196 |
| 61. | Chanhassen | 0.55% | 0.19% (+0.358)#61 | 0.50% (+0.049)#2,238 |
| 62. | Faribault | 0.54% | 0.19% (+0.350)#62 | 0.50% (+0.041)#2,259 |
| 63. | Sacred Heart | 0.50% | 0.19% (+0.308)#63 | 0.50% (-0.002)#2,376 |
| 64. | Heron Lake | 0.50% | 0.19% (+0.305)#64 | 0.50% (-0.004)#2,382 |
| 65. | Crown College | 0.46% | 0.19% (+0.267)#65 | 0.50% (-0.042)#2,492 |
| 66. | Morris | 0.45% | 0.19% (+0.257)#66 | 0.50% (-0.053)#2,528 |
| 67. | New Hope | 0.44% | 0.19% (+0.249)#67 | 0.50% (-0.060)#2,545 |
| 68. | Clarissa | 0.44% | 0.19% (+0.249)#68 | 0.50% (-0.060)#2,546 |
| 69. | Bethel | 0.43% | 0.19% (+0.231)#69 | 0.50% (-0.079)#2,607 |
| 70. | New Brighton | 0.41% | 0.19% (+0.220)#70 | 0.50% (-0.089)#2,636 |
| 71. | Austin | 0.41% | 0.19% (+0.214)#71 | 0.50% (-0.095)#2,655 |
| 72. | Dellwood | 0.41% | 0.19% (+0.212)#72 | 0.50% (-0.097)#2,659 |
| 73. | Thief River Falls | 0.37% | 0.19% (+0.177)#73 | 0.50% (-0.132)#2,791 |
| 74. | Waconia | 0.35% | 0.19% (+0.159)#74 | 0.50% (-0.150)#2,872 |
| 75. | Maple Lake | 0.35% | 0.19% (+0.159)#75 | 0.50% (-0.150)#2,873 |
| 76. | Osakis | 0.35% | 0.19% (+0.157)#76 | 0.50% (-0.152)#2,884 |
| 77. | Granite Falls | 0.33% | 0.19% (+0.135)#77 | 0.50% (-0.174)#2,972 |
| 78. | Richfield | 0.32% | 0.19% (+0.128)#78 | 0.50% (-0.181)#2,994 |
| 79. | Two Harbors | 0.30% | 0.19% (+0.109)#79 | 0.50% (-0.200)#3,095 |
| 80. | Kasota | 0.29% | 0.19% (+0.096)#80 | 0.50% (-0.213)#3,160 |
| 81. | Kimball | 0.29% | 0.19% (+0.093)#81 | 0.50% (-0.217)#3,173 |
| 82. | Litchfield | 0.27% | 0.19% (+0.078)#82 | 0.50% (-0.231)#3,244 |
| 83. | Duluth | 0.27% | 0.19% (+0.077)#83 | 0.50% (-0.232)#3,248 |
| 84. | Cottage Grove | 0.27% | 0.19% (+0.073)#84 | 0.50% (-0.237)#3,276 |
| 85. | Minnetonka | 0.27% | 0.19% (+0.072)#85 | 0.50% (-0.237)#3,279 |
| 86. | Hastings | 0.26% | 0.19% (+0.068)#86 | 0.50% (-0.241)#3,308 |
| 87. | Kasson | 0.26% | 0.19% (+0.068)#87 | 0.50% (-0.242)#3,311 |
| 88. | Waubun | 0.25% | 0.19% (+0.058)#88 | 0.50% (-0.251)#3,346 |
| 89. | Minneapolis | 0.25% | 0.19% (+0.054)#89 | 0.50% (-0.256)#3,379 |
| 90. | Plymouth | 0.24% | 0.19% (+0.049)#90 | 0.50% (-0.260)#3,408 |
| 91. | Inver Grove Heights | 0.24% | 0.19% (+0.046)#91 | 0.50% (-0.263)#3,424 |
| 92. | Oronoco | 0.24% | 0.19% (+0.041)#92 | 0.50% (-0.268)#3,457 |
| 93. | Rogers | 0.23% | 0.19% (+0.031)#93 | 0.50% (-0.278)#3,515 |
| 94. | Cook | 0.22% | 0.19% (+0.023)#94 | 0.50% (-0.286)#3,555 |
| 95. | Arden Hills | 0.21% | 0.19% (+0.019)#95 | 0.50% (-0.290)#3,579 |
| 96. | Forest Lake | 0.21% | 0.19% (+0.019)#96 | 0.50% (-0.290)#3,580 |
| 97. | Mounds View | 0.21% | 0.19% (+0.019)#97 | 0.50% (-0.290)#3,583 |
| 98. | Lakeville | 0.21% | 0.19% (+0.019)#98 | 0.50% (-0.291)#3,584 |
| 99. | South St Paul | 0.21% | 0.19% (+0.014)#99 | 0.50% (-0.295)#3,613 |
| 100. | Wadena | 0.21% | 0.19% (+0.013)#100 | 0.50% (-0.296)#3,617 |
Common Questions
What are the Top 10 Cities with the Highest Percentage of Guatemalan Population in Minnesota?
Top 10 Cities with the Highest Percentage of Guatemalan Population in Minnesota are:
#1
38.10%
#2
23.37%
#3
23.29%
#4
13.66%
#5
13.36%
#6
13.30%
#7
12.77%
#8
8.90%
#9
6.49%
#10
6.03%
What city has the Highest Percentage of Guatemalan Population in Minnesota?
Wilder has the Highest Percentage of Guatemalan Population in Minnesota with 38.10%.
What is the Percentage of Guatemalan Population in the State of Minnesota?
Percentage of Guatemalan Population in Minnesota is 0.19%.
What is the Percentage of Guatemalan Population in the United States?
Percentage of Guatemalan Population in the United States is 0.50%.