Cities with the Highest Percentage of Guatemalan Population in Missouri
RELATED REPORTS & OPTIONS
Guatemalan
Missouri
Compare Cities
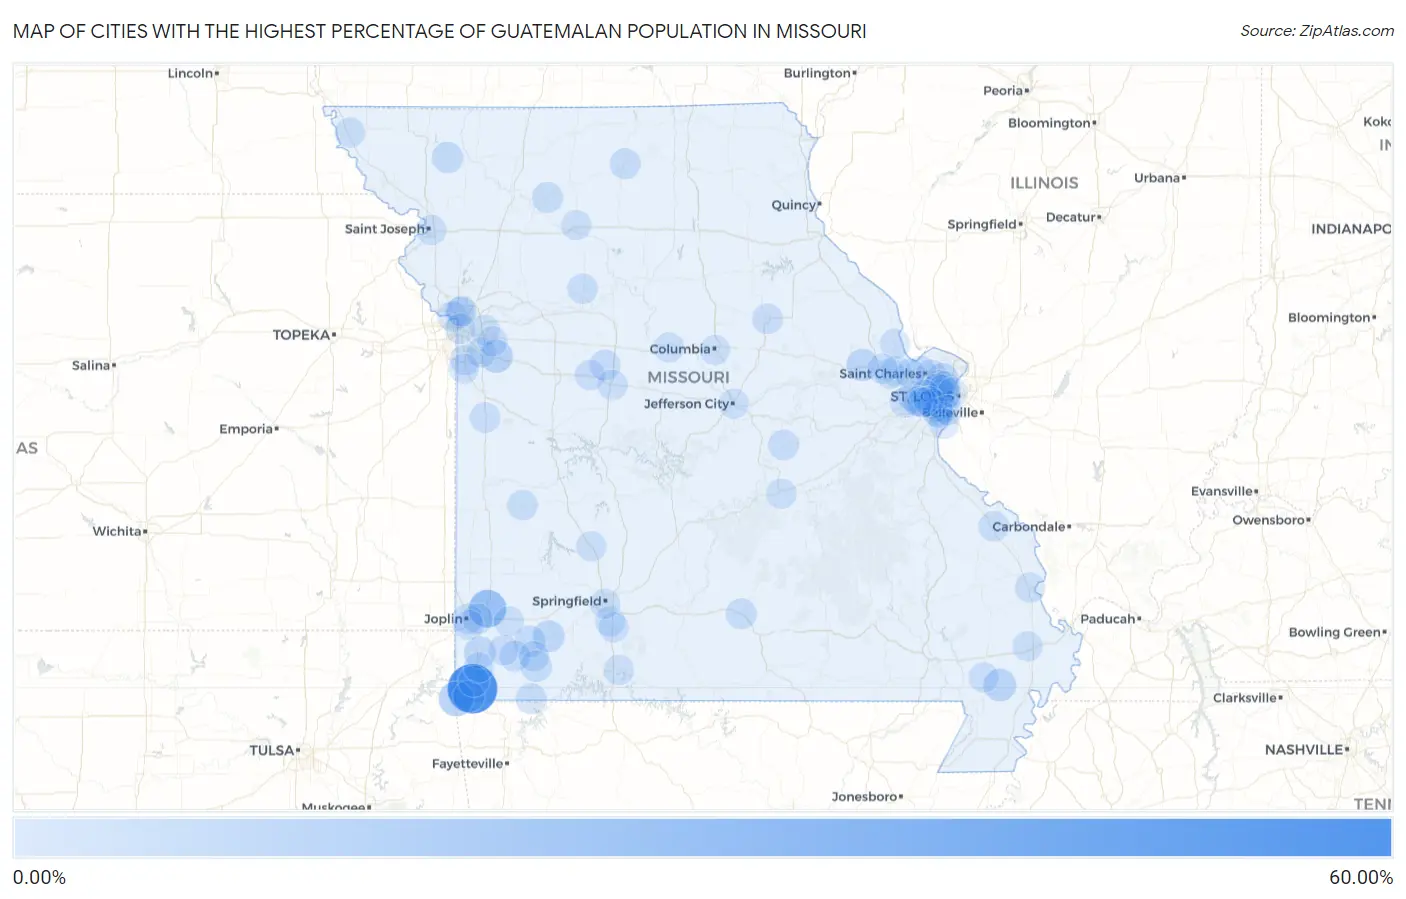
Map of Cities with the Highest Percentage of Guatemalan Population in Missouri
0.00%
60.00%
Cities with the Highest Percentage of Guatemalan Population in Missouri
| City | Guatemalan | vs State | vs National | |
| 1. | Ginger Blue | 52.21% | 0.19%(+52.0)#1 | 0.50%(+51.7)#6 |
| 2. | Carthage | 19.60% | 0.19%(+19.4)#2 | 0.50%(+19.1)#42 |
| 3. | Southwest City | 12.45% | 0.19%(+12.3)#3 | 0.50%(+11.9)#94 |
| 4. | Lake Lotawana | 7.46% | 0.19%(+7.27)#4 | 0.50%(+6.95)#192 |
| 5. | Parma | 6.27% | 0.19%(+6.08)#5 | 0.50%(+5.77)#244 |
| 6. | Wright City | 5.36% | 0.19%(+5.17)#6 | 0.50%(+4.86)#298 |
| 7. | Neosho | 4.32% | 0.19%(+4.13)#7 | 0.50%(+3.81)#387 |
| 8. | Verona | 4.18% | 0.19%(+3.99)#8 | 0.50%(+3.68)#406 |
| 9. | Berkeley | 4.07% | 0.19%(+3.88)#9 | 0.50%(+3.57)#422 |
| 10. | Noel | 3.73% | 0.19%(+3.54)#10 | 0.50%(+3.23)#457 |
| 11. | Conception | 3.01% | 0.19%(+2.82)#11 | 0.50%(+2.50)#566 |
| 12. | Monett | 2.98% | 0.19%(+2.79)#12 | 0.50%(+2.48)#571 |
| 13. | Butterfield | 2.94% | 0.19%(+2.74)#13 | 0.50%(+2.43)#588 |
| 14. | Anderson | 2.50% | 0.19%(+2.31)#14 | 0.50%(+1.99)#700 |
| 15. | Seligman | 1.99% | 0.19%(+1.80)#15 | 0.50%(+1.48)#851 |
| 16. | Jamesport | 1.92% | 0.19%(+1.73)#16 | 0.50%(+1.42)#875 |
| 17. | Bridgeton | 1.85% | 0.19%(+1.66)#17 | 0.50%(+1.34)#896 |
| 18. | Cabool | 1.81% | 0.19%(+1.62)#18 | 0.50%(+1.30)#916 |
| 19. | Fairview | 1.76% | 0.19%(+1.57)#19 | 0.50%(+1.25)#939 |
| 20. | Milan | 1.66% | 0.19%(+1.47)#20 | 0.50%(+1.16)#988 |
| 21. | Hughesville | 1.32% | 0.19%(+1.12)#21 | 0.50%(+0.812)#1,208 |
| 22. | Mexico | 1.30% | 0.19%(+1.10)#22 | 0.50%(+0.791)#1,227 |
| 23. | Belle | 1.28% | 0.19%(+1.09)#23 | 0.50%(+0.777)#1,234 |
| 24. | Oakwood | 1.23% | 0.19%(+1.04)#24 | 0.50%(+0.723)#1,283 |
| 25. | El Dorado Springs | 0.96% | 0.19%(+0.772)#25 | 0.50%(+0.459)#1,547 |
| 26. | Joplin | 0.94% | 0.19%(+0.747)#26 | 0.50%(+0.433)#1,573 |
| 27. | Clarkson Valley | 0.92% | 0.19%(+0.729)#27 | 0.50%(+0.416)#1,598 |
| 28. | Grandview | 0.78% | 0.19%(+0.588)#28 | 0.50%(+0.275)#1,783 |
| 29. | Archie | 0.77% | 0.19%(+0.583)#29 | 0.50%(+0.270)#1,791 |
| 30. | Carrollton | 0.69% | 0.19%(+0.504)#30 | 0.50%(+0.191)#1,943 |
| 31. | Stark City | 0.69% | 0.19%(+0.504)#31 | 0.50%(+0.190)#1,945 |
| 32. | Affton | 0.67% | 0.19%(+0.482)#32 | 0.50%(+0.169)#1,970 |
| 33. | Riverside | 0.65% | 0.19%(+0.456)#33 | 0.50%(+0.143)#2,030 |
| 34. | Purdy | 0.51% | 0.19%(+0.319)#34 | 0.50%(+0.005)#2,352 |
| 35. | Duenweg | 0.50% | 0.19%(+0.308)#35 | 0.50%(-0.005)#2,387 |
| 36. | La Monte | 0.49% | 0.19%(+0.295)#36 | 0.50%(-0.018)#2,419 |
| 37. | Winchester | 0.46% | 0.19%(+0.264)#37 | 0.50%(-0.049)#2,512 |
| 38. | Crestwood | 0.45% | 0.19%(+0.264)#38 | 0.50%(-0.049)#2,516 |
| 39. | Sappington | 0.45% | 0.19%(+0.264)#39 | 0.50%(-0.049)#2,517 |
| 40. | Perryville | 0.45% | 0.19%(+0.254)#40 | 0.50%(-0.059)#2,542 |
| 41. | Sedalia | 0.43% | 0.19%(+0.241)#41 | 0.50%(-0.072)#2,582 |
| 42. | Rock Hill | 0.40% | 0.19%(+0.211)#42 | 0.50%(-0.102)#2,681 |
| 43. | Kansas City | 0.34% | 0.19%(+0.151)#43 | 0.50%(-0.163)#2,938 |
| 44. | Sycamore Hills | 0.32% | 0.19%(+0.131)#44 | 0.50%(-0.182)#3,001 |
| 45. | Rolla | 0.32% | 0.19%(+0.129)#45 | 0.50%(-0.185)#3,012 |
| 46. | Independence | 0.32% | 0.19%(+0.127)#46 | 0.50%(-0.186)#3,017 |
| 47. | Clayton | 0.30% | 0.19%(+0.105)#47 | 0.50%(-0.208)#3,134 |
| 48. | St Charles | 0.29% | 0.19%(+0.102)#48 | 0.50%(-0.211)#3,152 |
| 49. | Sarcoxie | 0.27% | 0.19%(+0.082)#49 | 0.50%(-0.231)#3,240 |
| 50. | Goodman | 0.25% | 0.19%(+0.058)#50 | 0.50%(-0.256)#3,378 |
| 51. | O Fallon | 0.24% | 0.19%(+0.053)#51 | 0.50%(-0.260)#3,409 |
| 52. | Fremont Hills | 0.24% | 0.19%(+0.045)#52 | 0.50%(-0.268)#3,458 |
| 53. | Winfield | 0.23% | 0.19%(+0.041)#53 | 0.50%(-0.272)#3,480 |
| 54. | Bolivar | 0.23% | 0.19%(+0.041)#54 | 0.50%(-0.272)#3,483 |
| 55. | Lake St Louis | 0.21% | 0.19%(+0.020)#55 | 0.50%(-0.293)#3,600 |
| 56. | Bernie | 0.21% | 0.19%(+0.018)#56 | 0.50%(-0.295)#3,612 |
| 57. | Boonville | 0.19% | 0.19%(+0.003)#57 | 0.50%(-0.310)#3,703 |
| 58. | St Joseph | 0.19% | 0.19%(+0.000)#58 | 0.50%(-0.313)#3,723 |
| 59. | Cape Girardeau | 0.18% | 0.19%(-0.012)#59 | 0.50%(-0.326)#3,805 |
| 60. | Olivette | 0.18% | 0.19%(-0.013)#60 | 0.50%(-0.326)#3,807 |
| 61. | University City | 0.18% | 0.19%(-0.013)#61 | 0.50%(-0.326)#3,808 |
| 62. | Ozark | 0.16% | 0.19%(-0.028)#62 | 0.50%(-0.341)#3,903 |
| 63. | Wildwood | 0.16% | 0.19%(-0.029)#63 | 0.50%(-0.343)#3,912 |
| 64. | Leawood | 0.14% | 0.19%(-0.046)#64 | 0.50%(-0.360)#4,014 |
| 65. | Kirkwood | 0.12% | 0.19%(-0.068)#65 | 0.50%(-0.381)#4,162 |
| 66. | Greendale | 0.12% | 0.19%(-0.071)#66 | 0.50%(-0.384)#4,184 |
| 67. | Sikeston | 0.11% | 0.19%(-0.079)#67 | 0.50%(-0.393)#4,264 |
| 68. | St Peters | 0.10% | 0.19%(-0.089)#68 | 0.50%(-0.402)#4,338 |
| 69. | Town And Country | 0.095% | 0.19%(-0.096)#69 | 0.50%(-0.409)#4,396 |
| 70. | Merriam Woods | 0.093% | 0.19%(-0.098)#70 | 0.50%(-0.411)#4,409 |
| 71. | Gladstone | 0.085% | 0.19%(-0.106)#71 | 0.50%(-0.419)#4,461 |
| 72. | Concord | 0.081% | 0.19%(-0.110)#72 | 0.50%(-0.423)#4,511 |
| 73. | Rock Port | 0.078% | 0.19%(-0.112)#73 | 0.50%(-0.426)#4,534 |
| 74. | Columbia | 0.067% | 0.19%(-0.123)#74 | 0.50%(-0.437)#4,652 |
| 75. | Wentzville | 0.063% | 0.19%(-0.128)#75 | 0.50%(-0.441)#4,685 |
| 76. | Lee S Summit | 0.056% | 0.19%(-0.135)#76 | 0.50%(-0.448)#4,734 |
| 77. | Chillicothe | 0.055% | 0.19%(-0.136)#77 | 0.50%(-0.449)#4,741 |
| 78. | St Louis | 0.054% | 0.19%(-0.137)#78 | 0.50%(-0.450)#4,746 |
| 79. | Springfield | 0.038% | 0.19%(-0.153)#79 | 0.50%(-0.466)#4,866 |
| 80. | Lemay | 0.037% | 0.19%(-0.154)#80 | 0.50%(-0.467)#4,874 |
| 81. | Ballwin | 0.036% | 0.19%(-0.155)#81 | 0.50%(-0.469)#4,881 |
| 82. | Oakville | 0.034% | 0.19%(-0.157)#82 | 0.50%(-0.470)#4,891 |
| 83. | Belton | 0.029% | 0.19%(-0.162)#83 | 0.50%(-0.475)#4,925 |
| 84. | Blue Springs | 0.026% | 0.19%(-0.165)#84 | 0.50%(-0.479)#4,959 |
| 85. | Des Peres | 0.022% | 0.19%(-0.169)#85 | 0.50%(-0.482)#4,994 |
| 86. | Manchester | 0.016% | 0.19%(-0.174)#86 | 0.50%(-0.488)#5,045 |
| 87. | Jefferson City | 0.0047% | 0.19%(-0.186)#87 | 0.50%(-0.499)#5,133 |
Common Questions
What are the Top 10 Cities with the Highest Percentage of Guatemalan Population in Missouri?
Top 10 Cities with the Highest Percentage of Guatemalan Population in Missouri are:
#1
52.21%
#2
19.60%
#3
12.45%
#4
7.46%
#5
6.27%
#6
5.36%
#7
4.32%
#8
4.18%
#9
4.07%
#10
3.73%
What city has the Highest Percentage of Guatemalan Population in Missouri?
Ginger Blue has the Highest Percentage of Guatemalan Population in Missouri with 52.21%.
What is the Percentage of Guatemalan Population in the State of Missouri?
Percentage of Guatemalan Population in Missouri is 0.19%.
What is the Percentage of Guatemalan Population in the United States?
Percentage of Guatemalan Population in the United States is 0.50%.