Cities with the Highest Percentage of Guatemalan Population in Indiana
RELATED REPORTS & OPTIONS
Guatemalan
Indiana
Compare Cities
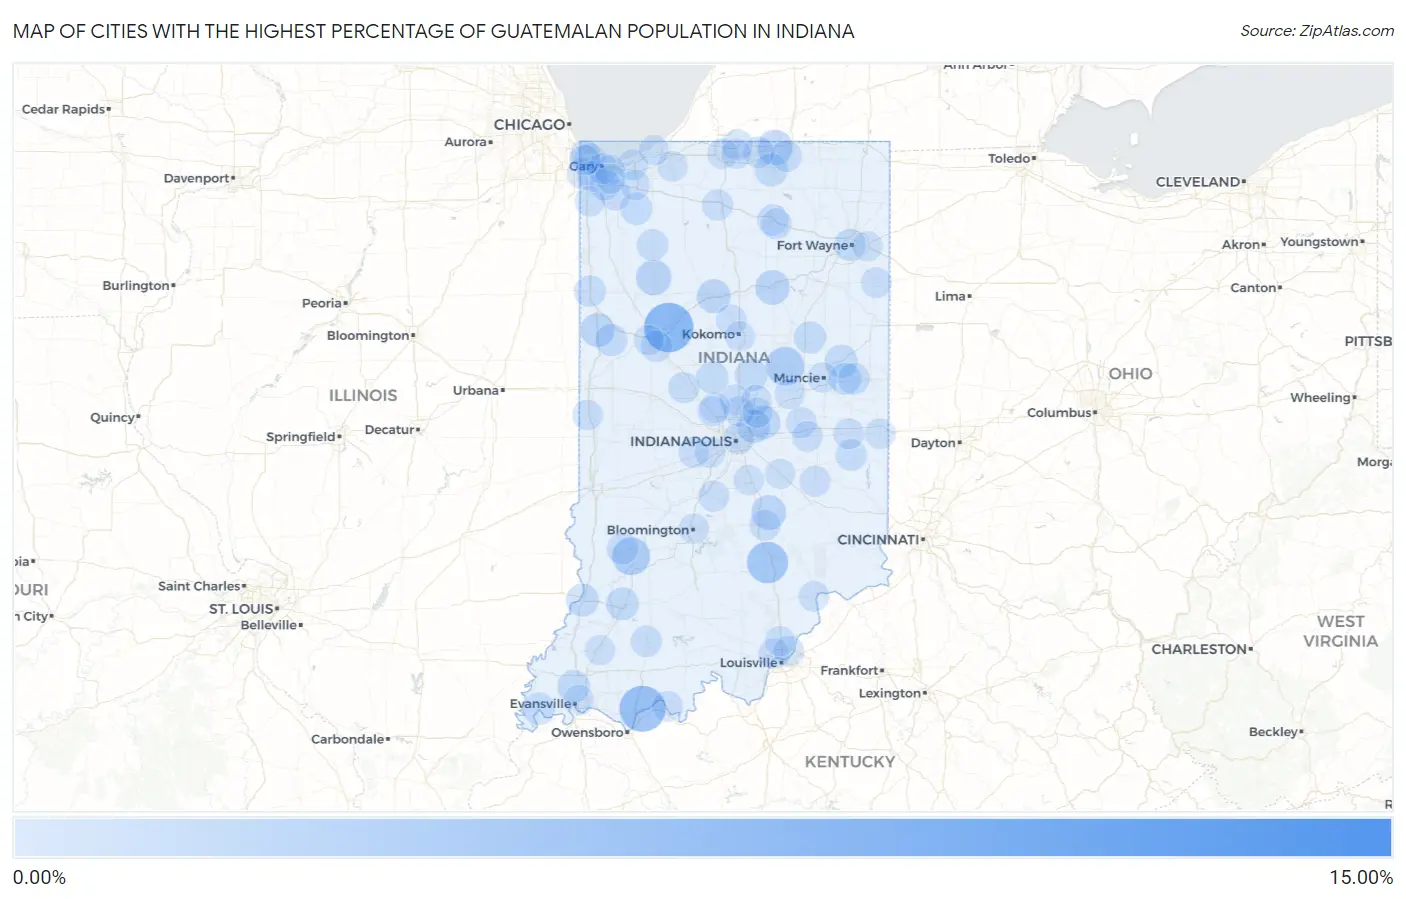
Map of Cities with the Highest Percentage of Guatemalan Population in Indiana
0.00%
15.00%
Cities with the Highest Percentage of Guatemalan Population in Indiana
| City | Guatemalan | vs State | vs National | |
| 1. | Young America | 13.33% | 0.19%(+13.1)#1 | 0.50%(+12.8)#81 |
| 2. | Americus | 6.64% | 0.19%(+6.45)#2 | 0.50%(+6.14)#226 |
| 3. | Grandview | 5.45% | 0.19%(+5.26)#3 | 0.50%(+4.95)#293 |
| 4. | Seymour | 3.80% | 0.19%(+3.61)#4 | 0.50%(+3.30)#449 |
| 5. | Orestes | 2.83% | 0.19%(+2.63)#5 | 0.50%(+2.32)#612 |
| 6. | Lyons | 2.62% | 0.19%(+2.42)#6 | 0.50%(+2.11)#664 |
| 7. | Monon | 1.81% | 0.19%(+1.62)#7 | 0.50%(+1.31)#912 |
| 8. | Bristol | 1.77% | 0.19%(+1.58)#8 | 0.50%(+1.27)#932 |
| 9. | Clifford | 1.59% | 0.19%(+1.40)#9 | 0.50%(+1.09)#1,020 |
| 10. | Wabash | 1.52% | 0.19%(+1.32)#10 | 0.50%(+1.01)#1,066 |
| 11. | Boswell | 1.29% | 0.19%(+1.10)#11 | 0.50%(+0.789)#1,230 |
| 12. | Logansport | 1.27% | 0.19%(+1.07)#12 | 0.50%(+0.762)#1,242 |
| 13. | Mccordsville | 1.12% | 0.19%(+0.927)#13 | 0.50%(+0.617)#1,384 |
| 14. | Lawrence | 1.10% | 0.19%(+0.901)#14 | 0.50%(+0.591)#1,407 |
| 15. | Goshen | 0.96% | 0.19%(+0.762)#15 | 0.50%(+0.453)#1,554 |
| 16. | Albany | 0.95% | 0.19%(+0.752)#16 | 0.50%(+0.442)#1,567 |
| 17. | Vincennes | 0.93% | 0.19%(+0.739)#17 | 0.50%(+0.429)#1,579 |
| 18. | Washington | 0.91% | 0.19%(+0.716)#18 | 0.50%(+0.407)#1,607 |
| 19. | Atlanta | 0.91% | 0.19%(+0.711)#19 | 0.50%(+0.401)#1,612 |
| 20. | Mineral Springs | 0.87% | 0.19%(+0.674)#20 | 0.50%(+0.364)#1,661 |
| 21. | Floyds Knobs | 0.81% | 0.19%(+0.614)#21 | 0.50%(+0.305)#1,753 |
| 22. | Darmstadt | 0.79% | 0.19%(+0.599)#22 | 0.50%(+0.289)#1,775 |
| 23. | Mount Vernon | 0.74% | 0.19%(+0.546)#23 | 0.50%(+0.237)#1,856 |
| 24. | Pine Village | 0.74% | 0.19%(+0.544)#24 | 0.50%(+0.234)#1,862 |
| 25. | Kouts | 0.72% | 0.19%(+0.527)#25 | 0.50%(+0.217)#1,898 |
| 26. | Upland | 0.71% | 0.19%(+0.512)#26 | 0.50%(+0.202)#1,922 |
| 27. | Kirklin | 0.69% | 0.19%(+0.499)#27 | 0.50%(+0.190)#1,946 |
| 28. | Parker City | 0.67% | 0.19%(+0.479)#28 | 0.50%(+0.170)#1,968 |
| 29. | Fort Wayne | 0.65% | 0.19%(+0.455)#29 | 0.50%(+0.145)#2,023 |
| 30. | Farmland | 0.62% | 0.19%(+0.422)#30 | 0.50%(+0.112)#2,097 |
| 31. | Lafayette | 0.53% | 0.19%(+0.334)#31 | 0.50%(+0.024)#2,303 |
| 32. | Medaryville | 0.51% | 0.19%(+0.318)#32 | 0.50%(+0.009)#2,344 |
| 33. | Kentland | 0.50% | 0.19%(+0.303)#33 | 0.50%(-0.007)#2,392 |
| 34. | Linton | 0.49% | 0.19%(+0.291)#34 | 0.50%(-0.019)#2,421 |
| 35. | Middlebury | 0.44% | 0.19%(+0.241)#35 | 0.50%(-0.069)#2,572 |
| 36. | Jasper | 0.43% | 0.19%(+0.236)#36 | 0.50%(-0.073)#2,590 |
| 37. | Connersville | 0.42% | 0.19%(+0.224)#37 | 0.50%(-0.086)#2,629 |
| 38. | Indianapolis | 0.39% | 0.19%(+0.191)#38 | 0.50%(-0.118)#2,740 |
| 39. | Thorntown | 0.36% | 0.19%(+0.163)#39 | 0.50%(-0.147)#2,851 |
| 40. | Elkhart | 0.35% | 0.19%(+0.157)#40 | 0.50%(-0.153)#2,886 |
| 41. | Cambridge City | 0.34% | 0.19%(+0.144)#41 | 0.50%(-0.165)#2,948 |
| 42. | Tell City | 0.32% | 0.19%(+0.127)#42 | 0.50%(-0.183)#3,005 |
| 43. | Chesterton | 0.32% | 0.19%(+0.123)#43 | 0.50%(-0.187)#3,026 |
| 44. | Warsaw | 0.32% | 0.19%(+0.121)#44 | 0.50%(-0.188)#3,037 |
| 45. | Painted Hills | 0.30% | 0.19%(+0.107)#45 | 0.50%(-0.203)#3,107 |
| 46. | Columbus | 0.30% | 0.19%(+0.106)#46 | 0.50%(-0.203)#3,111 |
| 47. | Plymouth | 0.30% | 0.19%(+0.104)#47 | 0.50%(-0.205)#3,118 |
| 48. | Milroy | 0.30% | 0.19%(+0.103)#48 | 0.50%(-0.206)#3,124 |
| 49. | Lakes Of The Four Seasons | 0.26% | 0.19%(+0.069)#49 | 0.50%(-0.241)#3,299 |
| 50. | Granger | 0.25% | 0.19%(+0.059)#50 | 0.50%(-0.251)#3,345 |
| 51. | Westfield | 0.24% | 0.19%(+0.048)#51 | 0.50%(-0.262)#3,419 |
| 52. | Munster | 0.24% | 0.19%(+0.046)#52 | 0.50%(-0.264)#3,428 |
| 53. | East Chicago | 0.22% | 0.19%(+0.029)#53 | 0.50%(-0.280)#3,530 |
| 54. | Galveston | 0.22% | 0.19%(+0.028)#54 | 0.50%(-0.282)#3,538 |
| 55. | Winona Lake | 0.20% | 0.19%(+0.002)#55 | 0.50%(-0.307)#3,680 |
| 56. | Decatur | 0.20% | 0.19%(+0.001)#56 | 0.50%(-0.309)#3,695 |
| 57. | Shirley | 0.19% | 0.19%(+0.000)#58 | 0.50%(-0.309)#3,699 |
| 58. | Clayton | 0.19% | 0.19%(+0.000)#59 | 0.50%(-0.309)#3,700 |
| 59. | New Albany | 0.19% | 0.19%(-0.008)#60 | 0.50%(-0.318)#3,754 |
| 60. | Carmel | 0.18% | 0.19%(-0.010)#61 | 0.50%(-0.320)#3,763 |
| 61. | Knightstown | 0.18% | 0.19%(-0.011)#62 | 0.50%(-0.320)#3,764 |
| 62. | Whiting | 0.17% | 0.19%(-0.020)#63 | 0.50%(-0.329)#3,824 |
| 63. | Cayuga | 0.17% | 0.19%(-0.022)#64 | 0.50%(-0.331)#3,838 |
| 64. | Merrillville | 0.17% | 0.19%(-0.026)#65 | 0.50%(-0.336)#3,868 |
| 65. | Griffith | 0.17% | 0.19%(-0.028)#66 | 0.50%(-0.337)#3,877 |
| 66. | Hammond | 0.16% | 0.19%(-0.038)#67 | 0.50%(-0.348)#3,940 |
| 67. | Jeffersonville | 0.14% | 0.19%(-0.050)#68 | 0.50%(-0.359)#4,012 |
| 68. | Gary | 0.14% | 0.19%(-0.051)#69 | 0.50%(-0.361)#4,024 |
| 69. | Hanover | 0.14% | 0.19%(-0.058)#70 | 0.50%(-0.368)#4,065 |
| 70. | Evansville | 0.12% | 0.19%(-0.076)#71 | 0.50%(-0.386)#4,206 |
| 71. | Plainfield | 0.11% | 0.19%(-0.080)#72 | 0.50%(-0.390)#4,239 |
| 72. | Zionsville | 0.11% | 0.19%(-0.081)#73 | 0.50%(-0.391)#4,247 |
| 73. | South Bend | 0.10% | 0.19%(-0.091)#74 | 0.50%(-0.400)#4,327 |
| 74. | Richmond | 0.10% | 0.19%(-0.093)#75 | 0.50%(-0.403)#4,348 |
| 75. | La Porte | 0.094% | 0.19%(-0.101)#76 | 0.50%(-0.410)#4,403 |
| 76. | Michigan City | 0.091% | 0.19%(-0.104)#77 | 0.50%(-0.413)#4,418 |
| 77. | Franklin | 0.088% | 0.19%(-0.106)#78 | 0.50%(-0.416)#4,434 |
| 78. | Oakland City | 0.083% | 0.19%(-0.112)#79 | 0.50%(-0.421)#4,487 |
| 79. | West Lafayette | 0.082% | 0.19%(-0.112)#80 | 0.50%(-0.422)#4,491 |
| 80. | Bloomington | 0.081% | 0.19%(-0.113)#81 | 0.50%(-0.423)#4,507 |
| 81. | Noblesville | 0.075% | 0.19%(-0.119)#82 | 0.50%(-0.429)#4,572 |
| 82. | Lake Station | 0.075% | 0.19%(-0.120)#83 | 0.50%(-0.429)#4,577 |
| 83. | Anderson | 0.075% | 0.19%(-0.120)#84 | 0.50%(-0.430)#4,584 |
| 84. | Hobart | 0.071% | 0.19%(-0.123)#85 | 0.50%(-0.433)#4,611 |
| 85. | Fishers | 0.068% | 0.19%(-0.127)#86 | 0.50%(-0.436)#4,647 |
| 86. | Valparaiso | 0.062% | 0.19%(-0.133)#87 | 0.50%(-0.442)#4,695 |
| 87. | Kokomo | 0.060% | 0.19%(-0.134)#88 | 0.50%(-0.444)#4,705 |
| 88. | Shelbyville | 0.051% | 0.19%(-0.144)#89 | 0.50%(-0.453)#4,766 |
| 89. | Muncie | 0.045% | 0.19%(-0.150)#90 | 0.50%(-0.460)#4,811 |
| 90. | Whitestown | 0.039% | 0.19%(-0.155)#91 | 0.50%(-0.465)#4,860 |
| 91. | New Haven | 0.032% | 0.19%(-0.162)#92 | 0.50%(-0.472)#4,906 |
| 92. | Cedar Lake | 0.028% | 0.19%(-0.166)#93 | 0.50%(-0.476)#4,934 |
| 93. | Mishawaka | 0.028% | 0.19%(-0.167)#94 | 0.50%(-0.477)#4,940 |
| 94. | Sellersburg | 0.010% | 0.19%(-0.184)#95 | 0.50%(-0.494)#5,097 |
Common Questions
What are the Top 10 Cities with the Highest Percentage of Guatemalan Population in Indiana?
Top 10 Cities with the Highest Percentage of Guatemalan Population in Indiana are:
What city has the Highest Percentage of Guatemalan Population in Indiana?
Americus has the Highest Percentage of Guatemalan Population in Indiana with 6.64%.
What is the Percentage of Guatemalan Population in the State of Indiana?
Percentage of Guatemalan Population in Indiana is 0.19%.
What is the Percentage of Guatemalan Population in the United States?
Percentage of Guatemalan Population in the United States is 0.50%.