Cities with the Highest Percentage of Guatemalan Population in Massachusetts
RELATED REPORTS & OPTIONS
Guatemalan
Massachusetts
Compare Cities
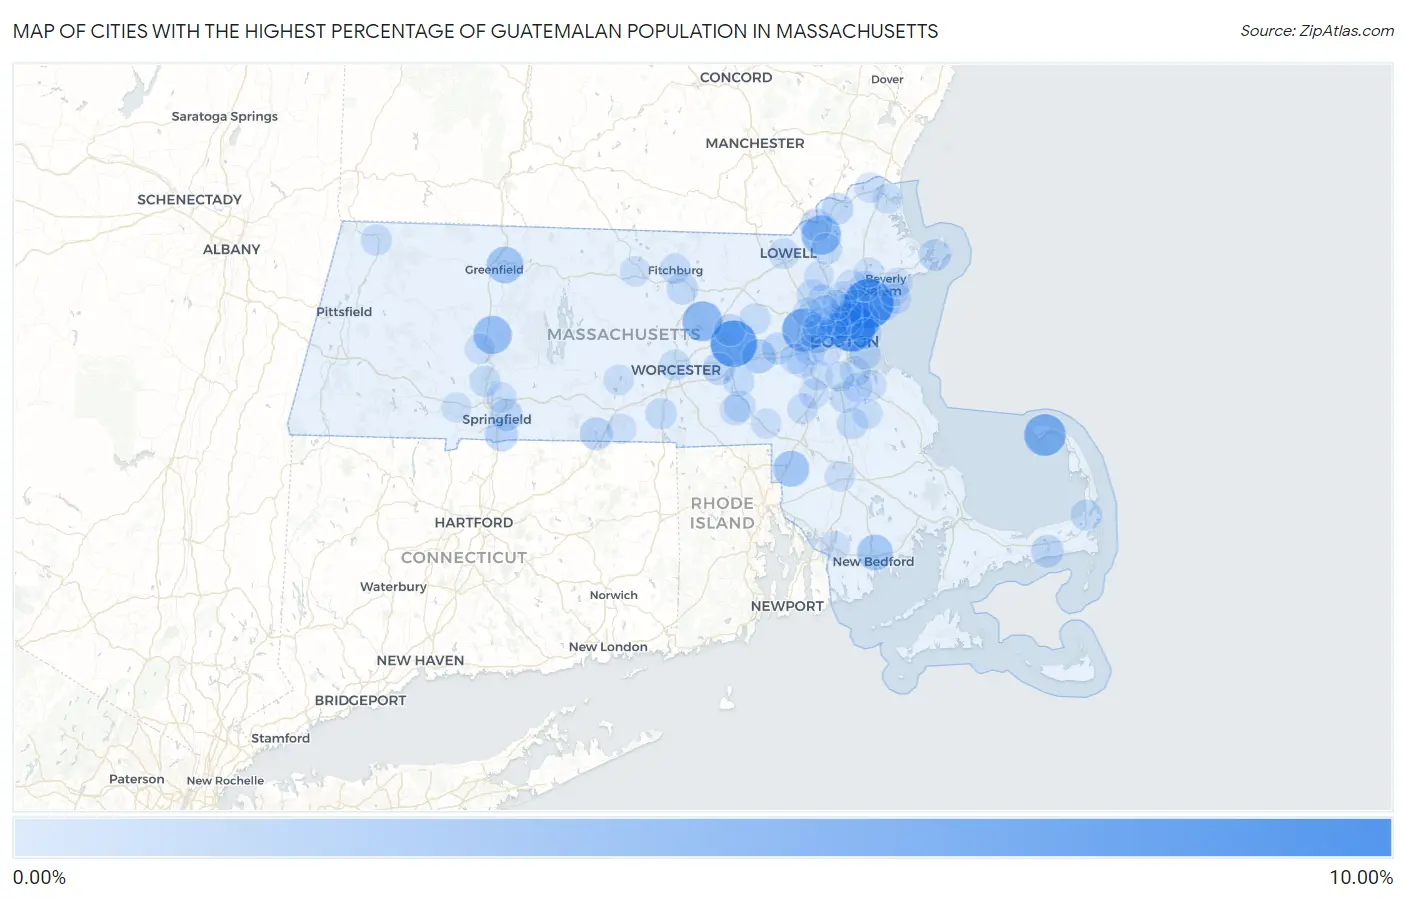
Map of Cities with the Highest Percentage of Guatemalan Population in Massachusetts
0.00%
10.00%
Cities with the Highest Percentage of Guatemalan Population in Massachusetts
| City | Guatemalan | vs State | vs National | |
| 1. | Lynn | 8.93% | 0.74%(+8.19)#1 | 0.50%(+8.43)#153 |
| 2. | Chelsea | 8.19% | 0.74%(+7.45)#2 | 0.50%(+7.69)#172 |
| 3. | Marlborough | 7.51% | 0.74%(+6.77)#3 | 0.50%(+7.00)#188 |
| 4. | Waltham | 5.93% | 0.74%(+5.20)#4 | 0.50%(+5.43)#267 |
| 5. | Provincetown | 5.27% | 0.74%(+4.54)#5 | 0.50%(+4.77)#306 |
| 6. | Clinton | 4.36% | 0.74%(+3.62)#6 | 0.50%(+3.86)#380 |
| 7. | Lawrence | 4.21% | 0.74%(+3.48)#7 | 0.50%(+3.71)#400 |
| 8. | Revere | 4.11% | 0.74%(+3.37)#8 | 0.50%(+3.60)#413 |
| 9. | Hatfield | 3.61% | 0.74%(+2.87)#9 | 0.50%(+3.10)#474 |
| 10. | Turners Falls | 2.94% | 0.74%(+2.21)#10 | 0.50%(+2.44)#584 |
| 11. | Attleboro | 2.61% | 0.74%(+1.88)#11 | 0.50%(+2.11)#665 |
| 12. | New Bedford | 2.48% | 0.74%(+1.75)#12 | 0.50%(+1.98)#704 |
| 13. | Framingham | 1.84% | 0.74%(+1.11)#13 | 0.50%(+1.34)#900 |
| 14. | Watertown Town | 1.48% | 0.74%(+0.739)#14 | 0.50%(+0.971)#1,093 |
| 15. | Saugus | 1.46% | 0.74%(+0.723)#15 | 0.50%(+0.956)#1,110 |
| 16. | Everett | 1.32% | 0.74%(+0.589)#16 | 0.50%(+0.821)#1,202 |
| 17. | Longmeadow | 1.24% | 0.74%(+0.505)#17 | 0.50%(+0.737)#1,263 |
| 18. | Holland | 1.17% | 0.74%(+0.434)#18 | 0.50%(+0.667)#1,333 |
| 19. | Methuen Town | 1.16% | 0.74%(+0.419)#19 | 0.50%(+0.651)#1,344 |
| 20. | Malden | 1.12% | 0.74%(+0.382)#20 | 0.50%(+0.614)#1,388 |
| 21. | West Dennis | 1.10% | 0.74%(+0.362)#21 | 0.50%(+0.594)#1,402 |
| 22. | Springfield | 1.04% | 0.74%(+0.307)#22 | 0.50%(+0.539)#1,466 |
| 23. | Westborough | 0.94% | 0.74%(+0.200)#23 | 0.50%(+0.432)#1,578 |
| 24. | Hudson | 0.91% | 0.74%(+0.174)#24 | 0.50%(+0.406)#1,608 |
| 25. | Gloucester | 0.86% | 0.74%(+0.125)#25 | 0.50%(+0.357)#1,672 |
| 26. | Melrose | 0.83% | 0.74%(+0.091)#26 | 0.50%(+0.324)#1,726 |
| 27. | Cochituate | 0.76% | 0.74%(+0.028)#27 | 0.50%(+0.260)#1,806 |
| 28. | Haverhill | 0.76% | 0.74%(+0.025)#28 | 0.50%(+0.257)#1,812 |
| 29. | Somerville | 0.75% | 0.74%(+0.009)#29 | 0.50%(+0.242)#1,842 |
| 30. | Boston | 0.73% | 0.74%(-0.005)#30 | 0.50%(+0.227)#1,881 |
| 31. | Leominster | 0.71% | 0.74%(-0.026)#31 | 0.50%(+0.207)#1,916 |
| 32. | Burlington | 0.66% | 0.74%(-0.075)#32 | 0.50%(+0.157)#1,988 |
| 33. | Oxford | 0.55% | 0.74%(-0.182)#33 | 0.50%(+0.050)#2,233 |
| 34. | Brockton | 0.55% | 0.74%(-0.182)#34 | 0.50%(+0.050)#2,235 |
| 35. | Andover | 0.54% | 0.74%(-0.195)#35 | 0.50%(+0.037)#2,271 |
| 36. | Orleans | 0.54% | 0.74%(-0.196)#36 | 0.50%(+0.036)#2,274 |
| 37. | Milford | 0.52% | 0.74%(-0.221)#37 | 0.50%(+0.011)#2,334 |
| 38. | Holyoke | 0.48% | 0.74%(-0.255)#38 | 0.50%(-0.023)#2,439 |
| 39. | Medford | 0.47% | 0.74%(-0.265)#39 | 0.50%(-0.033)#2,457 |
| 40. | Worcester | 0.46% | 0.74%(-0.274)#40 | 0.50%(-0.041)#2,486 |
| 41. | Winthrop Town | 0.46% | 0.74%(-0.274)#41 | 0.50%(-0.042)#2,487 |
| 42. | Maynard | 0.46% | 0.74%(-0.277)#42 | 0.50%(-0.045)#2,497 |
| 43. | Hopkinton | 0.45% | 0.74%(-0.281)#43 | 0.50%(-0.049)#2,515 |
| 44. | Swampscott | 0.45% | 0.74%(-0.287)#44 | 0.50%(-0.055)#2,535 |
| 45. | North Adams | 0.44% | 0.74%(-0.296)#45 | 0.50%(-0.064)#2,554 |
| 46. | Randolph Town | 0.41% | 0.74%(-0.330)#46 | 0.50%(-0.098)#2,661 |
| 47. | Lowell | 0.37% | 0.74%(-0.362)#47 | 0.50%(-0.129)#2,777 |
| 48. | Woburn | 0.35% | 0.74%(-0.385)#48 | 0.50%(-0.153)#2,888 |
| 49. | Hopedale | 0.34% | 0.74%(-0.398)#49 | 0.50%(-0.166)#2,950 |
| 50. | North Attleborough | 0.33% | 0.74%(-0.411)#50 | 0.50%(-0.179)#2,986 |
| 51. | Quincy | 0.31% | 0.74%(-0.421)#51 | 0.50%(-0.189)#3,041 |
| 52. | Fitchburg | 0.31% | 0.74%(-0.424)#52 | 0.50%(-0.192)#3,057 |
| 53. | Peabody | 0.29% | 0.74%(-0.449)#53 | 0.50%(-0.216)#3,171 |
| 54. | Walpole | 0.24% | 0.74%(-0.501)#54 | 0.50%(-0.269)#3,459 |
| 55. | Lynnfield | 0.22% | 0.74%(-0.512)#55 | 0.50%(-0.280)#3,528 |
| 56. | East Brookfield | 0.22% | 0.74%(-0.513)#56 | 0.50%(-0.281)#3,532 |
| 57. | Norwood | 0.22% | 0.74%(-0.519)#57 | 0.50%(-0.287)#3,559 |
| 58. | Dedham | 0.21% | 0.74%(-0.530)#58 | 0.50%(-0.297)#3,625 |
| 59. | Newton | 0.20% | 0.74%(-0.532)#59 | 0.50%(-0.299)#3,636 |
| 60. | Gardner | 0.20% | 0.74%(-0.532)#60 | 0.50%(-0.300)#3,644 |
| 61. | Weymouth Town | 0.20% | 0.74%(-0.536)#61 | 0.50%(-0.303)#3,659 |
| 62. | Wakefield | 0.20% | 0.74%(-0.540)#62 | 0.50%(-0.308)#3,691 |
| 63. | Needham | 0.19% | 0.74%(-0.542)#63 | 0.50%(-0.310)#3,704 |
| 64. | Amesbury Town | 0.19% | 0.74%(-0.551)#64 | 0.50%(-0.319)#3,760 |
| 65. | Taunton | 0.16% | 0.74%(-0.573)#65 | 0.50%(-0.341)#3,901 |
| 66. | Wellesley | 0.16% | 0.74%(-0.579)#66 | 0.50%(-0.347)#3,935 |
| 67. | Chicopee | 0.16% | 0.74%(-0.579)#67 | 0.50%(-0.347)#3,936 |
| 68. | Northampton | 0.15% | 0.74%(-0.584)#68 | 0.50%(-0.352)#3,965 |
| 69. | Brookline | 0.15% | 0.74%(-0.590)#69 | 0.50%(-0.357)#4,001 |
| 70. | Franklin Town | 0.14% | 0.74%(-0.596)#70 | 0.50%(-0.364)#4,037 |
| 71. | Newburyport | 0.11% | 0.74%(-0.622)#71 | 0.50%(-0.390)#4,238 |
| 72. | Cambridge | 0.11% | 0.74%(-0.623)#72 | 0.50%(-0.391)#4,246 |
| 73. | Abington | 0.11% | 0.74%(-0.625)#73 | 0.50%(-0.392)#4,262 |
| 74. | Marblehead | 0.098% | 0.74%(-0.638)#74 | 0.50%(-0.406)#4,367 |
| 75. | Greenfield | 0.096% | 0.74%(-0.640)#75 | 0.50%(-0.408)#4,384 |
| 76. | Stoneham | 0.087% | 0.74%(-0.649)#76 | 0.50%(-0.417)#4,445 |
| 77. | Fall River | 0.078% | 0.74%(-0.658)#77 | 0.50%(-0.426)#4,543 |
| 78. | Amherst | 0.078% | 0.74%(-0.658)#78 | 0.50%(-0.426)#4,546 |
| 79. | Arlington | 0.070% | 0.74%(-0.667)#79 | 0.50%(-0.434)#4,625 |
| 80. | Danvers | 0.068% | 0.74%(-0.668)#80 | 0.50%(-0.436)#4,645 |
| 81. | Milton | 0.067% | 0.74%(-0.670)#81 | 0.50%(-0.437)#4,656 |
| 82. | Braintree Town | 0.065% | 0.74%(-0.672)#82 | 0.50%(-0.440)#4,670 |
| 83. | Southbridge Town | 0.062% | 0.74%(-0.674)#83 | 0.50%(-0.442)#4,690 |
| 84. | Westfield | 0.051% | 0.74%(-0.685)#84 | 0.50%(-0.453)#4,763 |
| 85. | Belmont | 0.033% | 0.74%(-0.703)#85 | 0.50%(-0.471)#4,896 |
| 86. | Salem | 0.027% | 0.74%(-0.709)#86 | 0.50%(-0.477)#4,942 |
| 87. | Winchester | 0.026% | 0.74%(-0.710)#87 | 0.50%(-0.478)#4,947 |
| 88. | Lexington | 0.026% | 0.74%(-0.710)#88 | 0.50%(-0.478)#4,948 |
| 89. | Wilmington | 0.013% | 0.74%(-0.723)#89 | 0.50%(-0.491)#5,073 |
| 90. | Beverly | 0.0071% | 0.74%(-0.729)#90 | 0.50%(-0.497)#5,124 |
Common Questions
What are the Top 10 Cities with the Highest Percentage of Guatemalan Population in Massachusetts?
Top 10 Cities with the Highest Percentage of Guatemalan Population in Massachusetts are:
#1
8.93%
#2
8.19%
#3
7.51%
#4
5.93%
#5
5.27%
#6
4.36%
#7
4.21%
#8
4.11%
#9
3.61%
#10
2.94%
What city has the Highest Percentage of Guatemalan Population in Massachusetts?
Lynn has the Highest Percentage of Guatemalan Population in Massachusetts with 8.93%.
What is the Percentage of Guatemalan Population in the State of Massachusetts?
Percentage of Guatemalan Population in Massachusetts is 0.74%.
What is the Percentage of Guatemalan Population in the United States?
Percentage of Guatemalan Population in the United States is 0.50%.