Valinda, CA Map & Demographics
Valinda Map
Valinda Overview
$28,522
PER CAPITA INCOME
$95,099
AVG FAMILY INCOME
$95,244
AVG HOUSEHOLD INCOME
19.6%
WAGE / INCOME GAP [ % ]
80.4¢/ $1
WAGE / INCOME GAP [ $ ]
0.42
INEQUALITY / GINI INDEX
21,952
TOTAL POPULATION
11,500
MALE POPULATION
10,452
FEMALE POPULATION
110.03
MALES / 100 FEMALES
90.89
FEMALES / 100 MALES
37.9
MEDIAN AGE
4.8
AVG FAMILY SIZE
4.7
AVG HOUSEHOLD SIZE
11,874
LABOR FORCE [ PEOPLE ]
65.3%
PERCENT IN LABOR FORCE
6.0%
UNEMPLOYMENT RATE
Income in Valinda
Income Overview in Valinda
Per Capita Income in Valinda is $28,522, while median incomes of families and households are $95,099 and $95,244 respectively.
| Characteristic | Number | Measure |
| Per Capita Income | 21,952 | $28,522 |
| Median Family Income | 4,110 | $95,099 |
| Mean Family Income | 4,110 | $121,114 |
| Median Household Income | 4,665 | $95,244 |
| Mean Household Income | 4,665 | $124,271 |
| Income Deficit | 4,110 | $0 |
| Wage / Income Gap (%) | 21,952 | 19.57% |
| Wage / Income Gap ($) | 21,952 | 80.43¢ per $1 |
| Gini / Inequality Index | 21,952 | 0.42 |
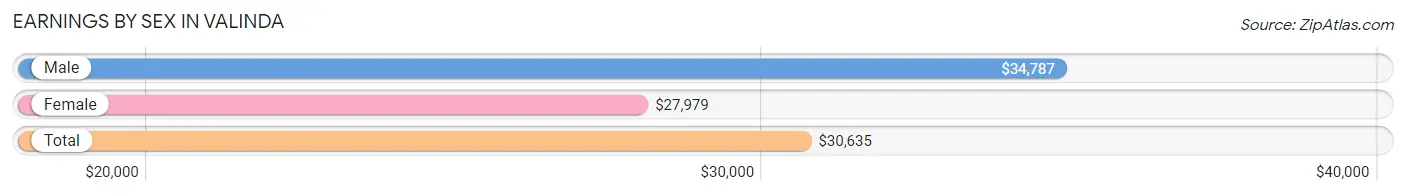
Earnings by Sex in Valinda
Average Earnings in Valinda are $30,635, $34,787 for men and $27,979 for women, a difference of 19.6%.
| Sex | Number | Average Earnings |
| Male | 7,021 (57.9%) | $34,787 |
| Female | 5,107 (42.1%) | $27,979 |
| Total | 12,128 (100.0%) | $30,635 |
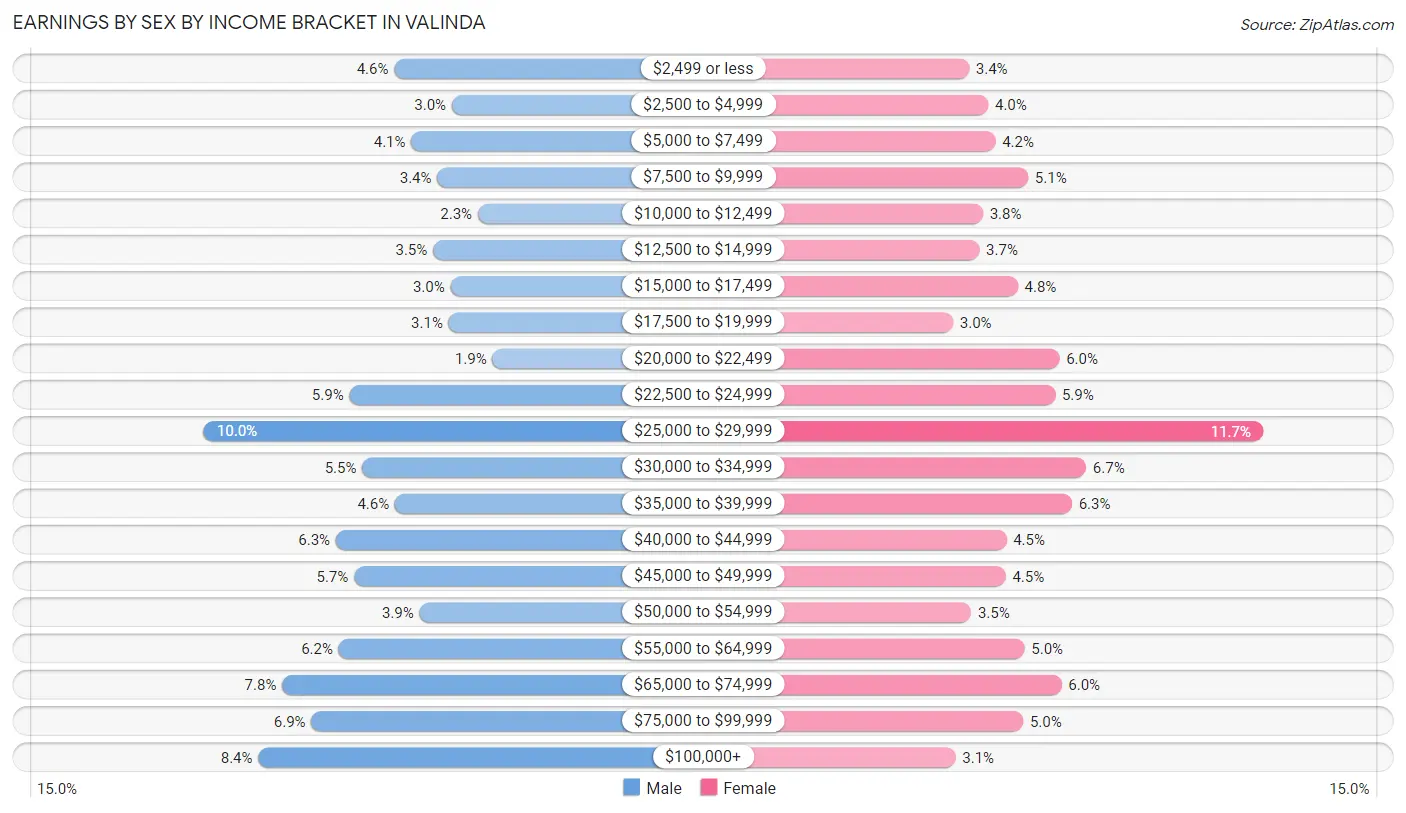
Earnings by Sex by Income Bracket in Valinda
The most common earnings brackets in Valinda are $25,000 to $29,999 for men (699 | 10.0%) and $25,000 to $29,999 for women (597 | 11.7%).
| Income | Male | Female |
| $2,499 or less | 324 (4.6%) | 175 (3.4%) |
| $2,500 to $4,999 | 210 (3.0%) | 203 (4.0%) |
| $5,000 to $7,499 | 290 (4.1%) | 213 (4.2%) |
| $7,500 to $9,999 | 239 (3.4%) | 260 (5.1%) |
| $10,000 to $12,499 | 159 (2.3%) | 195 (3.8%) |
| $12,500 to $14,999 | 247 (3.5%) | 190 (3.7%) |
| $15,000 to $17,499 | 213 (3.0%) | 245 (4.8%) |
| $17,500 to $19,999 | 216 (3.1%) | 152 (3.0%) |
| $20,000 to $22,499 | 130 (1.8%) | 305 (6.0%) |
| $22,500 to $24,999 | 412 (5.9%) | 299 (5.9%) |
| $25,000 to $29,999 | 699 (10.0%) | 597 (11.7%) |
| $30,000 to $34,999 | 387 (5.5%) | 343 (6.7%) |
| $35,000 to $39,999 | 322 (4.6%) | 323 (6.3%) |
| $40,000 to $44,999 | 439 (6.2%) | 229 (4.5%) |
| $45,000 to $49,999 | 403 (5.7%) | 228 (4.5%) |
| $50,000 to $54,999 | 274 (3.9%) | 178 (3.5%) |
| $55,000 to $64,999 | 433 (6.2%) | 255 (5.0%) |
| $65,000 to $74,999 | 545 (7.8%) | 308 (6.0%) |
| $75,000 to $99,999 | 487 (6.9%) | 253 (5.0%) |
| $100,000+ | 592 (8.4%) | 156 (3.0%) |
| Total | 7,021 (100.0%) | 5,107 (100.0%) |
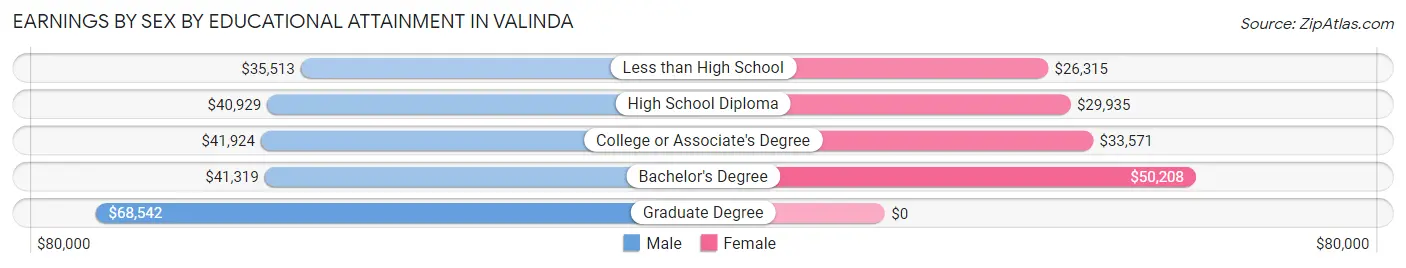
Earnings by Sex by Educational Attainment in Valinda
Average earnings in Valinda are $41,781 for men and $30,692 for women, a difference of 26.5%. Men with an educational attainment of graduate degree enjoy the highest average annual earnings of $68,542, while those with less than high school education earn the least with $35,513. Women with an educational attainment of bachelor's degree earn the most with the average annual earnings of $50,208, while those with less than high school education have the smallest earnings of $26,315.
| Educational Attainment | Male Income | Female Income |
| Less than High School | $35,513 | $26,315 |
| High School Diploma | $40,929 | $29,935 |
| College or Associate's Degree | $41,924 | $33,571 |
| Bachelor's Degree | $41,319 | $50,208 |
| Graduate Degree | $68,542 | $0 |
| Total | $41,781 | $30,692 |
Family Income in Valinda
Family Income Brackets in Valinda
According to the Valinda family income data, there are 974 families falling into the $100,000 to $149,999 income range, which is the most common income bracket and makes up 23.7% of all families. Conversely, the $10,000 to $14,999 income bracket is the least frequent group with only 62 families (1.5%) belonging to this category.
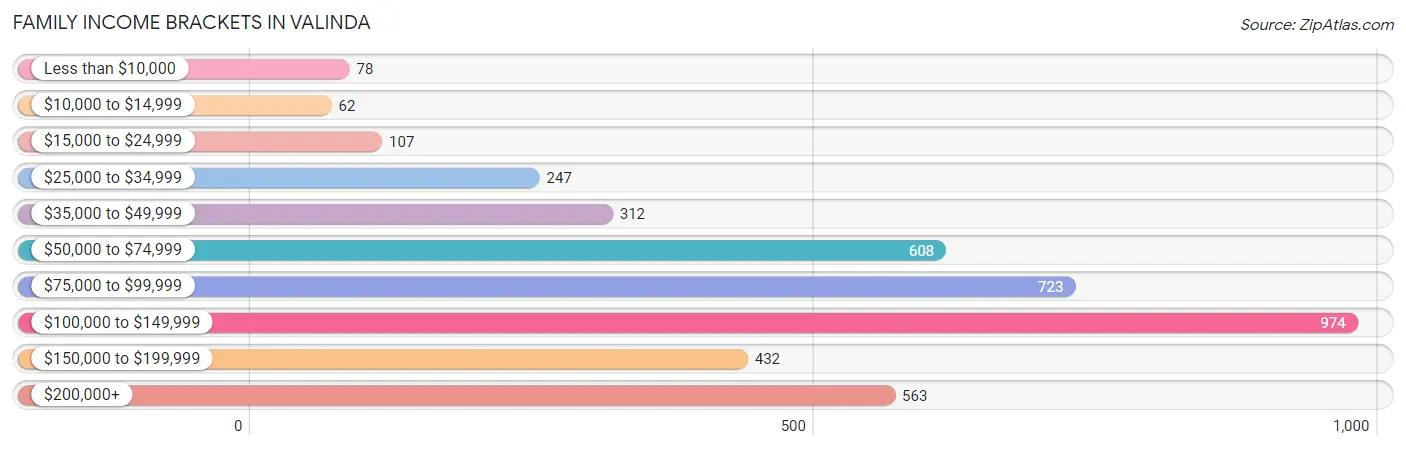
| Income Bracket | # Families | % Families |
| Less than $10,000 | 78 | 1.9% |
| $10,000 to $14,999 | 62 | 1.5% |
| $15,000 to $24,999 | 107 | 2.6% |
| $25,000 to $34,999 | 247 | 6.0% |
| $35,000 to $49,999 | 312 | 7.6% |
| $50,000 to $74,999 | 608 | 14.8% |
| $75,000 to $99,999 | 723 | 17.6% |
| $100,000 to $149,999 | 974 | 23.7% |
| $150,000 to $199,999 | 432 | 10.5% |
| $200,000+ | 563 | 13.7% |
Family Income by Famaliy Size in Valinda
7+ person families (533 | 13.0%) account for the highest median family income in Valinda with $139,963 per family, while 4-person families (753 | 18.3%) have the highest median income of $30,391 per family member.
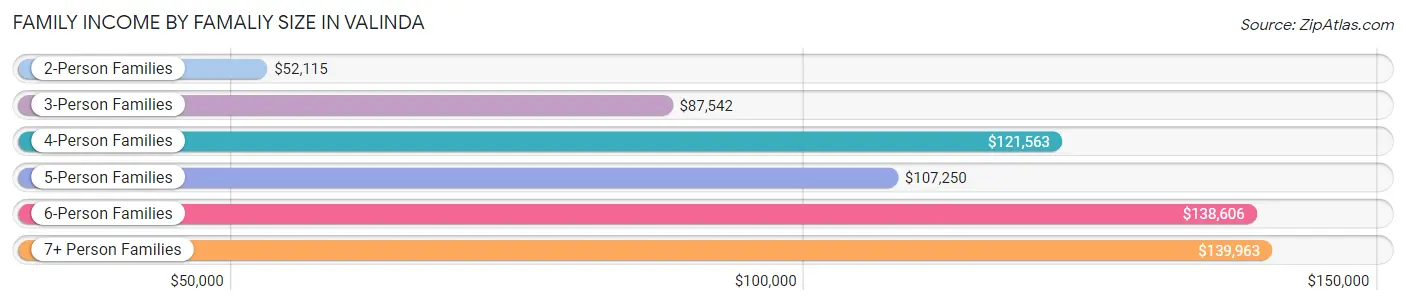
| Income Bracket | # Families | Median Income |
| 2-Person Families | 878 (21.4%) | $52,115 |
| 3-Person Families | 825 (20.1%) | $87,542 |
| 4-Person Families | 753 (18.3%) | $121,563 |
| 5-Person Families | 585 (14.2%) | $107,250 |
| 6-Person Families | 536 (13.0%) | $138,606 |
| 7+ Person Families | 533 (13.0%) | $139,963 |
| Total | 4,110 (100.0%) | $95,099 |
Family Income by Number of Earners in Valinda
The median family income in Valinda is $95,099, with families comprising 3+ earners (1,720) having the highest median family income of $133,526, while families with no earners (240) have the lowest median family income of $35,833, accounting for 41.8% and 5.8% of families, respectively.
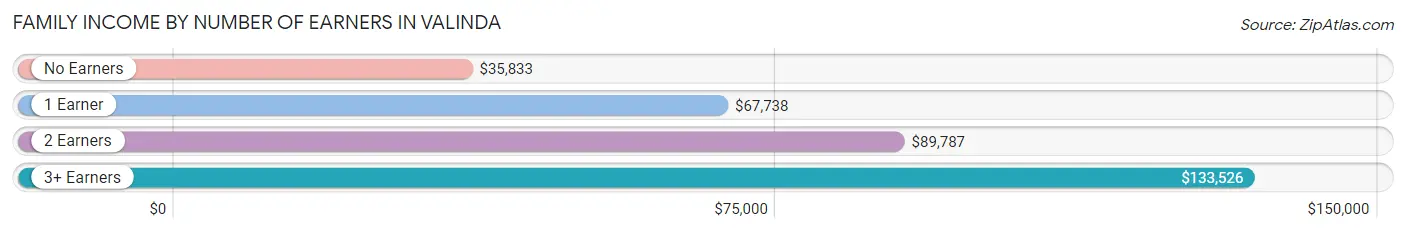
| Number of Earners | # Families | Median Income |
| No Earners | 240 (5.8%) | $35,833 |
| 1 Earner | 1,022 (24.9%) | $67,738 |
| 2 Earners | 1,128 (27.5%) | $89,787 |
| 3+ Earners | 1,720 (41.8%) | $133,526 |
| Total | 4,110 (100.0%) | $95,099 |
Household Income in Valinda
Household Income Brackets in Valinda
With 1,031 households falling in the category, the $100,000 to $149,999 income range is the most frequent in Valinda, accounting for 22.1% of all households. In contrast, only 89 households (1.9%) fall into the $10,000 to $14,999 income bracket, making it the least populous group.
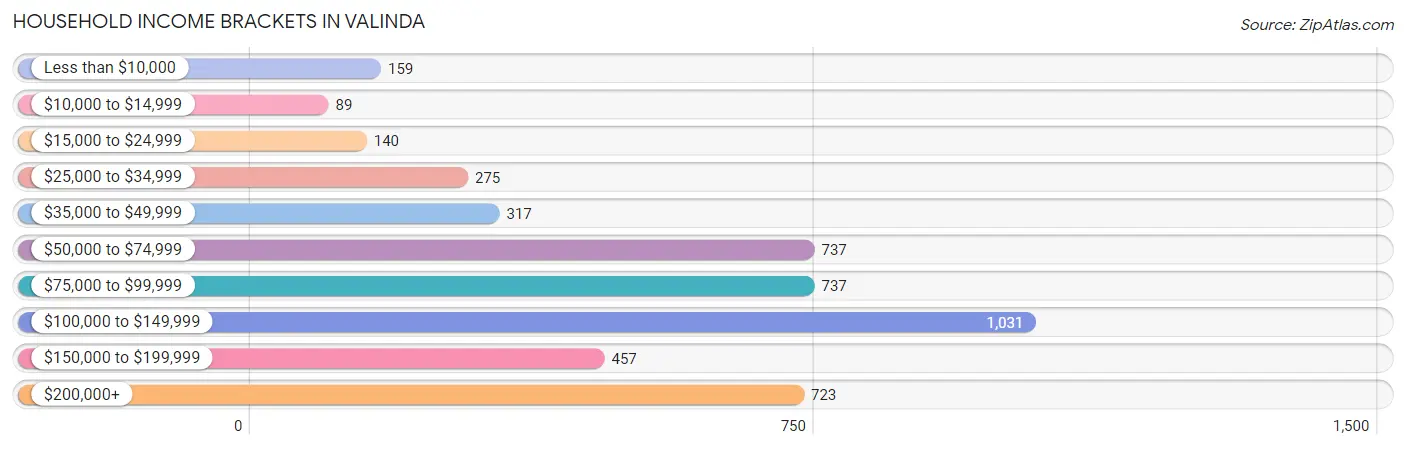
| Income Bracket | # Households | % Households |
| Less than $10,000 | 159 | 3.4% |
| $10,000 to $14,999 | 89 | 1.9% |
| $15,000 to $24,999 | 140 | 3.0% |
| $25,000 to $34,999 | 275 | 5.9% |
| $35,000 to $49,999 | 317 | 6.8% |
| $50,000 to $74,999 | 737 | 15.8% |
| $75,000 to $99,999 | 737 | 15.8% |
| $100,000 to $149,999 | 1,031 | 22.1% |
| $150,000 to $199,999 | 457 | 9.8% |
| $200,000+ | 723 | 15.5% |
Household Income by Householder Age in Valinda
The median household income in Valinda is $95,244, with the highest median household income of $130,953 found in the 25 to 44 years age bracket for the primary householder. A total of 1,225 households (26.3%) fall into this category. Meanwhile, the 65+ years age bracket for the primary householder has the lowest median household income of $76,193, with 1,263 households (27.1%) in this group.
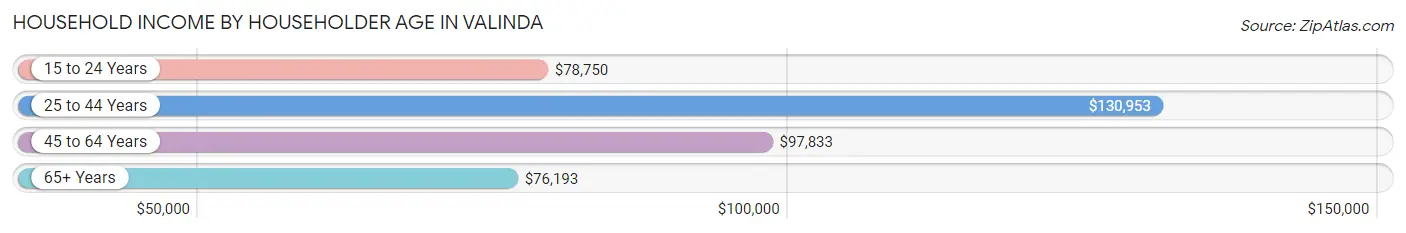
| Income Bracket | # Households | Median Income |
| 15 to 24 Years | 21 (0.4%) | $78,750 |
| 25 to 44 Years | 1,225 (26.3%) | $130,953 |
| 45 to 64 Years | 2,156 (46.2%) | $97,833 |
| 65+ Years | 1,263 (27.1%) | $76,193 |
| Total | 4,665 (100.0%) | $95,244 |
Poverty in Valinda
Income Below Poverty by Sex and Age in Valinda
With 8.8% poverty level for males and 10.4% for females among the residents of Valinda, 75 year old and over males and 75 year old and over females are the most vulnerable to poverty, with 148 males (29.1%) and 141 females (21.3%) in their respective age groups living below the poverty level.
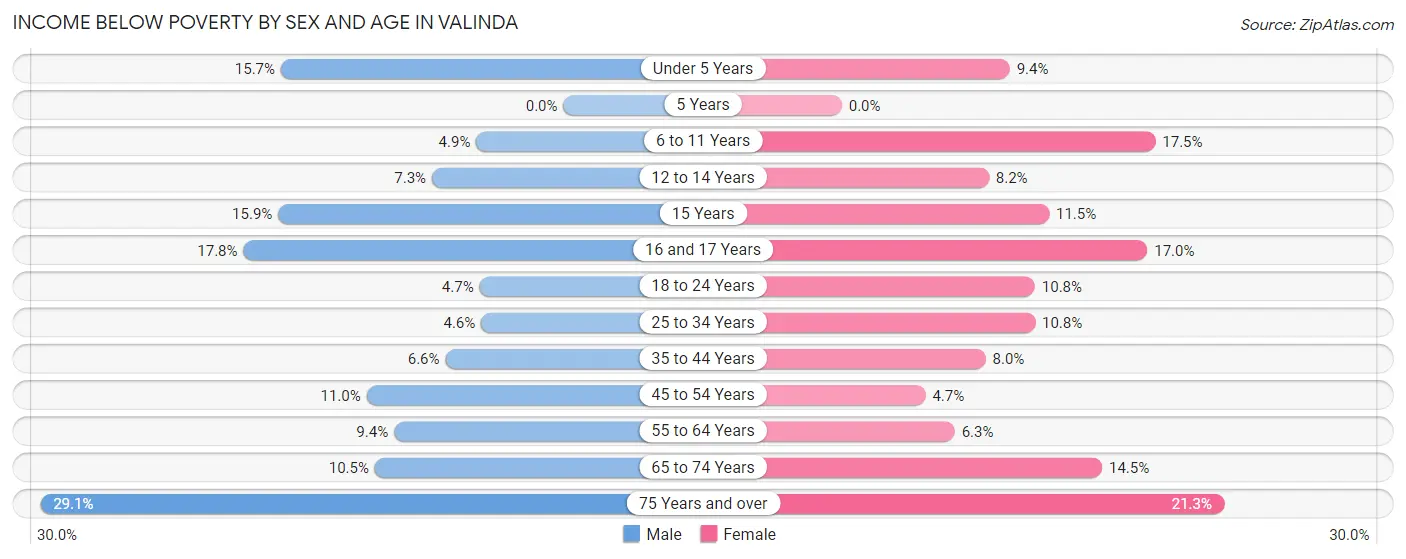
| Age Bracket | Male | Female |
| Under 5 Years | 59 (15.7%) | 42 (9.3%) |
| 5 Years | 0 (0.0%) | 0 (0.0%) |
| 6 to 11 Years | 42 (4.9%) | 103 (17.5%) |
| 12 to 14 Years | 38 (7.3%) | 33 (8.2%) |
| 15 Years | 27 (15.9%) | 12 (11.5%) |
| 16 and 17 Years | 54 (17.8%) | 57 (17.0%) |
| 18 to 24 Years | 64 (4.7%) | 151 (10.7%) |
| 25 to 34 Years | 76 (4.6%) | 141 (10.8%) |
| 35 to 44 Years | 115 (6.6%) | 113 (8.0%) |
| 45 to 54 Years | 159 (11.0%) | 63 (4.7%) |
| 55 to 64 Years | 146 (9.4%) | 79 (6.3%) |
| 65 to 74 Years | 84 (10.5%) | 154 (14.5%) |
| 75 Years and over | 148 (29.1%) | 141 (21.3%) |
| Total | 1,012 (8.8%) | 1,089 (10.4%) |
Income Above Poverty by Sex and Age in Valinda
According to the poverty statistics in Valinda, males aged 5 years and females aged 5 years are the age groups that are most secure financially, with 100.0% of males and 100.0% of females in these age groups living above the poverty line.
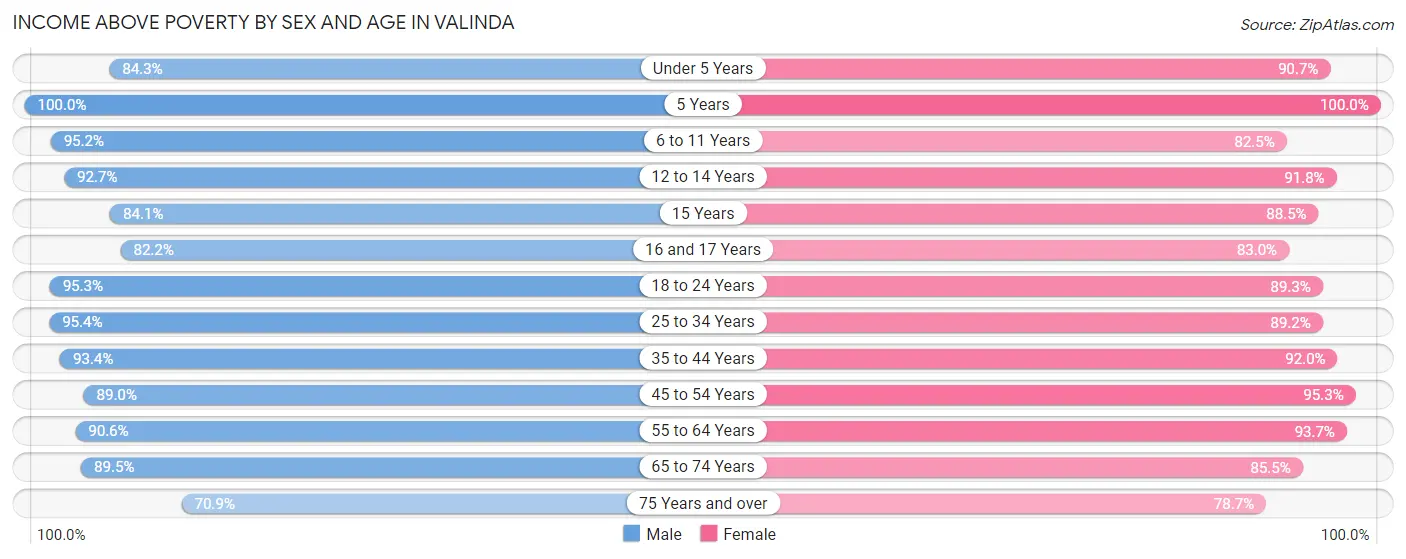
| Age Bracket | Male | Female |
| Under 5 Years | 316 (84.3%) | 407 (90.6%) |
| 5 Years | 127 (100.0%) | 97 (100.0%) |
| 6 to 11 Years | 824 (95.2%) | 487 (82.5%) |
| 12 to 14 Years | 481 (92.7%) | 370 (91.8%) |
| 15 Years | 143 (84.1%) | 92 (88.5%) |
| 16 and 17 Years | 249 (82.2%) | 278 (83.0%) |
| 18 to 24 Years | 1,307 (95.3%) | 1,254 (89.2%) |
| 25 to 34 Years | 1,582 (95.4%) | 1,169 (89.2%) |
| 35 to 44 Years | 1,635 (93.4%) | 1,298 (92.0%) |
| 45 to 54 Years | 1,292 (89.0%) | 1,288 (95.3%) |
| 55 to 64 Years | 1,402 (90.6%) | 1,176 (93.7%) |
| 65 to 74 Years | 716 (89.5%) | 909 (85.5%) |
| 75 Years and over | 360 (70.9%) | 522 (78.7%) |
| Total | 10,434 (91.2%) | 9,347 (89.6%) |
Income Below Poverty Among Married-Couple Families in Valinda
The poverty statistics for married-couple families in Valinda show that 6.1% or 168 of the total 2,744 families live below the poverty line. Families with 5 or more children have the highest poverty rate of 38.5%, comprising of 25 families. On the other hand, families with 3 or 4 children have the lowest poverty rate of 4.0%, which includes 9 families.
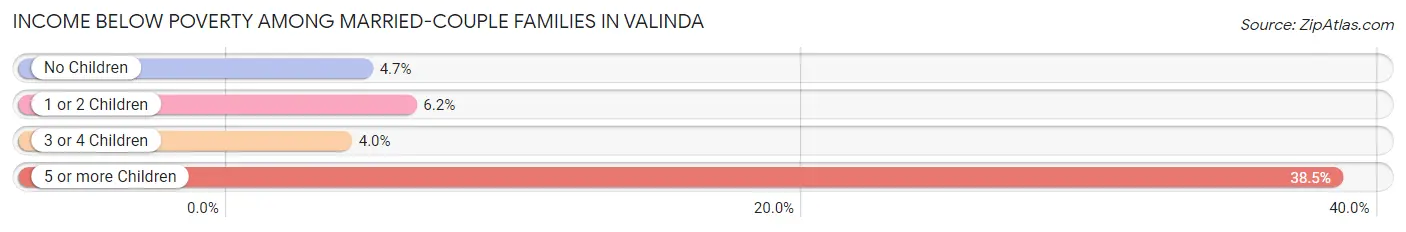
| Children | Above Poverty | Below Poverty |
| No Children | 1,139 (95.3%) | 56 (4.7%) |
| 1 or 2 Children | 1,179 (93.8%) | 78 (6.2%) |
| 3 or 4 Children | 218 (96.0%) | 9 (4.0%) |
| 5 or more Children | 40 (61.5%) | 25 (38.5%) |
| Total | 2,576 (93.9%) | 168 (6.1%) |
Income Below Poverty Among Single-Parent Households in Valinda
According to the poverty data in Valinda, 11.7% or 53 single-father households and 6.9% or 63 single-mother households are living below the poverty line. Among single-father households, those with no children have the highest poverty rate, with 53 households (21.1%) experiencing poverty. Likewise, among single-mother households, those with 1 or 2 children have the highest poverty rate, with 29 households (10.4%) falling below the poverty line.
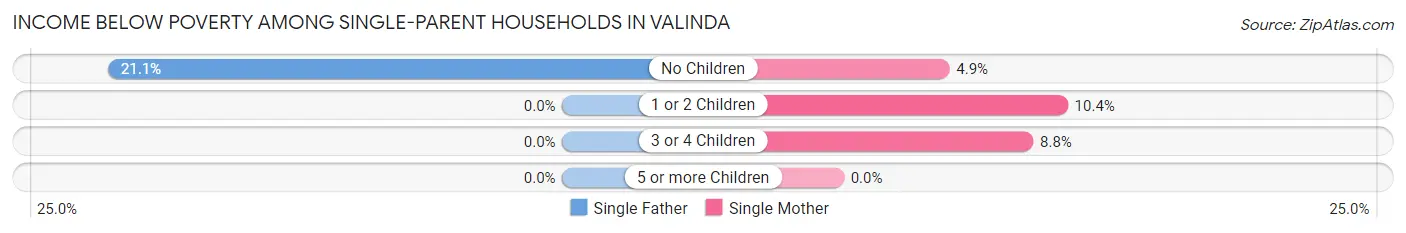
| Children | Single Father | Single Mother |
| No Children | 53 (21.1%) | 28 (4.9%) |
| 1 or 2 Children | 0 (0.0%) | 29 (10.4%) |
| 3 or 4 Children | 0 (0.0%) | 6 (8.8%) |
| 5 or more Children | 0 (0.0%) | 0 (0.0%) |
| Total | 53 (11.7%) | 63 (6.9%) |
Income Below Poverty Among Married-Couple vs Single-Parent Households in Valinda
The poverty data for Valinda shows that 168 of the married-couple family households (6.1%) and 116 of the single-parent households (8.5%) are living below the poverty level. Within the married-couple family households, those with 5 or more children have the highest poverty rate, with 25 households (38.5%) falling below the poverty line. Among the single-parent households, those with no children have the highest poverty rate, with 81 household (9.9%) living below poverty.
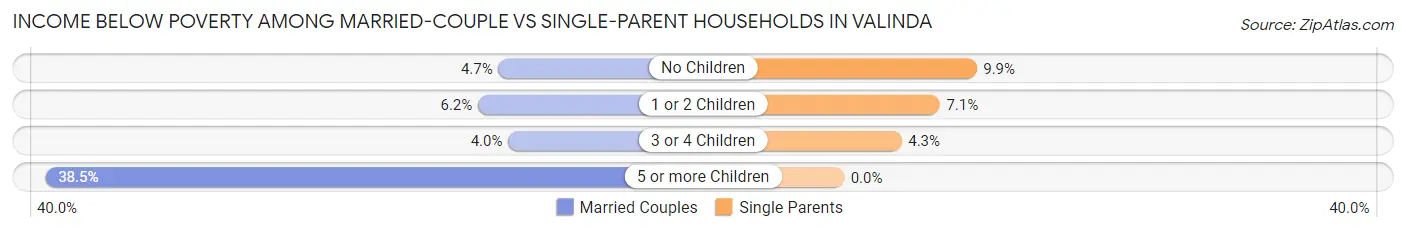
| Children | Married-Couple Families | Single-Parent Households |
| No Children | 56 (4.7%) | 81 (9.9%) |
| 1 or 2 Children | 78 (6.2%) | 29 (7.1%) |
| 3 or 4 Children | 9 (4.0%) | 6 (4.3%) |
| 5 or more Children | 25 (38.5%) | 0 (0.0%) |
| Total | 168 (6.1%) | 116 (8.5%) |
Race in Valinda
The most populous races in Valinda are Hispanic or Latino (16,331 | 74.4%), Some other Race (8,872 | 40.4%), and White / Caucasian (6,020 | 27.4%).
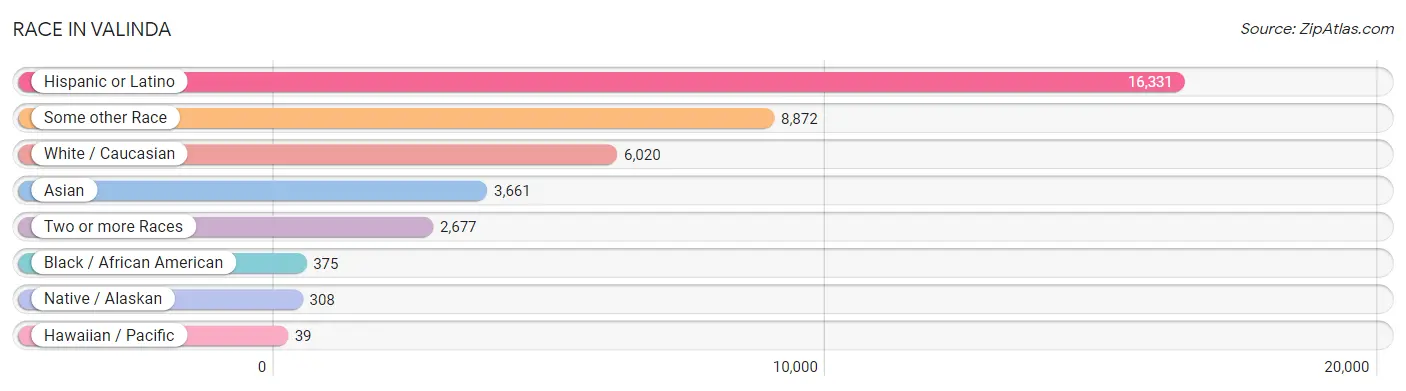
| Race | # Population | % Population |
| Asian | 3,661 | 16.7% |
| Black / African American | 375 | 1.7% |
| Hawaiian / Pacific | 39 | 0.2% |
| Hispanic or Latino | 16,331 | 74.4% |
| Native / Alaskan | 308 | 1.4% |
| White / Caucasian | 6,020 | 27.4% |
| Two or more Races | 2,677 | 12.2% |
| Some other Race | 8,872 | 40.4% |
| Total | 21,952 | 100.0% |
Ancestry in Valinda
The most populous ancestries reported in Valinda are Mexican (14,095 | 64.2%), Indian (Asian) (1,650 | 7.5%), Korean (1,582 | 7.2%), Central American (1,270 | 5.8%), and Salvadoran (765 | 3.5%), together accounting for 88.2% of all Valinda residents.
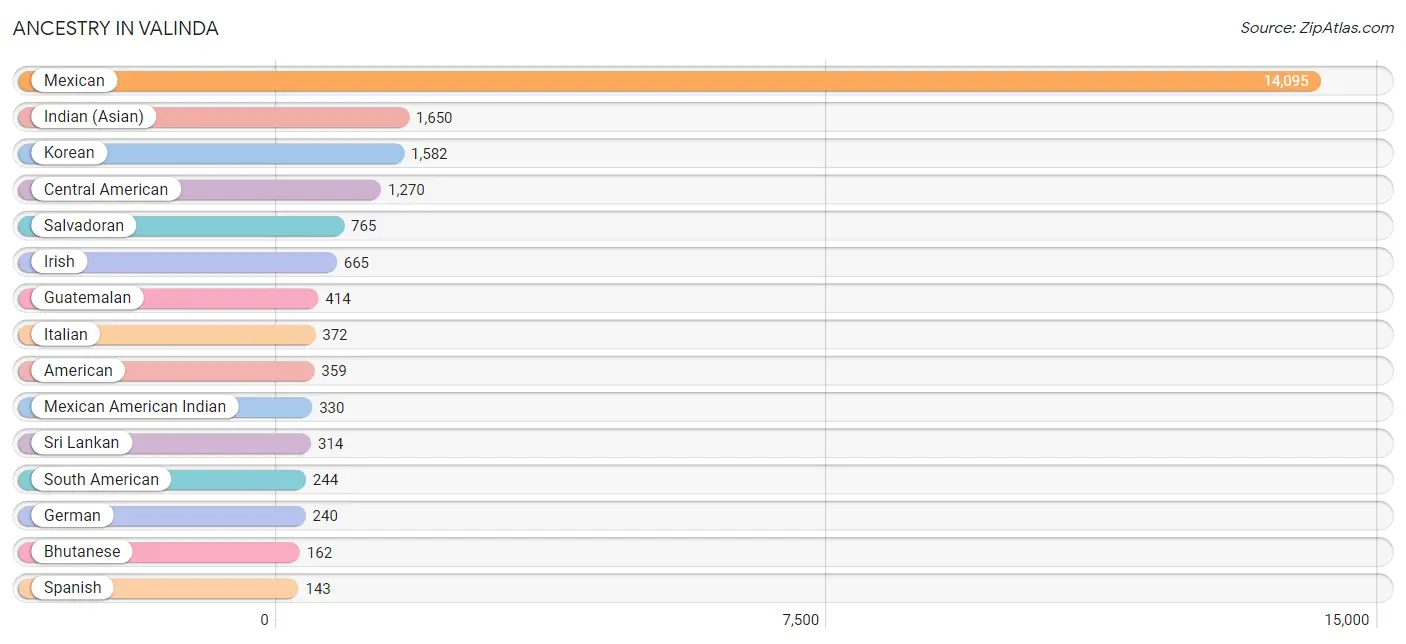
| Ancestry | # Population | % Population |
| Afghan | 3 | 0.0% |
| African | 6 | 0.0% |
| American | 359 | 1.6% |
| Apache | 5 | 0.0% |
| Arab | 84 | 0.4% |
| Argentinean | 23 | 0.1% |
| Armenian | 25 | 0.1% |
| Bhutanese | 162 | 0.7% |
| Blackfeet | 1 | 0.0% |
| Burmese | 10 | 0.1% |
| Central American | 1,270 | 5.8% |
| Central American Indian | 11 | 0.1% |
| Cherokee | 12 | 0.1% |
| Colombian | 24 | 0.1% |
| Cuban | 26 | 0.1% |
| Dutch | 75 | 0.3% |
| Eastern European | 9 | 0.0% |
| Ecuadorian | 110 | 0.5% |
| English | 136 | 0.6% |
| European | 52 | 0.2% |
| Filipino | 44 | 0.2% |
| French | 41 | 0.2% |
| French Canadian | 4 | 0.0% |
| German | 240 | 1.1% |
| Greek | 13 | 0.1% |
| Guatemalan | 414 | 1.9% |
| Honduran | 18 | 0.1% |
| Indian (Asian) | 1,650 | 7.5% |
| Indonesian | 33 | 0.2% |
| Irish | 665 | 3.0% |
| Italian | 372 | 1.7% |
| Japanese | 9 | 0.0% |
| Korean | 1,582 | 7.2% |
| Laotian | 6 | 0.0% |
| Lebanese | 24 | 0.1% |
| Mexican | 14,095 | 64.2% |
| Mexican American Indian | 330 | 1.5% |
| Navajo | 106 | 0.5% |
| Nicaraguan | 73 | 0.3% |
| Peruvian | 87 | 0.4% |
| Polish | 12 | 0.1% |
| Puerto Rican | 63 | 0.3% |
| Romanian | 19 | 0.1% |
| Russian | 59 | 0.3% |
| Salvadoran | 765 | 3.5% |
| Scotch-Irish | 49 | 0.2% |
| Scottish | 13 | 0.1% |
| Sioux | 12 | 0.1% |
| South American | 244 | 1.1% |
| Spaniard | 29 | 0.1% |
| Spanish | 143 | 0.6% |
| Sri Lankan | 314 | 1.4% |
| Subsaharan African | 108 | 0.5% |
| Sudanese | 102 | 0.5% |
| Swedish | 23 | 0.1% |
| Syrian | 35 | 0.2% |
| Thai | 41 | 0.2% |
| Welsh | 29 | 0.1% |
| Yaqui | 13 | 0.1% | View All 59 Rows |
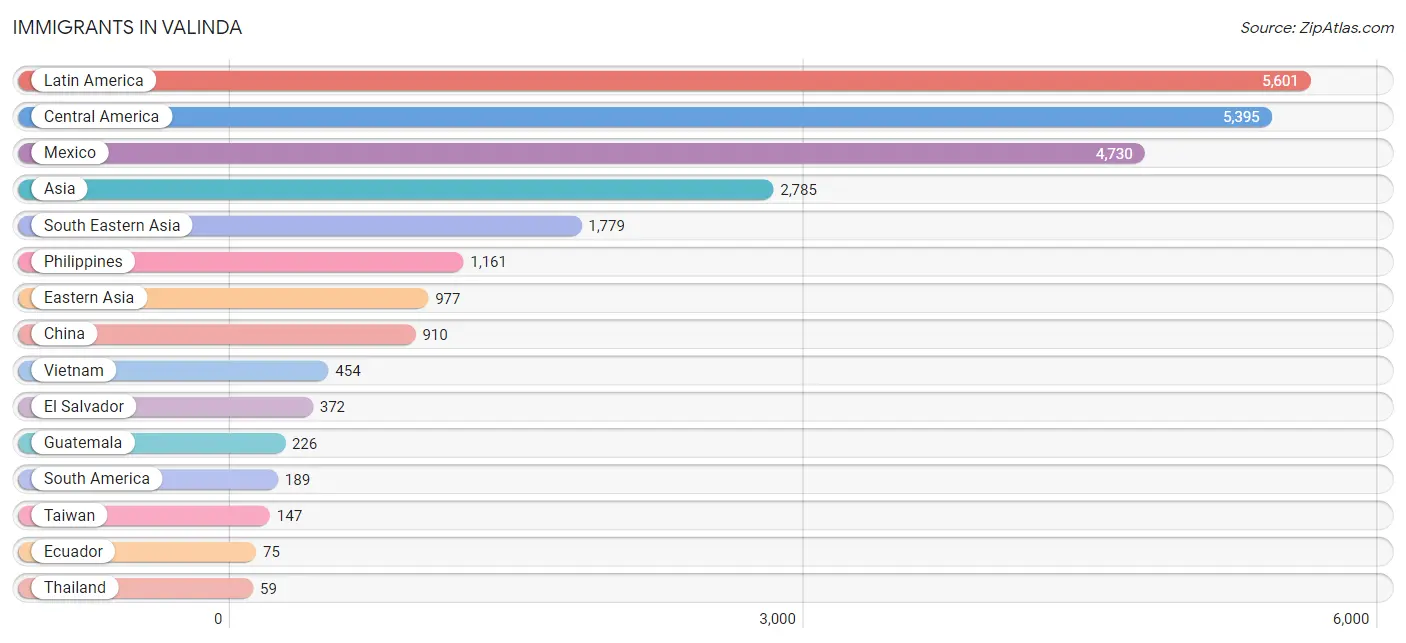
Immigrants in Valinda
The most numerous immigrant groups reported in Valinda came from Latin America (5,601 | 25.5%), Central America (5,395 | 24.6%), Mexico (4,730 | 21.5%), Asia (2,785 | 12.7%), and South Eastern Asia (1,779 | 8.1%), together accounting for 92.4% of all Valinda residents.
| Immigration Origin | # Population | % Population |
| Africa | 49 | 0.2% |
| Asia | 2,785 | 12.7% |
| Bolivia | 34 | 0.2% |
| Cambodia | 18 | 0.1% |
| Caribbean | 17 | 0.1% |
| Central America | 5,395 | 24.6% |
| China | 910 | 4.2% |
| Colombia | 24 | 0.1% |
| Cuba | 12 | 0.1% |
| Eastern Asia | 977 | 4.4% |
| Eastern Europe | 10 | 0.1% |
| Ecuador | 75 | 0.3% |
| El Salvador | 372 | 1.7% |
| Europe | 25 | 0.1% |
| Fiji | 34 | 0.2% |
| France | 6 | 0.0% |
| Germany | 8 | 0.0% |
| Guatemala | 226 | 1.0% |
| Honduras | 16 | 0.1% |
| Hong Kong | 43 | 0.2% |
| Indonesia | 54 | 0.3% |
| Italy | 1 | 0.0% |
| Japan | 57 | 0.3% |
| Korea | 10 | 0.1% |
| Latin America | 5,601 | 25.5% |
| Lebanon | 19 | 0.1% |
| Mexico | 4,730 | 21.5% |
| Nicaragua | 51 | 0.2% |
| Northern Africa | 49 | 0.2% |
| Oceania | 34 | 0.2% |
| Peru | 49 | 0.2% |
| Philippines | 1,161 | 5.3% |
| Romania | 10 | 0.1% |
| South America | 189 | 0.9% |
| South Eastern Asia | 1,779 | 8.1% |
| Southern Europe | 1 | 0.0% |
| Sudan | 40 | 0.2% |
| Syria | 10 | 0.1% |
| Taiwan | 147 | 0.7% |
| Thailand | 59 | 0.3% |
| Venezuela | 7 | 0.0% |
| Vietnam | 454 | 2.1% |
| Western Asia | 29 | 0.1% |
| Western Europe | 14 | 0.1% | View All 44 Rows |
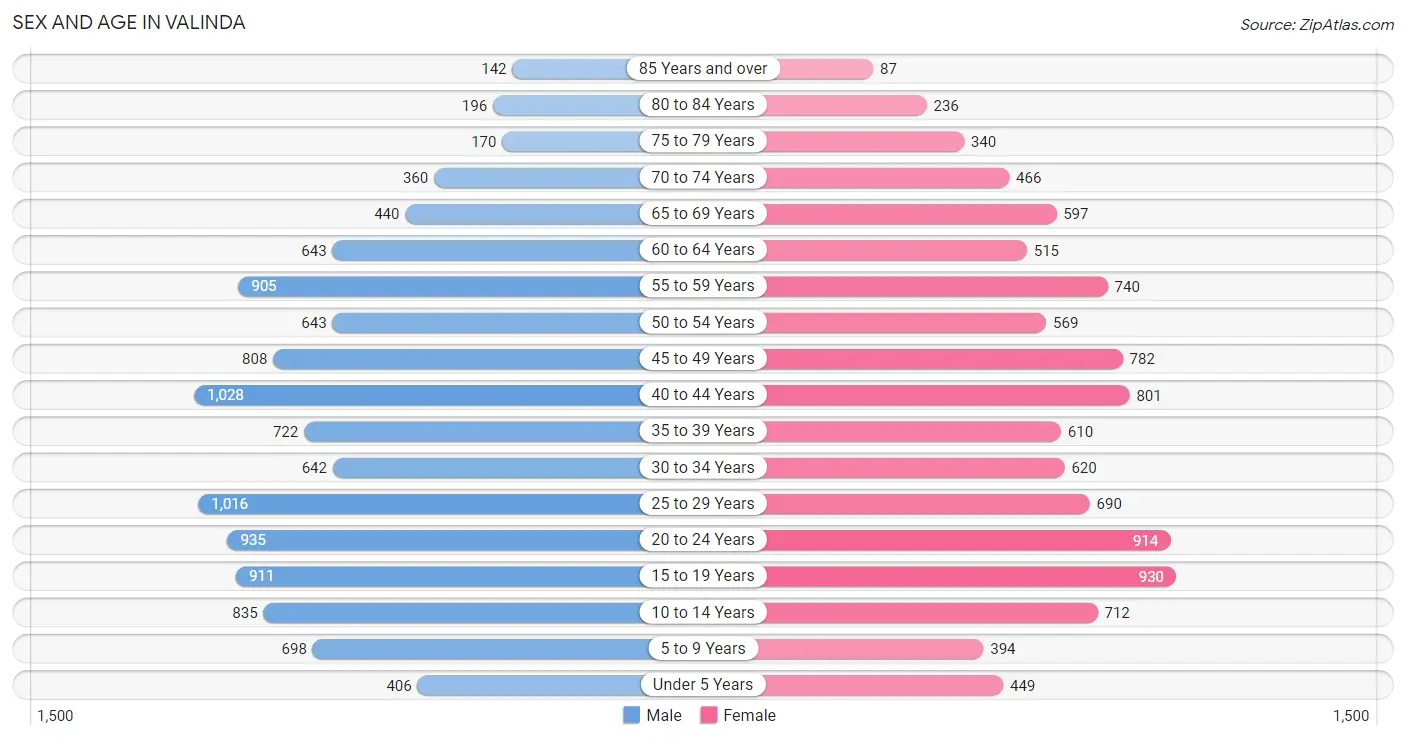
Sex and Age in Valinda
Sex and Age in Valinda
The most populous age groups in Valinda are 40 to 44 Years (1,028 | 8.9%) for men and 15 to 19 Years (930 | 8.9%) for women.
| Age Bracket | Male | Female |
| Under 5 Years | 406 (3.5%) | 449 (4.3%) |
| 5 to 9 Years | 698 (6.1%) | 394 (3.8%) |
| 10 to 14 Years | 835 (7.3%) | 712 (6.8%) |
| 15 to 19 Years | 911 (7.9%) | 930 (8.9%) |
| 20 to 24 Years | 935 (8.1%) | 914 (8.7%) |
| 25 to 29 Years | 1,016 (8.8%) | 690 (6.6%) |
| 30 to 34 Years | 642 (5.6%) | 620 (5.9%) |
| 35 to 39 Years | 722 (6.3%) | 610 (5.8%) |
| 40 to 44 Years | 1,028 (8.9%) | 801 (7.7%) |
| 45 to 49 Years | 808 (7.0%) | 782 (7.5%) |
| 50 to 54 Years | 643 (5.6%) | 569 (5.4%) |
| 55 to 59 Years | 905 (7.9%) | 740 (7.1%) |
| 60 to 64 Years | 643 (5.6%) | 515 (4.9%) |
| 65 to 69 Years | 440 (3.8%) | 597 (5.7%) |
| 70 to 74 Years | 360 (3.1%) | 466 (4.5%) |
| 75 to 79 Years | 170 (1.5%) | 340 (3.3%) |
| 80 to 84 Years | 196 (1.7%) | 236 (2.3%) |
| 85 Years and over | 142 (1.2%) | 87 (0.8%) |
| Total | 11,500 (100.0%) | 10,452 (100.0%) |
Families and Households in Valinda
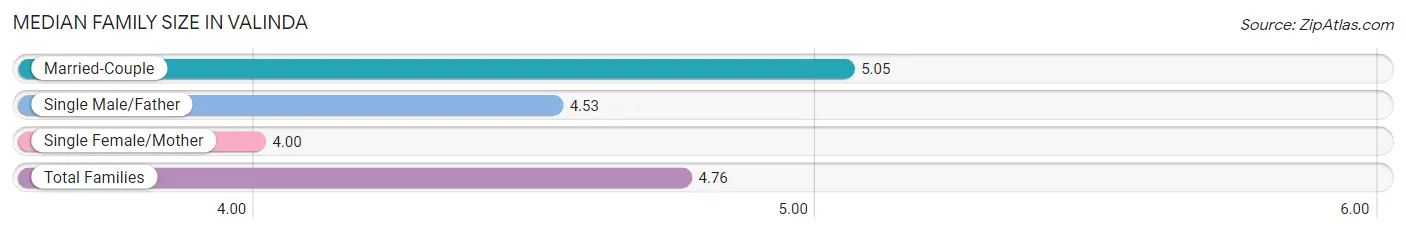
Median Family Size in Valinda
The median family size in Valinda is 4.76 persons per family, with married-couple families (2,744 | 66.8%) accounting for the largest median family size of 5.05 persons per family. On the other hand, single female/mother families (915 | 22.3%) represent the smallest median family size with 4.00 persons per family.
| Family Type | # Families | Family Size |
| Married-Couple | 2,744 (66.8%) | 5.05 |
| Single Male/Father | 451 (11.0%) | 4.53 |
| Single Female/Mother | 915 (22.3%) | 4.00 |
| Total Families | 4,110 (100.0%) | 4.76 |
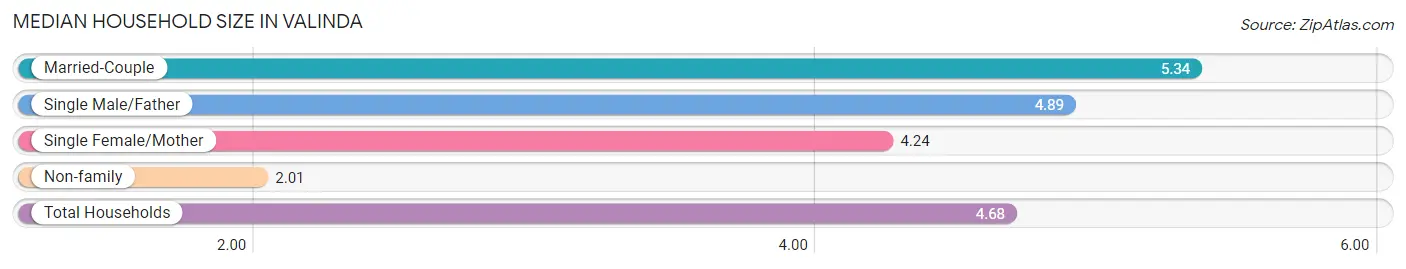
Median Household Size in Valinda
The median household size in Valinda is 4.68 persons per household, with married-couple households (2,744 | 58.8%) accounting for the largest median household size of 5.34 persons per household. non-family households (555 | 11.9%) represent the smallest median household size with 2.01 persons per household.
| Household Type | # Households | Household Size |
| Married-Couple | 2,744 (58.8%) | 5.34 |
| Single Male/Father | 451 (9.7%) | 4.89 |
| Single Female/Mother | 915 (19.6%) | 4.24 |
| Non-family | 555 (11.9%) | 2.01 |
| Total Households | 4,665 (100.0%) | 4.68 |
Household Size by Marriage Status in Valinda
Out of a total of 4,665 households in Valinda, 4,110 (88.1%) are family households, while 555 (11.9%) are nonfamily households. The most numerous type of family households are 3-person households, comprising 835, and the most common type of nonfamily households are 1-person households, comprising 286.
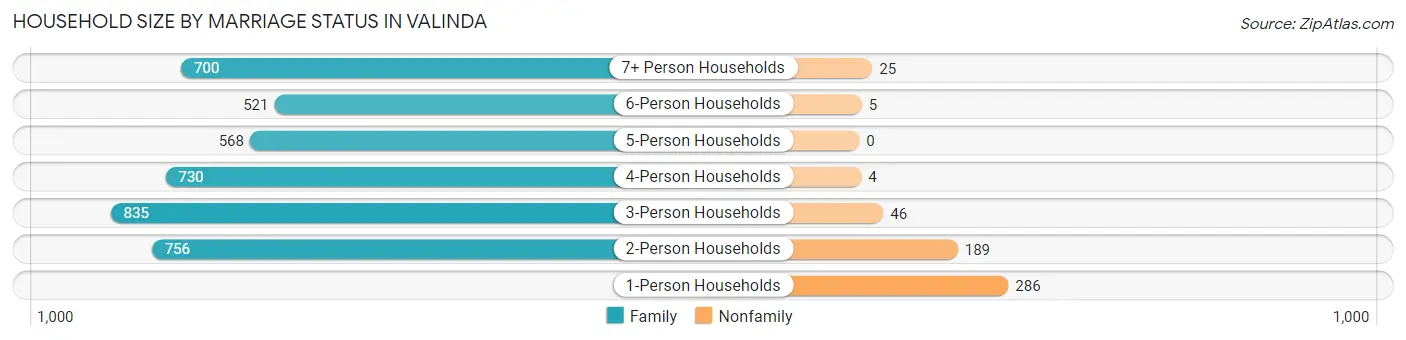
| Household Size | Family Households | Nonfamily Households |
| 1-Person Households | - | 286 (6.1%) |
| 2-Person Households | 756 (16.2%) | 189 (4.1%) |
| 3-Person Households | 835 (17.9%) | 46 (1.0%) |
| 4-Person Households | 730 (15.7%) | 4 (0.1%) |
| 5-Person Households | 568 (12.2%) | 0 (0.0%) |
| 6-Person Households | 521 (11.2%) | 5 (0.1%) |
| 7+ Person Households | 700 (15.0%) | 25 (0.5%) |
| Total | 4,110 (88.1%) | 555 (11.9%) |
Female Fertility in Valinda
Fertility by Age in Valinda
Average fertility rate in Valinda is 26.0 births per 1,000 women. Women in the age bracket of 20 to 34 years have the highest fertility rate with 50.0 births per 1,000 women. Women in the age bracket of 20 to 34 years acount for 77.8% of all women with births.
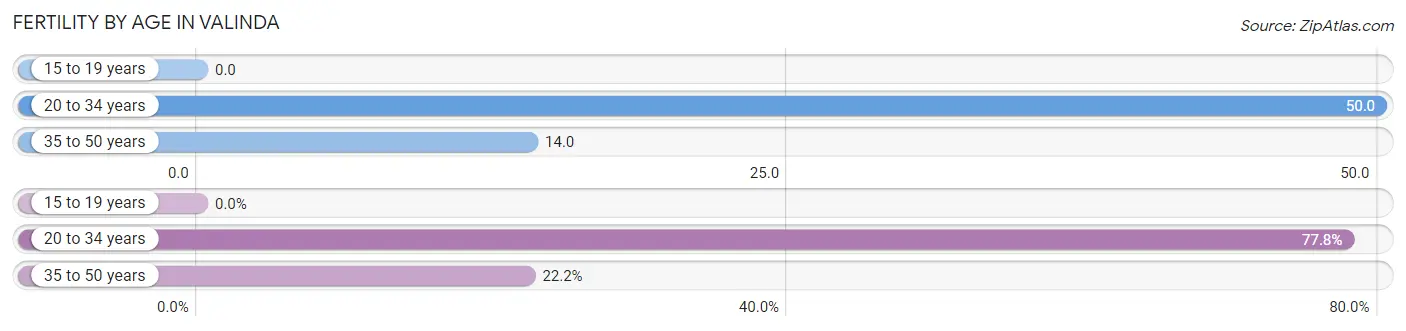
| Age Bracket | Women with Births | Births / 1,000 Women |
| 15 to 19 years | 0 (0.0%) | 0.0 |
| 20 to 34 years | 112 (77.8%) | 50.0 |
| 35 to 50 years | 32 (22.2%) | 14.0 |
| Total | 144 (100.0%) | 26.0 |
Fertility by Age by Marriage Status in Valinda
39.6% of women with births (144) in Valinda are married. The highest percentage of unmarried women with births falls into 20 to 34 years age bracket with 77.7% of them unmarried at the time of birth, while the lowest percentage of unmarried women with births belong to 35 to 50 years age bracket with 0.0% of them unmarried.
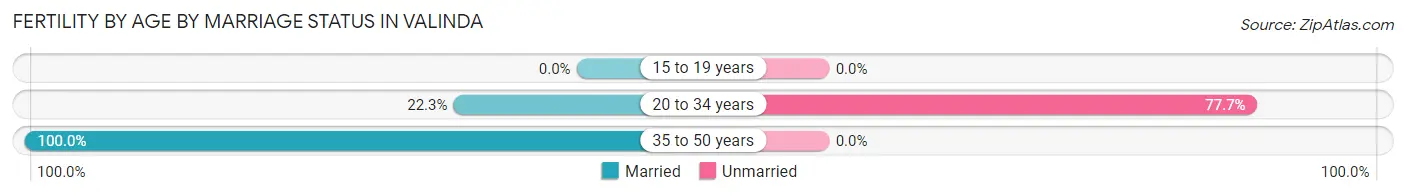
| Age Bracket | Married | Unmarried |
| 15 to 19 years | 0 (0.0%) | 0 (0.0%) |
| 20 to 34 years | 25 (22.3%) | 87 (77.7%) |
| 35 to 50 years | 32 (100.0%) | 0 (0.0%) |
| Total | 57 (39.6%) | 87 (60.4%) |
Fertility by Education in Valinda
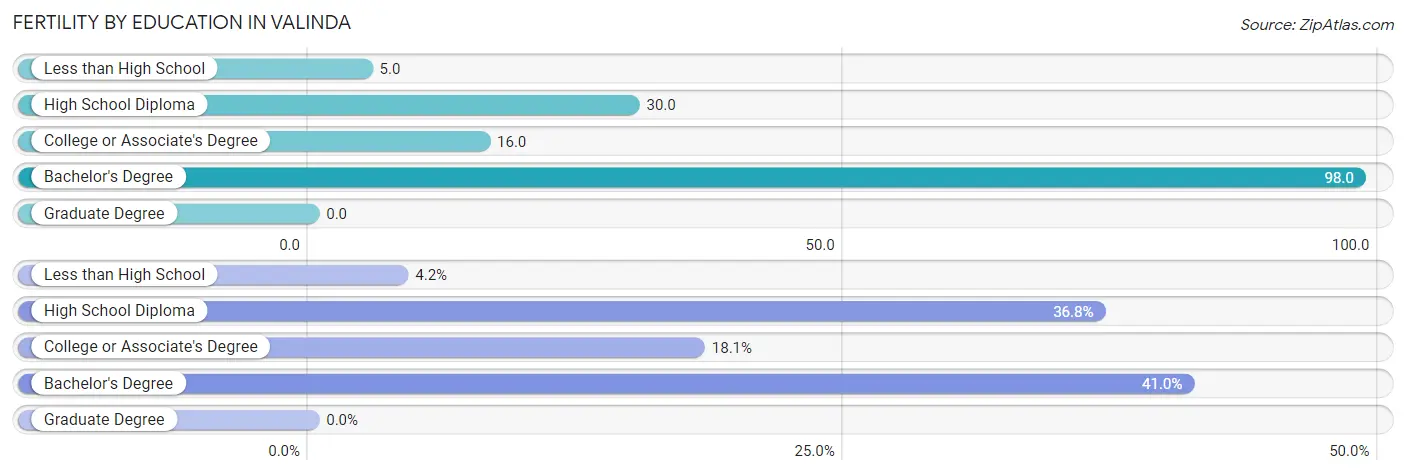
| Educational Attainment | Women with Births | Births / 1,000 Women |
| Less than High School | 6 (4.2%) | 5.0 |
| High School Diploma | 53 (36.8%) | 30.0 |
| College or Associate's Degree | 26 (18.1%) | 16.0 |
| Bachelor's Degree | 59 (41.0%) | 98.0 |
| Graduate Degree | 0 (0.0%) | 0.0 |
| Total | 144 (100.0%) | 26.0 |
Fertility by Education by Marriage Status in Valinda
60.4% of women with births in Valinda are unmarried. Women with the educational attainment of less than high school are most likely to be married with 100.0% of them married at childbirth, while women with the educational attainment of high school diploma are least likely to be married with 69.8% of them unmarried at childbirth.
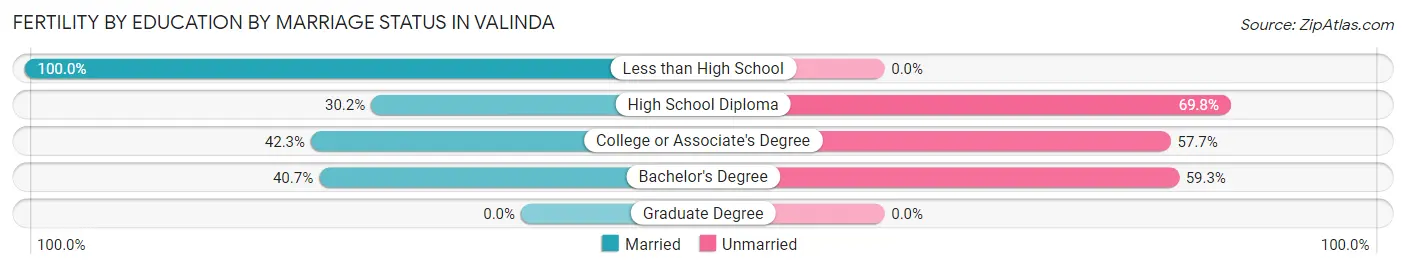
| Educational Attainment | Married | Unmarried |
| Less than High School | 6 (100.0%) | 0 (0.0%) |
| High School Diploma | 16 (30.2%) | 37 (69.8%) |
| College or Associate's Degree | 11 (42.3%) | 15 (57.7%) |
| Bachelor's Degree | 24 (40.7%) | 35 (59.3%) |
| Graduate Degree | 0 (0.0%) | 0 (0.0%) |
| Total | 57 (39.6%) | 87 (60.4%) |
Employment Characteristics in Valinda
Employment by Class of Employer in Valinda
Among the 10,813 employed individuals in Valinda, private company employees (7,623 | 70.5%), self-employed (not incorporated) (983 | 9.1%), and local government employees (982 | 9.1%) make up the most common classes of employment.
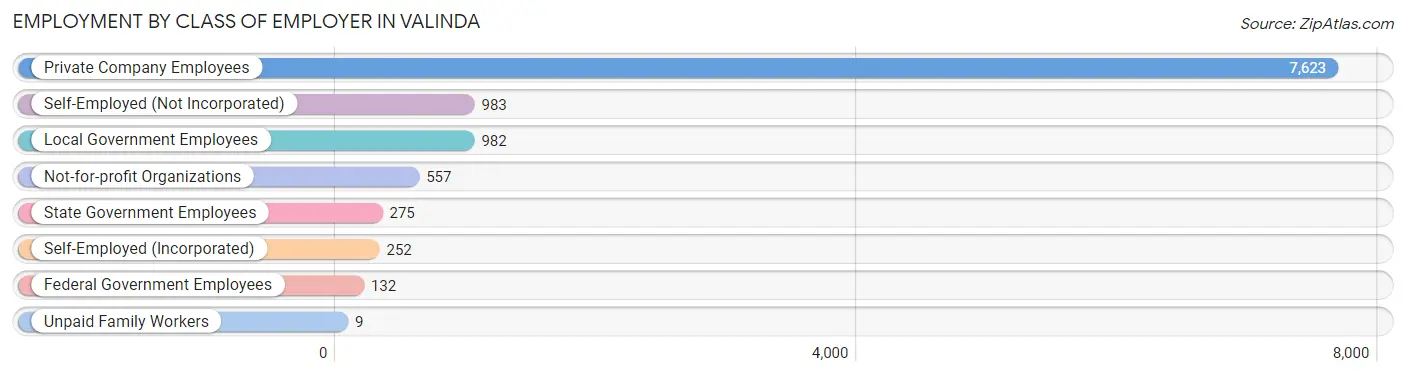
| Employer Class | # Employees | % Employees |
| Private Company Employees | 7,623 | 70.5% |
| Self-Employed (Incorporated) | 252 | 2.3% |
| Self-Employed (Not Incorporated) | 983 | 9.1% |
| Not-for-profit Organizations | 557 | 5.1% |
| Local Government Employees | 982 | 9.1% |
| State Government Employees | 275 | 2.5% |
| Federal Government Employees | 132 | 1.2% |
| Unpaid Family Workers | 9 | 0.1% |
| Total | 10,813 | 100.0% |
Employment Status by Age in Valinda
According to the labor force statistics for Valinda, out of the total population over 16 years of age (18,184), 65.3% or 11,874 individuals are in the labor force, with 6.0% or 712 of them unemployed. The age group with the highest labor force participation rate is 25 to 29 years, with 89.2% or 1,522 individuals in the labor force. Within the labor force, the 16 to 19 years age range has the highest percentage of unemployed individuals, with 17.7% or 81 of them being unemployed.
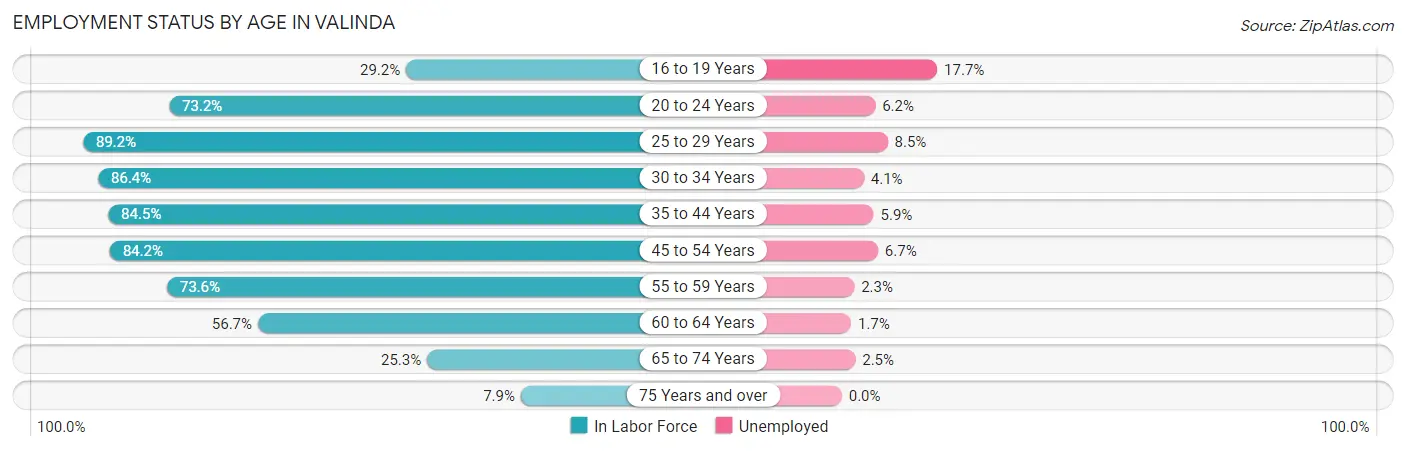
| Age Bracket | In Labor Force | Unemployed |
| 16 to 19 Years | 458 (29.2%) | 81 (17.7%) |
| 20 to 24 Years | 1,353 (73.2%) | 84 (6.2%) |
| 25 to 29 Years | 1,522 (89.2%) | 129 (8.5%) |
| 30 to 34 Years | 1,090 (86.4%) | 45 (4.1%) |
| 35 to 44 Years | 2,671 (84.5%) | 158 (5.9%) |
| 45 to 54 Years | 2,359 (84.2%) | 158 (6.7%) |
| 55 to 59 Years | 1,211 (73.6%) | 28 (2.3%) |
| 60 to 64 Years | 657 (56.7%) | 11 (1.7%) |
| 65 to 74 Years | 471 (25.3%) | 12 (2.5%) |
| 75 Years and over | 93 (7.9%) | 0 (0.0%) |
| Total | 11,874 (65.3%) | 712 (6.0%) |
Employment Status by Educational Attainment in Valinda
According to labor force statistics for Valinda, 81.0% of individuals (9,505) out of the total population between 25 and 64 years of age (11,734) are in the labor force, with 5.6% or 532 of them being unemployed. The group with the highest labor force participation rate are those with the educational attainment of bachelor's degree or higher, with 90.1% or 1,703 individuals in the labor force. Within the labor force, individuals with high school diploma education have the highest percentage of unemployment, with 7.1% or 206 of them being unemployed.
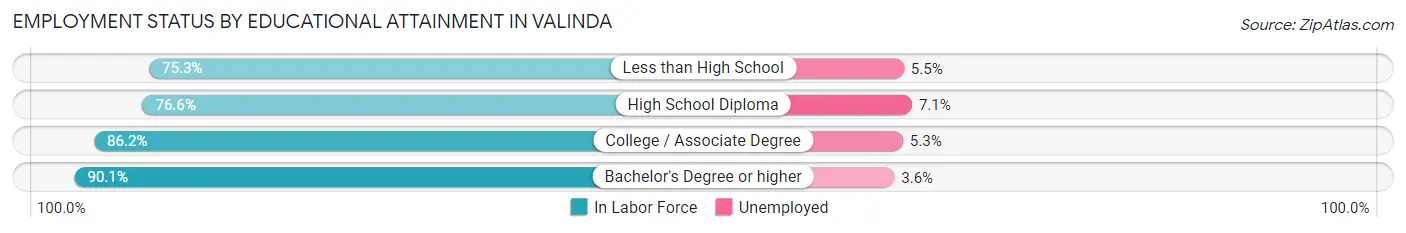
| Educational Attainment | In Labor Force | Unemployed |
| Less than High School | 2,185 (75.3%) | 160 (5.5%) |
| High School Diploma | 2,898 (76.6%) | 269 (7.1%) |
| College / Associate Degree | 2,723 (86.2%) | 167 (5.3%) |
| Bachelor's Degree or higher | 1,703 (90.1%) | 68 (3.6%) |
| Total | 9,505 (81.0%) | 657 (5.6%) |
Employment Occupations by Sex in Valinda
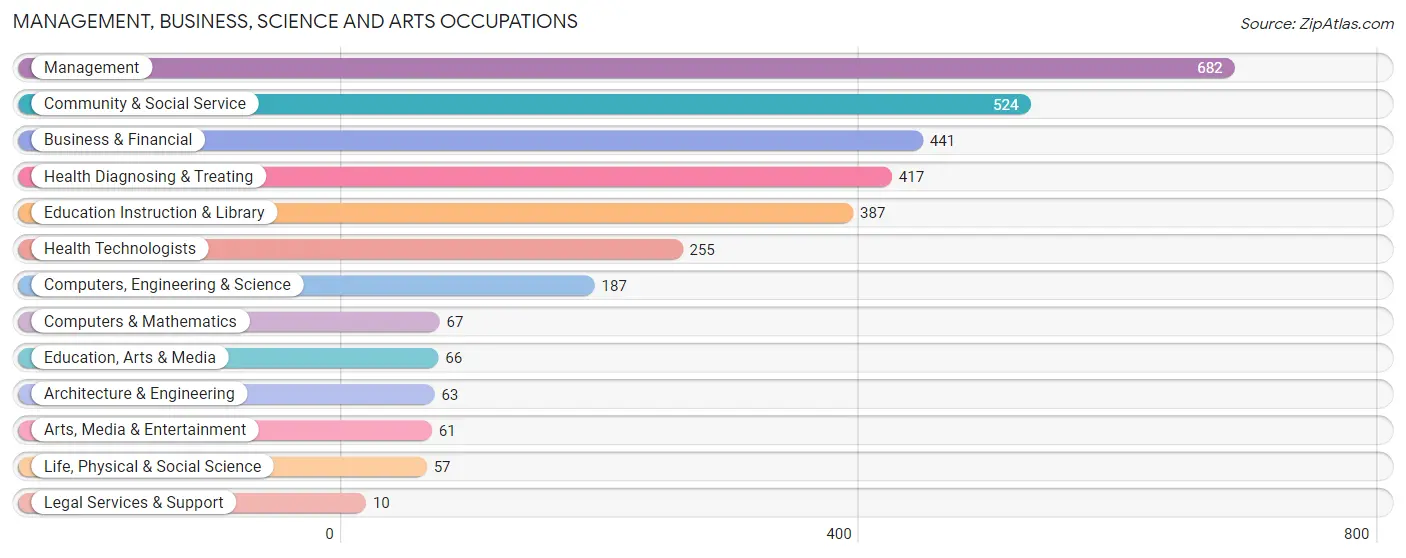
Management, Business, Science and Arts Occupations
The most common Management, Business, Science and Arts occupations in Valinda are Management (682 | 6.1%), Community & Social Service (524 | 4.7%), Business & Financial (441 | 4.0%), Health Diagnosing & Treating (417 | 3.7%), and Education Instruction & Library (387 | 3.5%).
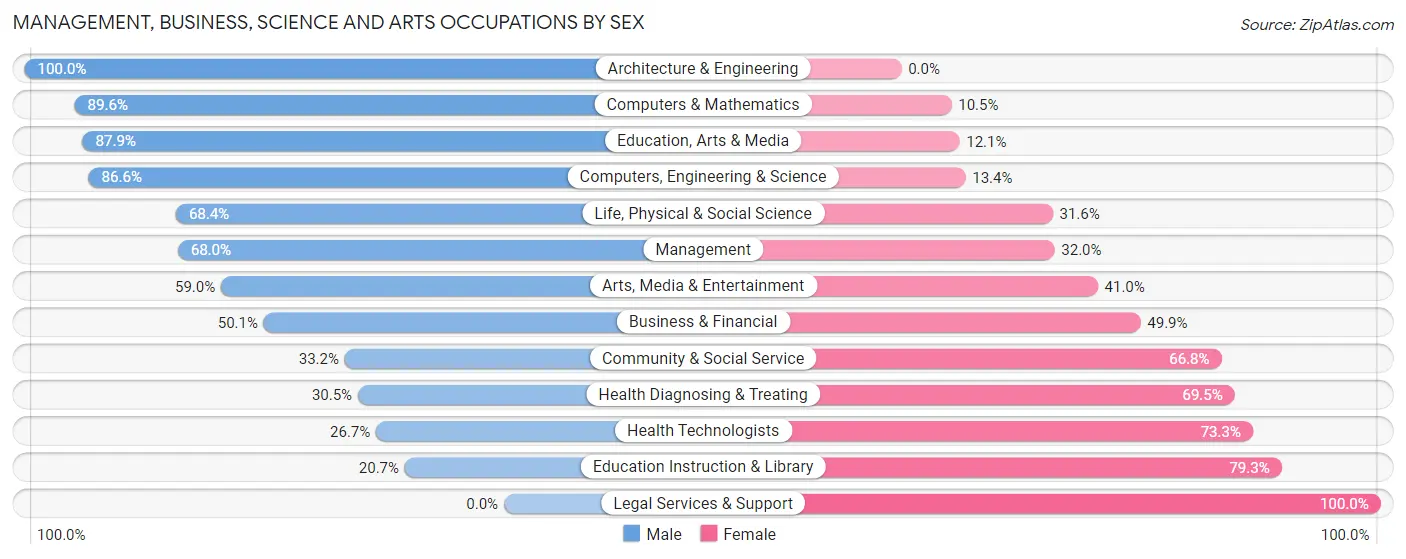
Management, Business, Science and Arts Occupations by Sex
Within the Management, Business, Science and Arts occupations in Valinda, the most male-oriented occupations are Architecture & Engineering (100.0%), Computers & Mathematics (89.5%), and Education, Arts & Media (87.9%), while the most female-oriented occupations are Legal Services & Support (100.0%), Education Instruction & Library (79.3%), and Health Technologists (73.3%).
| Occupation | Male | Female |
| Management | 464 (68.0%) | 218 (32.0%) |
| Business & Financial | 221 (50.1%) | 220 (49.9%) |
| Computers, Engineering & Science | 162 (86.6%) | 25 (13.4%) |
| Computers & Mathematics | 60 (89.5%) | 7 (10.4%) |
| Architecture & Engineering | 63 (100.0%) | 0 (0.0%) |
| Life, Physical & Social Science | 39 (68.4%) | 18 (31.6%) |
| Community & Social Service | 174 (33.2%) | 350 (66.8%) |
| Education, Arts & Media | 58 (87.9%) | 8 (12.1%) |
| Legal Services & Support | 0 (0.0%) | 10 (100.0%) |
| Education Instruction & Library | 80 (20.7%) | 307 (79.3%) |
| Arts, Media & Entertainment | 36 (59.0%) | 25 (41.0%) |
| Health Diagnosing & Treating | 127 (30.5%) | 290 (69.5%) |
| Health Technologists | 68 (26.7%) | 187 (73.3%) |
| Total (Category) | 1,148 (51.0%) | 1,103 (49.0%) |
| Total (Overall) | 6,432 (57.6%) | 4,737 (42.4%) |
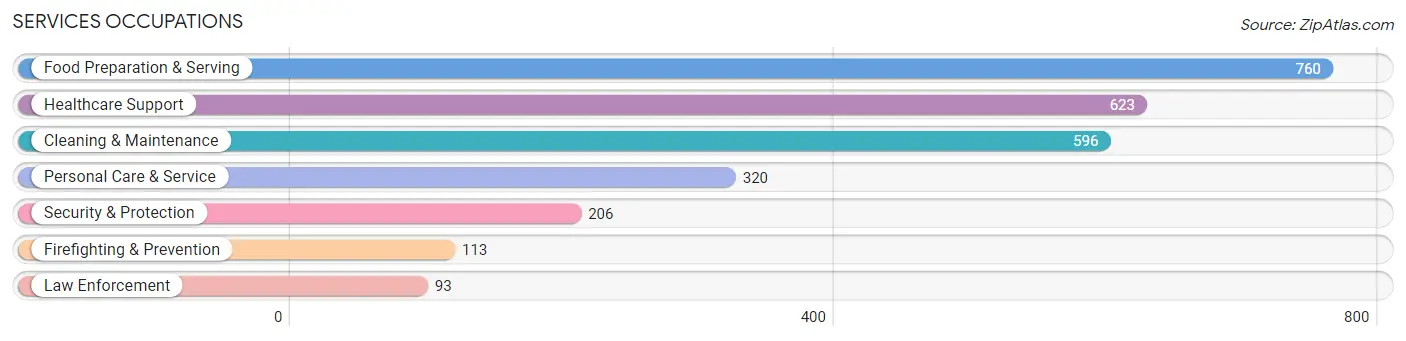
Services Occupations
The most common Services occupations in Valinda are Food Preparation & Serving (760 | 6.8%), Healthcare Support (623 | 5.6%), Cleaning & Maintenance (596 | 5.3%), Personal Care & Service (320 | 2.9%), and Security & Protection (206 | 1.8%).
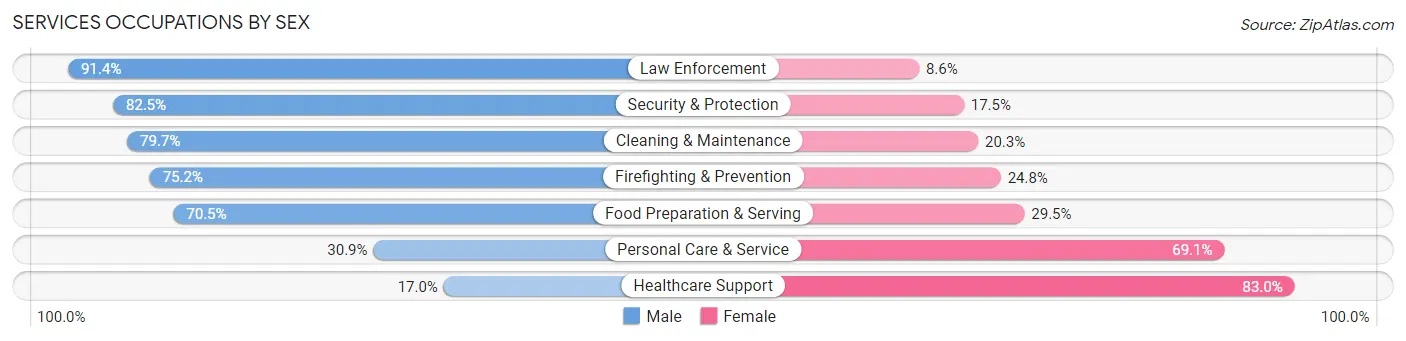
Services Occupations by Sex
Within the Services occupations in Valinda, the most male-oriented occupations are Law Enforcement (91.4%), Security & Protection (82.5%), and Cleaning & Maintenance (79.7%), while the most female-oriented occupations are Healthcare Support (83.0%), Personal Care & Service (69.1%), and Food Preparation & Serving (29.5%).
| Occupation | Male | Female |
| Healthcare Support | 106 (17.0%) | 517 (83.0%) |
| Security & Protection | 170 (82.5%) | 36 (17.5%) |
| Firefighting & Prevention | 85 (75.2%) | 28 (24.8%) |
| Law Enforcement | 85 (91.4%) | 8 (8.6%) |
| Food Preparation & Serving | 536 (70.5%) | 224 (29.5%) |
| Cleaning & Maintenance | 475 (79.7%) | 121 (20.3%) |
| Personal Care & Service | 99 (30.9%) | 221 (69.1%) |
| Total (Category) | 1,386 (55.3%) | 1,119 (44.7%) |
| Total (Overall) | 6,432 (57.6%) | 4,737 (42.4%) |
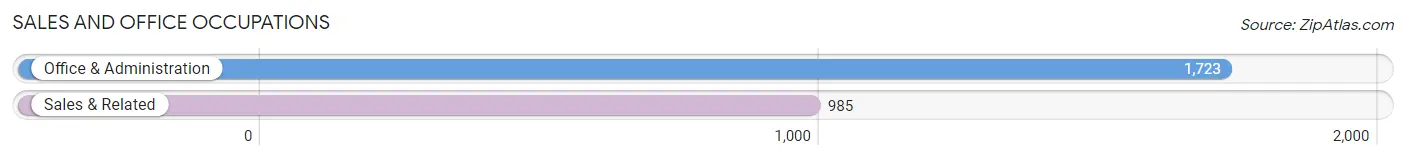
Sales and Office Occupations
The most common Sales and Office occupations in Valinda are Office & Administration (1,723 | 15.4%), and Sales & Related (985 | 8.8%).
Sales and Office Occupations by Sex
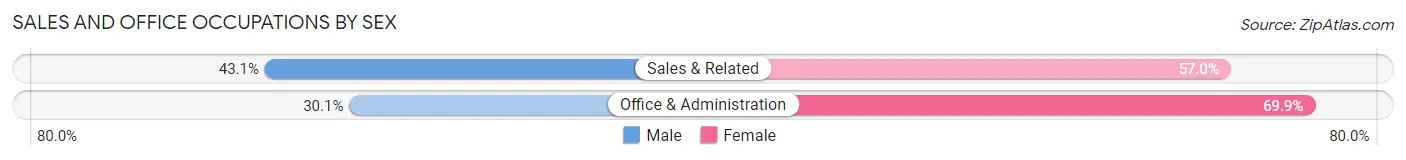
| Occupation | Male | Female |
| Sales & Related | 424 (43.0%) | 561 (57.0%) |
| Office & Administration | 518 (30.1%) | 1,205 (69.9%) |
| Total (Category) | 942 (34.8%) | 1,766 (65.2%) |
| Total (Overall) | 6,432 (57.6%) | 4,737 (42.4%) |
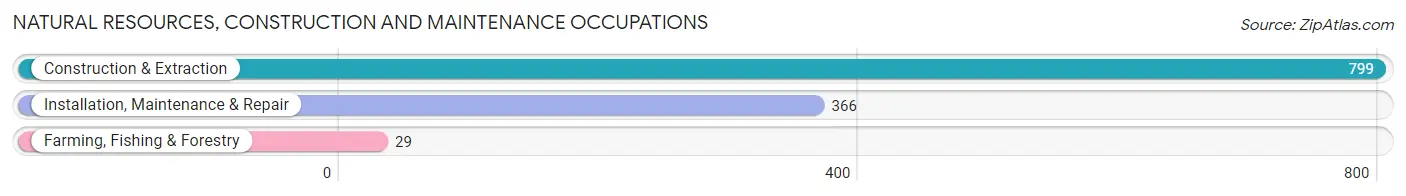
Natural Resources, Construction and Maintenance Occupations
The most common Natural Resources, Construction and Maintenance occupations in Valinda are Construction & Extraction (799 | 7.1%), Installation, Maintenance & Repair (366 | 3.3%), and Farming, Fishing & Forestry (29 | 0.3%).
Natural Resources, Construction and Maintenance Occupations by Sex
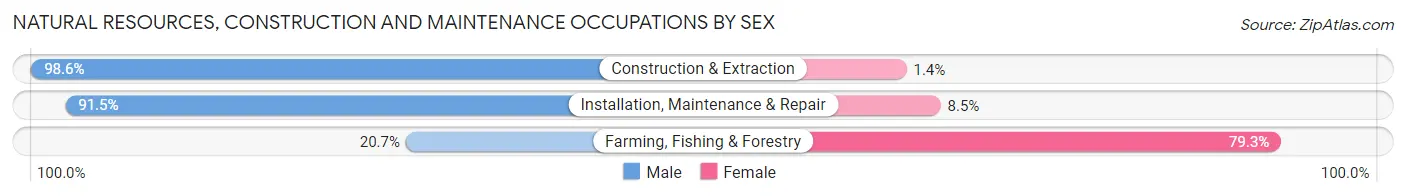
| Occupation | Male | Female |
| Farming, Fishing & Forestry | 6 (20.7%) | 23 (79.3%) |
| Construction & Extraction | 788 (98.6%) | 11 (1.4%) |
| Installation, Maintenance & Repair | 335 (91.5%) | 31 (8.5%) |
| Total (Category) | 1,129 (94.6%) | 65 (5.4%) |
| Total (Overall) | 6,432 (57.6%) | 4,737 (42.4%) |
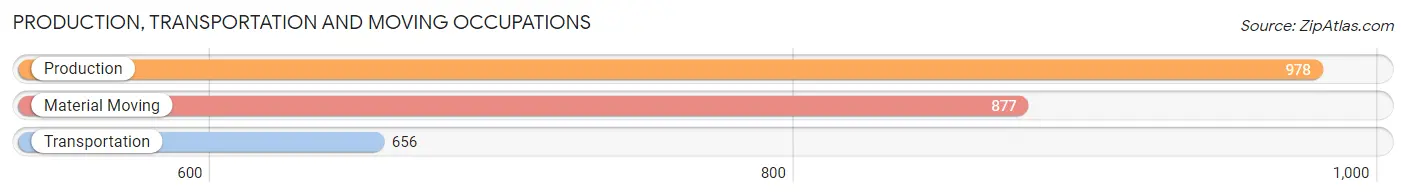
Production, Transportation and Moving Occupations
The most common Production, Transportation and Moving occupations in Valinda are Production (978 | 8.8%), Material Moving (877 | 7.9%), and Transportation (656 | 5.9%).
Production, Transportation and Moving Occupations by Sex
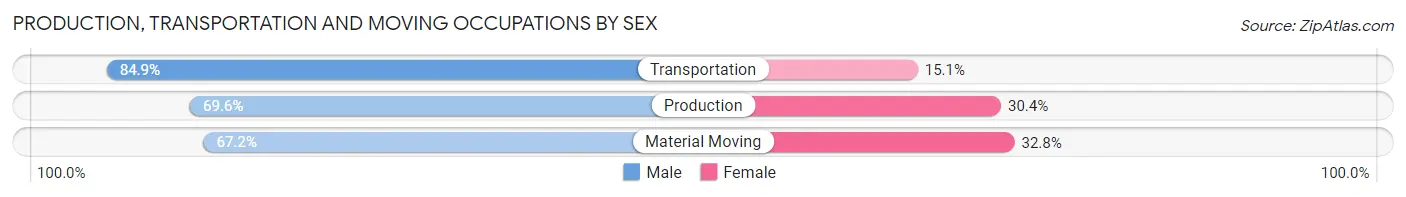
| Occupation | Male | Female |
| Production | 681 (69.6%) | 297 (30.4%) |
| Transportation | 557 (84.9%) | 99 (15.1%) |
| Material Moving | 589 (67.2%) | 288 (32.8%) |
| Total (Category) | 1,827 (72.8%) | 684 (27.2%) |
| Total (Overall) | 6,432 (57.6%) | 4,737 (42.4%) |
Employment Industries by Sex in Valinda
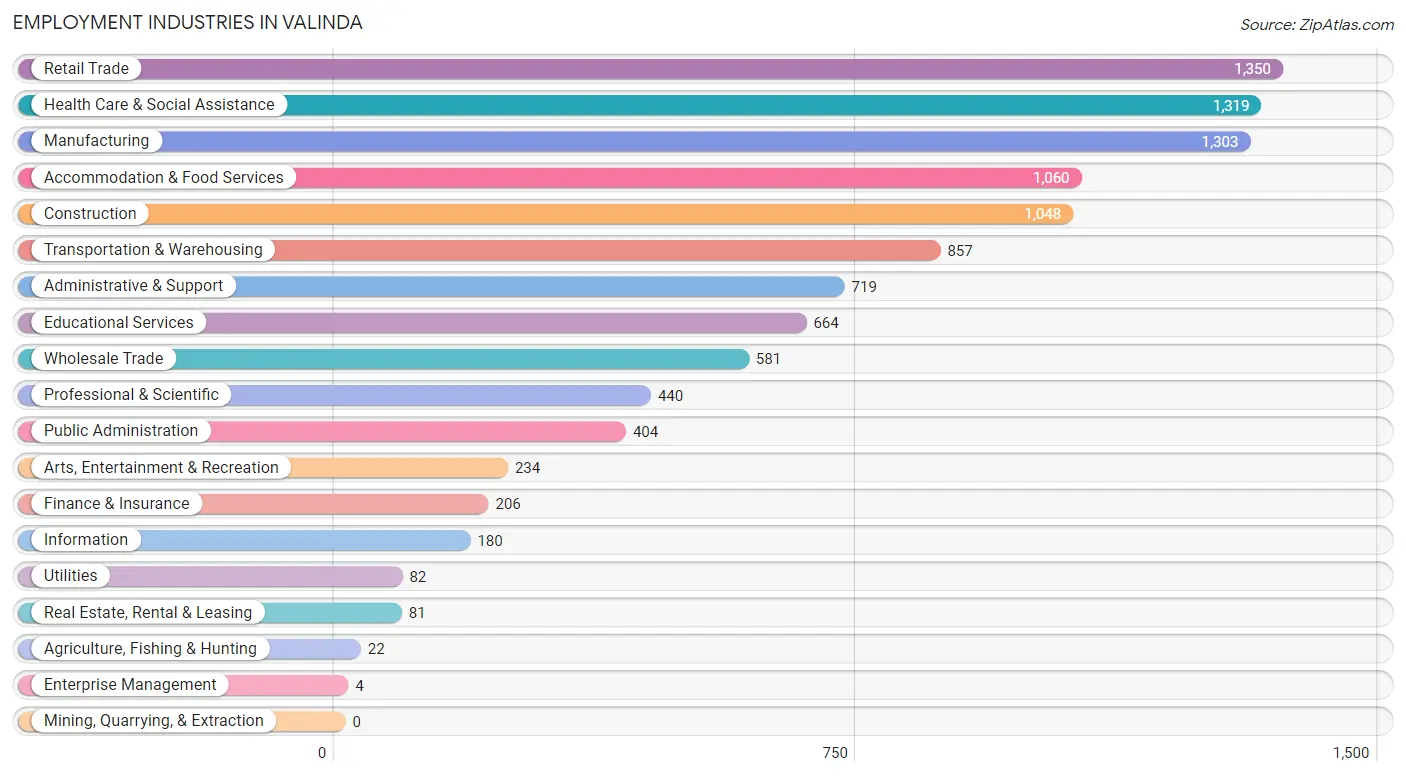
Employment Industries in Valinda
The major employment industries in Valinda include Retail Trade (1,350 | 12.1%), Health Care & Social Assistance (1,319 | 11.8%), Manufacturing (1,303 | 11.7%), Accommodation & Food Services (1,060 | 9.5%), and Construction (1,048 | 9.4%).
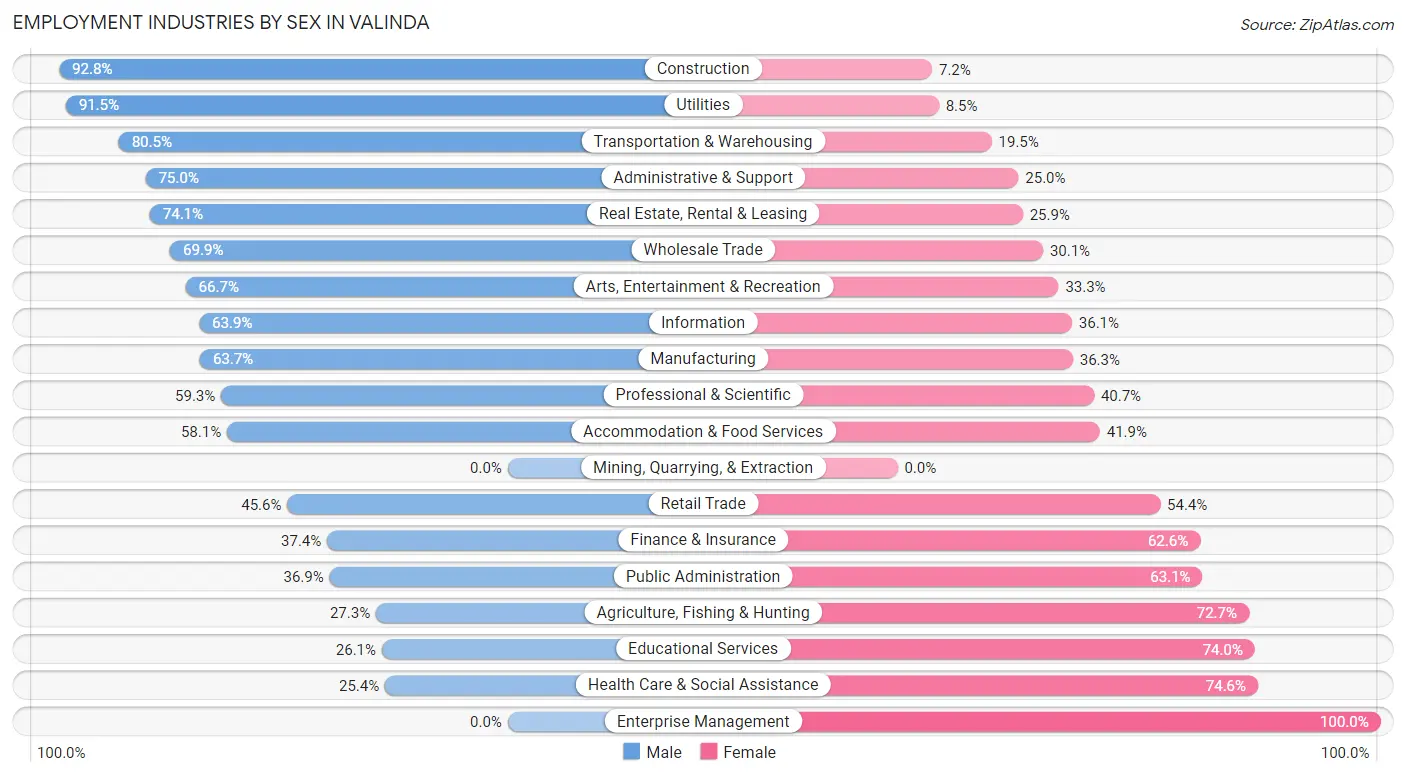
Employment Industries by Sex in Valinda
The Valinda industries that see more men than women are Construction (92.8%), Utilities (91.5%), and Transportation & Warehousing (80.5%), whereas the industries that tend to have a higher number of women are Enterprise Management (100.0%), Health Care & Social Assistance (74.6%), and Educational Services (74.0%).
| Industry | Male | Female |
| Agriculture, Fishing & Hunting | 6 (27.3%) | 16 (72.7%) |
| Mining, Quarrying, & Extraction | 0 (0.0%) | 0 (0.0%) |
| Construction | 973 (92.8%) | 75 (7.2%) |
| Manufacturing | 830 (63.7%) | 473 (36.3%) |
| Wholesale Trade | 406 (69.9%) | 175 (30.1%) |
| Retail Trade | 616 (45.6%) | 734 (54.4%) |
| Transportation & Warehousing | 690 (80.5%) | 167 (19.5%) |
| Utilities | 75 (91.5%) | 7 (8.5%) |
| Information | 115 (63.9%) | 65 (36.1%) |
| Finance & Insurance | 77 (37.4%) | 129 (62.6%) |
| Real Estate, Rental & Leasing | 60 (74.1%) | 21 (25.9%) |
| Professional & Scientific | 261 (59.3%) | 179 (40.7%) |
| Enterprise Management | 0 (0.0%) | 4 (100.0%) |
| Administrative & Support | 539 (75.0%) | 180 (25.0%) |
| Educational Services | 173 (26.1%) | 491 (74.0%) |
| Health Care & Social Assistance | 335 (25.4%) | 984 (74.6%) |
| Arts, Entertainment & Recreation | 156 (66.7%) | 78 (33.3%) |
| Accommodation & Food Services | 616 (58.1%) | 444 (41.9%) |
| Public Administration | 149 (36.9%) | 255 (63.1%) |
| Total | 6,432 (57.6%) | 4,737 (42.4%) |
Education in Valinda
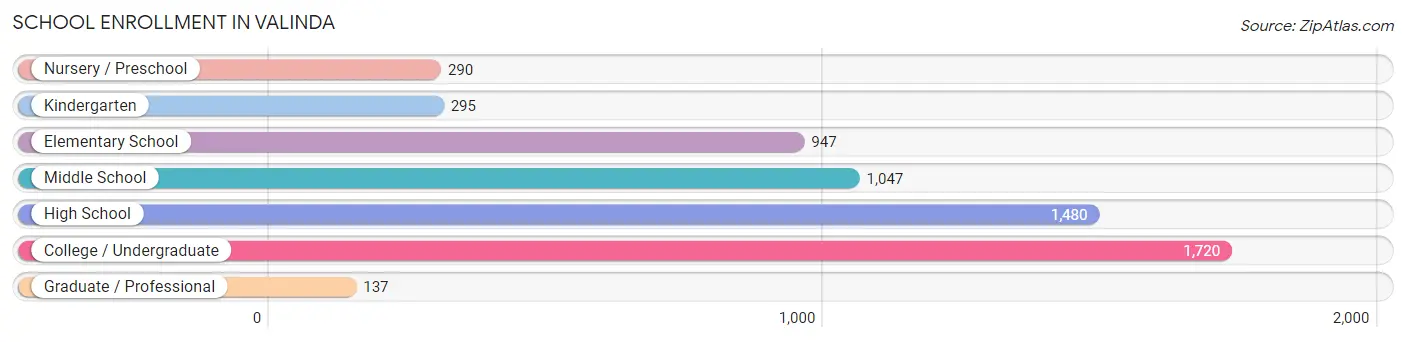
School Enrollment in Valinda
The most common levels of schooling among the 5,916 students in Valinda are college / undergraduate (1,720 | 29.1%), high school (1,480 | 25.0%), and middle school (1,047 | 17.7%).
| School Level | # Students | % Students |
| Nursery / Preschool | 290 | 4.9% |
| Kindergarten | 295 | 5.0% |
| Elementary School | 947 | 16.0% |
| Middle School | 1,047 | 17.7% |
| High School | 1,480 | 25.0% |
| College / Undergraduate | 1,720 | 29.1% |
| Graduate / Professional | 137 | 2.3% |
| Total | 5,916 | 100.0% |
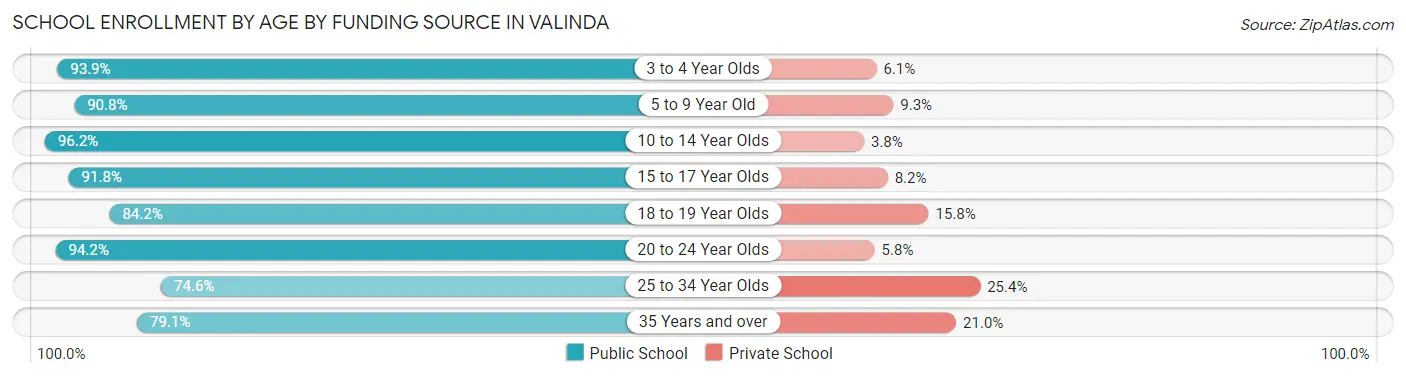
School Enrollment by Age by Funding Source in Valinda
Out of a total of 5,916 students who are enrolled in schools in Valinda, 562 (9.5%) attend a private institution, while the remaining 5,354 (90.5%) are enrolled in public schools. The age group of 25 to 34 year olds has the highest likelihood of being enrolled in private schools, with 115 (25.4% in the age bracket) enrolled. Conversely, the age group of 10 to 14 year olds has the lowest likelihood of being enrolled in a private school, with 1,448 (96.2% in the age bracket) attending a public institution.
| Age Bracket | Public School | Private School |
| 3 to 4 Year Olds | 292 (93.9%) | 19 (6.1%) |
| 5 to 9 Year Old | 942 (90.7%) | 96 (9.2%) |
| 10 to 14 Year Olds | 1,448 (96.2%) | 57 (3.8%) |
| 15 to 17 Year Olds | 805 (91.8%) | 72 (8.2%) |
| 18 to 19 Year Olds | 596 (84.2%) | 112 (15.8%) |
| 20 to 24 Year Olds | 768 (94.2%) | 47 (5.8%) |
| 25 to 34 Year Olds | 337 (74.6%) | 115 (25.4%) |
| 35 Years and over | 166 (79.0%) | 44 (20.9%) |
| Total | 5,354 (90.5%) | 562 (9.5%) |
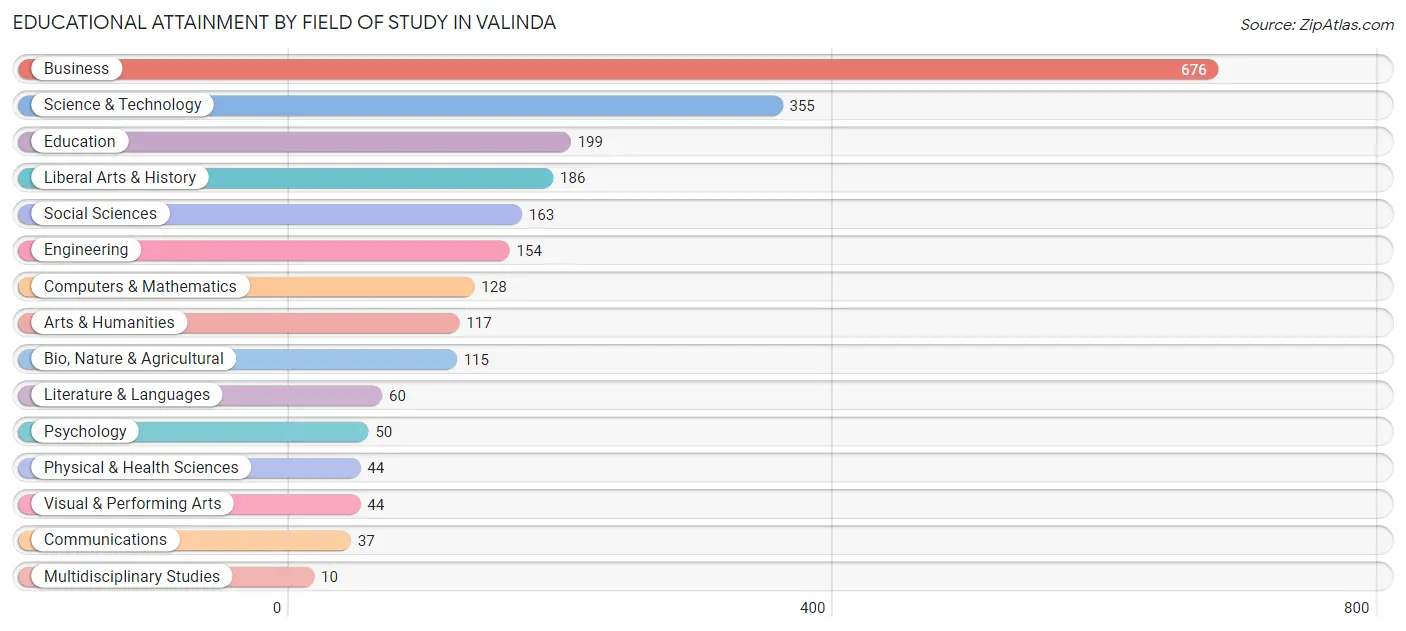
Educational Attainment by Field of Study in Valinda
Business (676 | 28.9%), science & technology (355 | 15.2%), education (199 | 8.5%), liberal arts & history (186 | 8.0%), and social sciences (163 | 7.0%) are the most common fields of study among 2,338 individuals in Valinda who have obtained a bachelor's degree or higher.
| Field of Study | # Graduates | % Graduates |
| Computers & Mathematics | 128 | 5.5% |
| Bio, Nature & Agricultural | 115 | 4.9% |
| Physical & Health Sciences | 44 | 1.9% |
| Psychology | 50 | 2.1% |
| Social Sciences | 163 | 7.0% |
| Engineering | 154 | 6.6% |
| Multidisciplinary Studies | 10 | 0.4% |
| Science & Technology | 355 | 15.2% |
| Business | 676 | 28.9% |
| Education | 199 | 8.5% |
| Literature & Languages | 60 | 2.6% |
| Liberal Arts & History | 186 | 8.0% |
| Visual & Performing Arts | 44 | 1.9% |
| Communications | 37 | 1.6% |
| Arts & Humanities | 117 | 5.0% |
| Total | 2,338 | 100.0% |
Transportation & Commute in Valinda
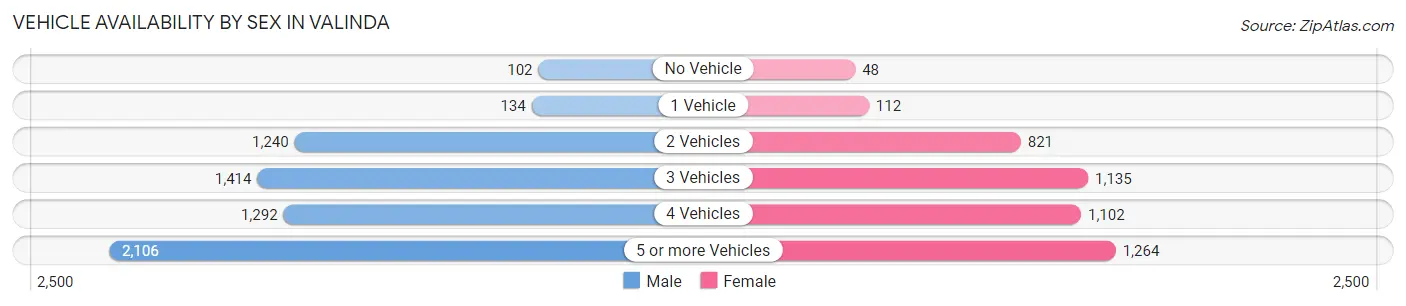
Vehicle Availability by Sex in Valinda
The most prevalent vehicle ownership categories in Valinda are males with 5 or more vehicles (2,106, accounting for 33.5%) and females with 5 or more vehicles (1,264, making up 47.0%).
| Vehicles Available | Male | Female |
| No Vehicle | 102 (1.6%) | 48 (1.1%) |
| 1 Vehicle | 134 (2.1%) | 112 (2.5%) |
| 2 Vehicles | 1,240 (19.7%) | 821 (18.3%) |
| 3 Vehicles | 1,414 (22.5%) | 1,135 (25.3%) |
| 4 Vehicles | 1,292 (20.5%) | 1,102 (24.6%) |
| 5 or more Vehicles | 2,106 (33.5%) | 1,264 (28.2%) |
| Total | 6,288 (100.0%) | 4,482 (100.0%) |
Commute Time in Valinda
The most frequently occuring commute durations in Valinda are 30 to 34 minutes (1,720 commuters, 16.8%), 60 to 89 minutes (1,458 commuters, 14.2%), and 15 to 19 minutes (1,387 commuters, 13.5%).
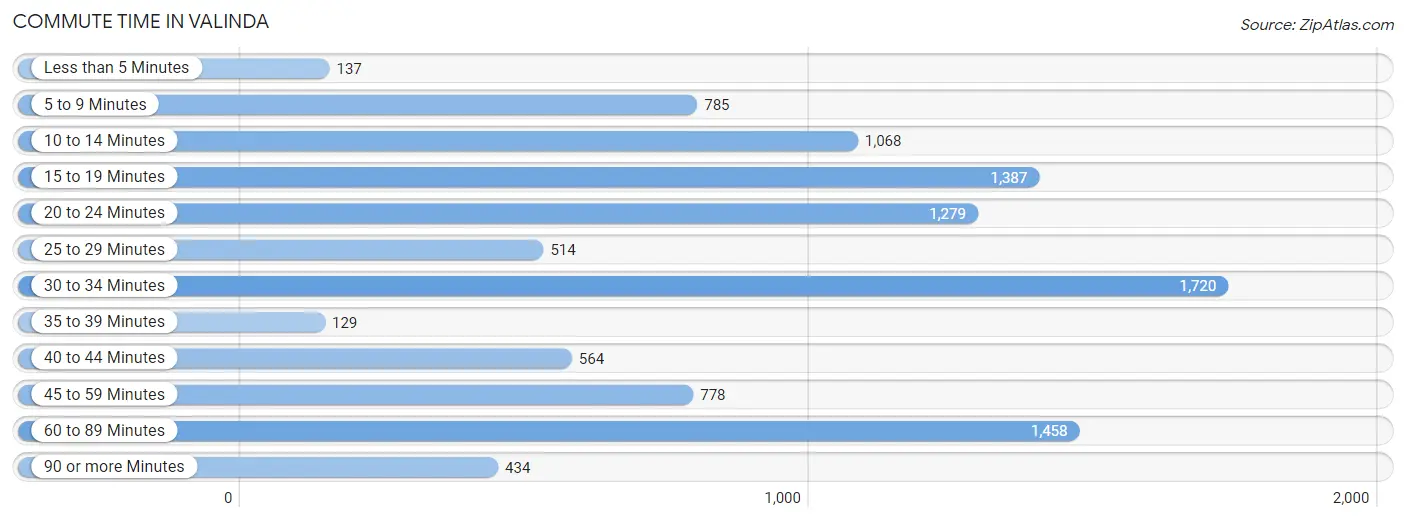
| Commute Time | # Commuters | % Commuters |
| Less than 5 Minutes | 137 | 1.3% |
| 5 to 9 Minutes | 785 | 7.7% |
| 10 to 14 Minutes | 1,068 | 10.4% |
| 15 to 19 Minutes | 1,387 | 13.5% |
| 20 to 24 Minutes | 1,279 | 12.5% |
| 25 to 29 Minutes | 514 | 5.0% |
| 30 to 34 Minutes | 1,720 | 16.8% |
| 35 to 39 Minutes | 129 | 1.3% |
| 40 to 44 Minutes | 564 | 5.5% |
| 45 to 59 Minutes | 778 | 7.6% |
| 60 to 89 Minutes | 1,458 | 14.2% |
| 90 or more Minutes | 434 | 4.2% |
Commute Time by Sex in Valinda
The most common commute times in Valinda are 30 to 34 minutes (1,055 commuters, 17.2%) for males and 30 to 34 minutes (665 commuters, 16.1%) for females.
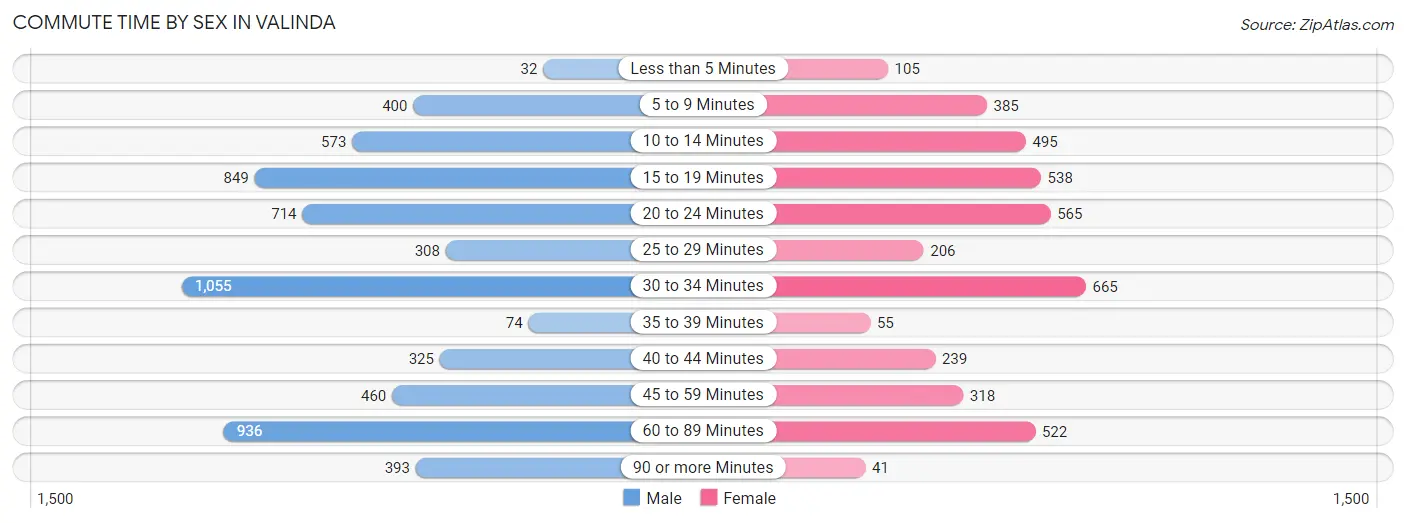
| Commute Time | Male | Female |
| Less than 5 Minutes | 32 (0.5%) | 105 (2.5%) |
| 5 to 9 Minutes | 400 (6.5%) | 385 (9.3%) |
| 10 to 14 Minutes | 573 (9.4%) | 495 (12.0%) |
| 15 to 19 Minutes | 849 (13.9%) | 538 (13.0%) |
| 20 to 24 Minutes | 714 (11.7%) | 565 (13.7%) |
| 25 to 29 Minutes | 308 (5.0%) | 206 (5.0%) |
| 30 to 34 Minutes | 1,055 (17.2%) | 665 (16.1%) |
| 35 to 39 Minutes | 74 (1.2%) | 55 (1.3%) |
| 40 to 44 Minutes | 325 (5.3%) | 239 (5.8%) |
| 45 to 59 Minutes | 460 (7.5%) | 318 (7.7%) |
| 60 to 89 Minutes | 936 (15.3%) | 522 (12.6%) |
| 90 or more Minutes | 393 (6.4%) | 41 (1.0%) |
Time of Departure to Work by Sex in Valinda
The most frequent times of departure to work in Valinda are 12:00 AM to 4:59 AM (989, 16.2%) for males and 6:00 AM to 6:29 AM (529, 12.8%) for females.
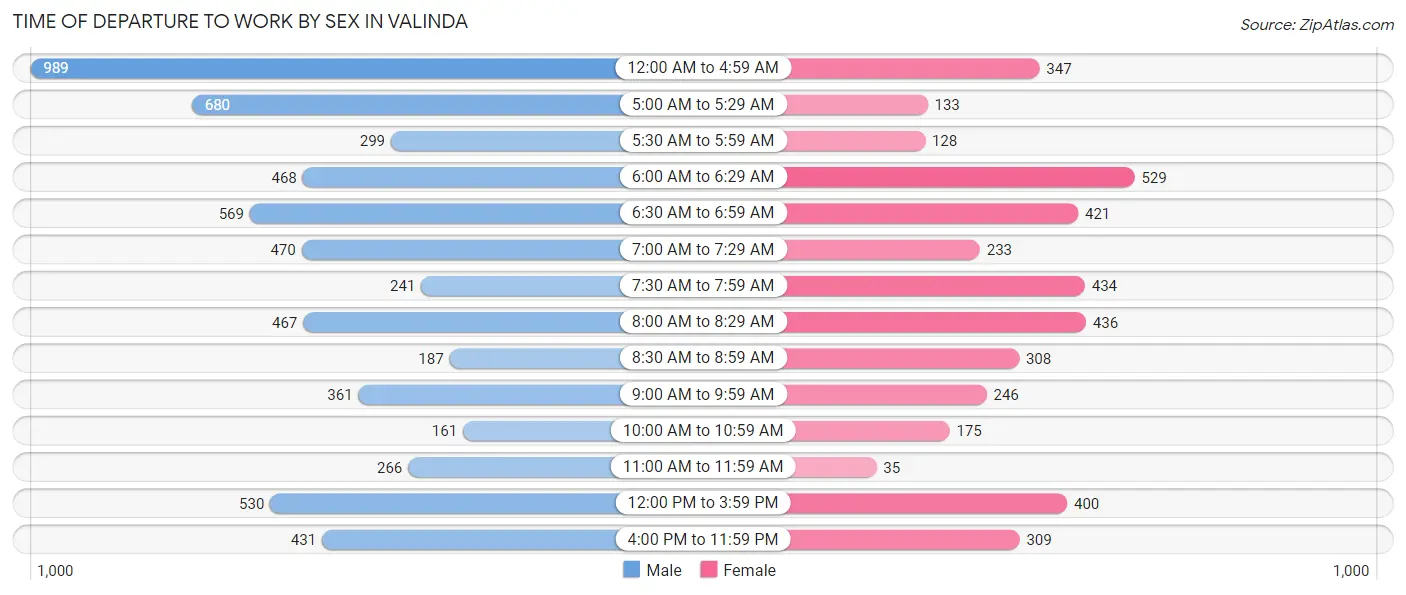
| Time of Departure | Male | Female |
| 12:00 AM to 4:59 AM | 989 (16.2%) | 347 (8.4%) |
| 5:00 AM to 5:29 AM | 680 (11.1%) | 133 (3.2%) |
| 5:30 AM to 5:59 AM | 299 (4.9%) | 128 (3.1%) |
| 6:00 AM to 6:29 AM | 468 (7.6%) | 529 (12.8%) |
| 6:30 AM to 6:59 AM | 569 (9.3%) | 421 (10.2%) |
| 7:00 AM to 7:29 AM | 470 (7.7%) | 233 (5.6%) |
| 7:30 AM to 7:59 AM | 241 (3.9%) | 434 (10.5%) |
| 8:00 AM to 8:29 AM | 467 (7.6%) | 436 (10.5%) |
| 8:30 AM to 8:59 AM | 187 (3.1%) | 308 (7.4%) |
| 9:00 AM to 9:59 AM | 361 (5.9%) | 246 (5.9%) |
| 10:00 AM to 10:59 AM | 161 (2.6%) | 175 (4.2%) |
| 11:00 AM to 11:59 AM | 266 (4.3%) | 35 (0.9%) |
| 12:00 PM to 3:59 PM | 530 (8.7%) | 400 (9.7%) |
| 4:00 PM to 11:59 PM | 431 (7.0%) | 309 (7.5%) |
| Total | 6,119 (100.0%) | 4,134 (100.0%) |
Housing Occupancy in Valinda
Occupancy by Ownership in Valinda
Of the total 4,665 dwellings in Valinda, owner-occupied units account for 3,561 (76.3%), while renter-occupied units make up 1,104 (23.7%).
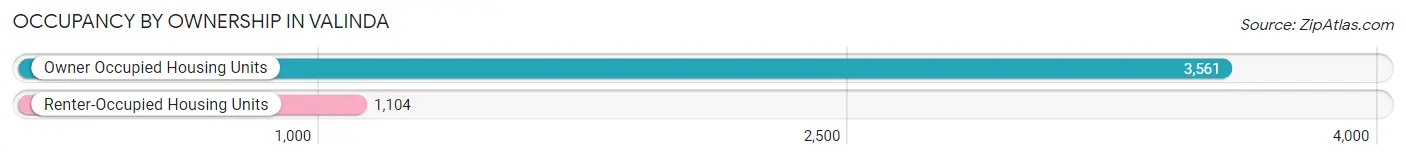
| Occupancy | # Housing Units | % Housing Units |
| Owner Occupied Housing Units | 3,561 | 76.3% |
| Renter-Occupied Housing Units | 1,104 | 23.7% |
| Total Occupied Housing Units | 4,665 | 100.0% |
Occupancy by Household Size in Valinda
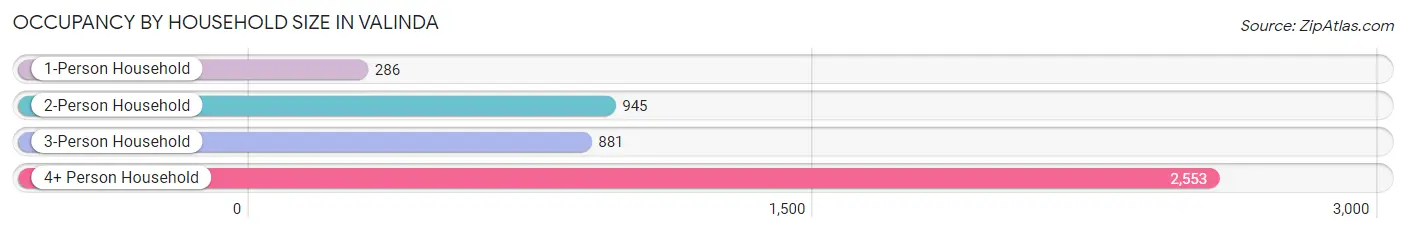
| Household Size | # Housing Units | % Housing Units |
| 1-Person Household | 286 | 6.1% |
| 2-Person Household | 945 | 20.3% |
| 3-Person Household | 881 | 18.9% |
| 4+ Person Household | 2,553 | 54.7% |
| Total Housing Units | 4,665 | 100.0% |
Occupancy by Ownership by Household Size in Valinda
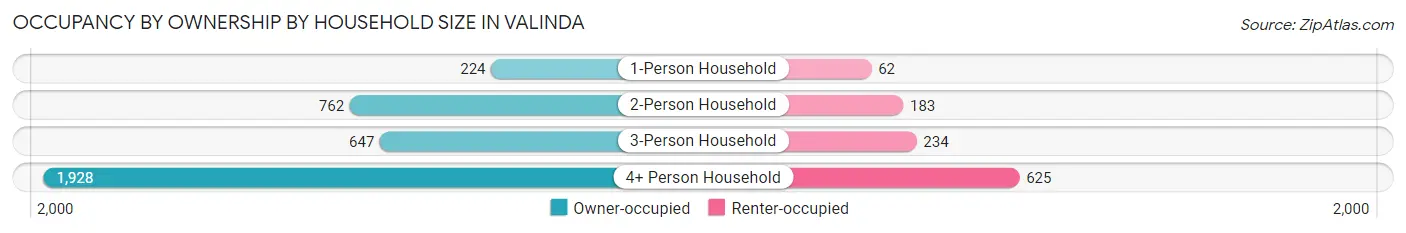
| Household Size | Owner-occupied | Renter-occupied |
| 1-Person Household | 224 (78.3%) | 62 (21.7%) |
| 2-Person Household | 762 (80.6%) | 183 (19.4%) |
| 3-Person Household | 647 (73.4%) | 234 (26.6%) |
| 4+ Person Household | 1,928 (75.5%) | 625 (24.5%) |
| Total Housing Units | 3,561 (76.3%) | 1,104 (23.7%) |
Occupancy by Educational Attainment in Valinda
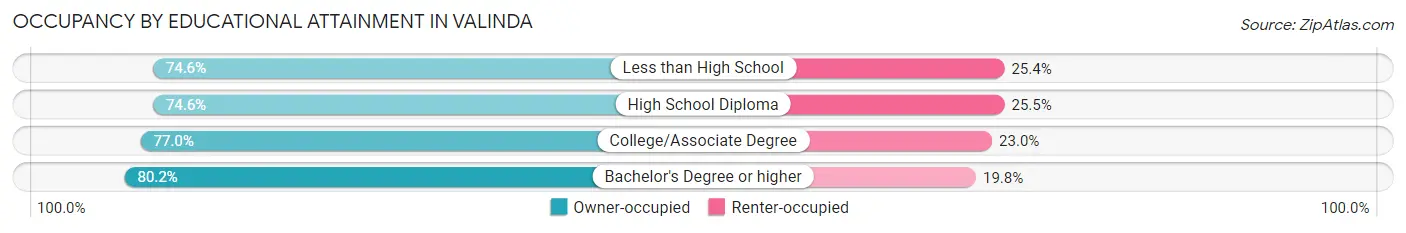
| Household Size | Owner-occupied | Renter-occupied |
| Less than High School | 891 (74.6%) | 304 (25.4%) |
| High School Diploma | 917 (74.6%) | 313 (25.5%) |
| College/Associate Degree | 1,048 (77.0%) | 313 (23.0%) |
| Bachelor's Degree or higher | 705 (80.2%) | 174 (19.8%) |
Occupancy by Age of Householder in Valinda
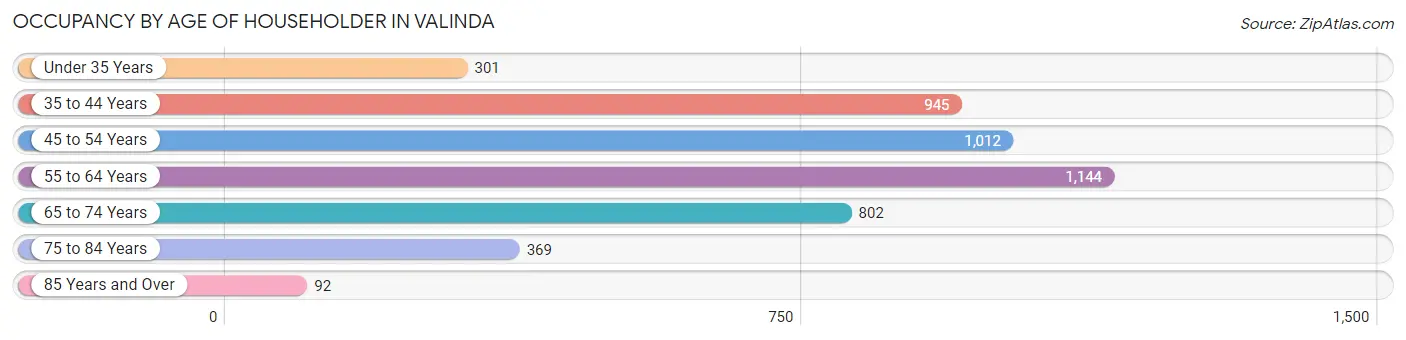
| Age Bracket | # Households | % Households |
| Under 35 Years | 301 | 6.5% |
| 35 to 44 Years | 945 | 20.3% |
| 45 to 54 Years | 1,012 | 21.7% |
| 55 to 64 Years | 1,144 | 24.5% |
| 65 to 74 Years | 802 | 17.2% |
| 75 to 84 Years | 369 | 7.9% |
| 85 Years and Over | 92 | 2.0% |
| Total | 4,665 | 100.0% |
Housing Finances in Valinda
Median Income by Occupancy in Valinda
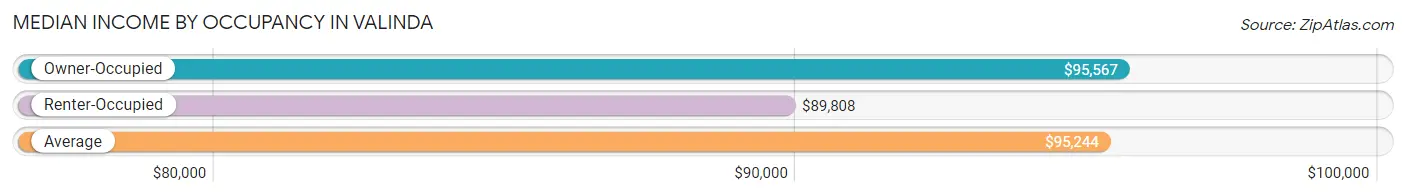
| Occupancy Type | # Households | Median Income |
| Owner-Occupied | 3,561 (76.3%) | $95,567 |
| Renter-Occupied | 1,104 (23.7%) | $89,808 |
| Average | 4,665 (100.0%) | $95,244 |
Occupancy by Householder Income Bracket in Valinda
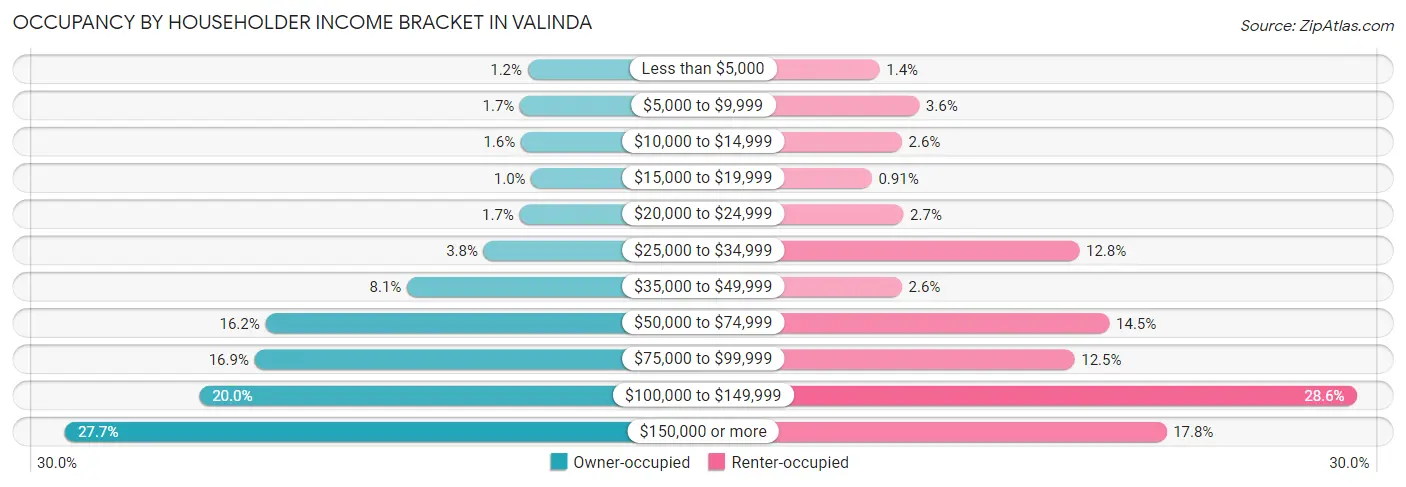
| Income Bracket | Owner-occupied | Renter-occupied |
| Less than $5,000 | 44 (1.2%) | 15 (1.4%) |
| $5,000 to $9,999 | 60 (1.7%) | 40 (3.6%) |
| $10,000 to $14,999 | 58 (1.6%) | 29 (2.6%) |
| $15,000 to $19,999 | 37 (1.0%) | 10 (0.9%) |
| $20,000 to $24,999 | 61 (1.7%) | 30 (2.7%) |
| $25,000 to $34,999 | 134 (3.8%) | 141 (12.8%) |
| $35,000 to $49,999 | 290 (8.1%) | 29 (2.6%) |
| $50,000 to $74,999 | 578 (16.2%) | 160 (14.5%) |
| $75,000 to $99,999 | 600 (16.9%) | 138 (12.5%) |
| $100,000 to $149,999 | 713 (20.0%) | 316 (28.6%) |
| $150,000 or more | 986 (27.7%) | 196 (17.7%) |
| Total | 3,561 (100.0%) | 1,104 (100.0%) |
Monthly Housing Cost Tiers in Valinda
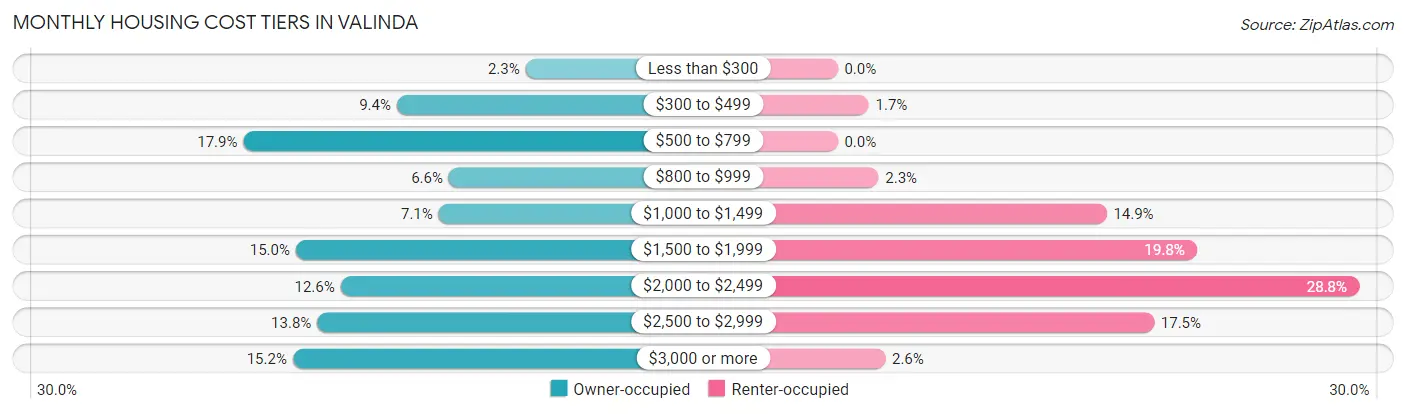
| Monthly Cost | Owner-occupied | Renter-occupied |
| Less than $300 | 83 (2.3%) | 0 (0.0%) |
| $300 to $499 | 336 (9.4%) | 19 (1.7%) |
| $500 to $799 | 638 (17.9%) | 0 (0.0%) |
| $800 to $999 | 234 (6.6%) | 25 (2.3%) |
| $1,000 to $1,499 | 254 (7.1%) | 164 (14.9%) |
| $1,500 to $1,999 | 535 (15.0%) | 219 (19.8%) |
| $2,000 to $2,499 | 447 (12.6%) | 318 (28.8%) |
| $2,500 to $2,999 | 493 (13.8%) | 193 (17.5%) |
| $3,000 or more | 541 (15.2%) | 29 (2.6%) |
| Total | 3,561 (100.0%) | 1,104 (100.0%) |
Physical Housing Characteristics in Valinda
Housing Structures in Valinda
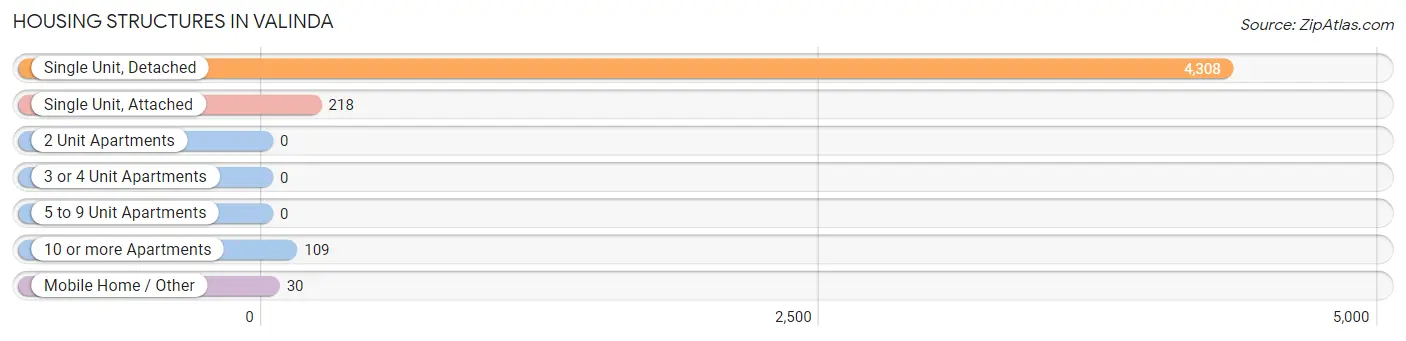
| Structure Type | # Housing Units | % Housing Units |
| Single Unit, Detached | 4,308 | 92.3% |
| Single Unit, Attached | 218 | 4.7% |
| 2 Unit Apartments | 0 | 0.0% |
| 3 or 4 Unit Apartments | 0 | 0.0% |
| 5 to 9 Unit Apartments | 0 | 0.0% |
| 10 or more Apartments | 109 | 2.3% |
| Mobile Home / Other | 30 | 0.6% |
| Total | 4,665 | 100.0% |
Housing Structures by Occupancy in Valinda
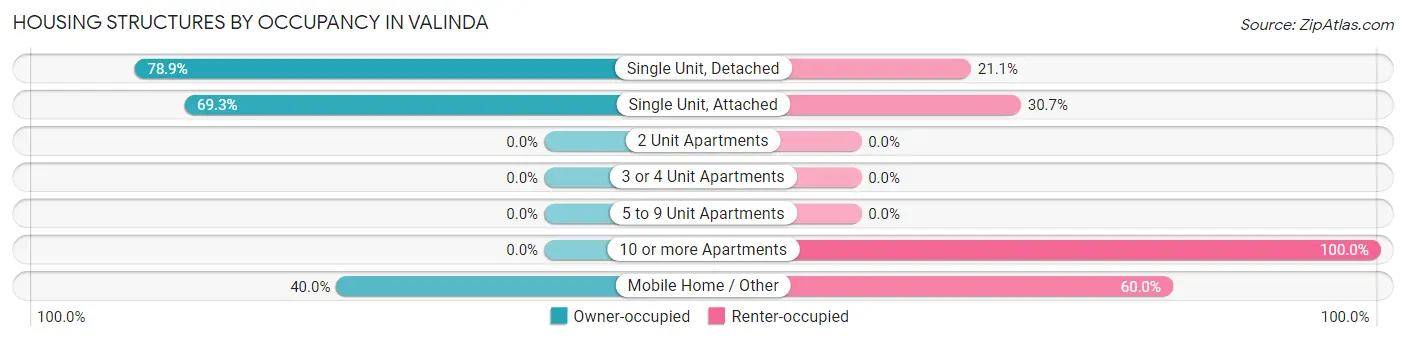
| Structure Type | Owner-occupied | Renter-occupied |
| Single Unit, Detached | 3,398 (78.9%) | 910 (21.1%) |
| Single Unit, Attached | 151 (69.3%) | 67 (30.7%) |
| 2 Unit Apartments | 0 (0.0%) | 0 (0.0%) |
| 3 or 4 Unit Apartments | 0 (0.0%) | 0 (0.0%) |
| 5 to 9 Unit Apartments | 0 (0.0%) | 0 (0.0%) |
| 10 or more Apartments | 0 (0.0%) | 109 (100.0%) |
| Mobile Home / Other | 12 (40.0%) | 18 (60.0%) |
| Total | 3,561 (76.3%) | 1,104 (23.7%) |
Housing Structures by Number of Rooms in Valinda
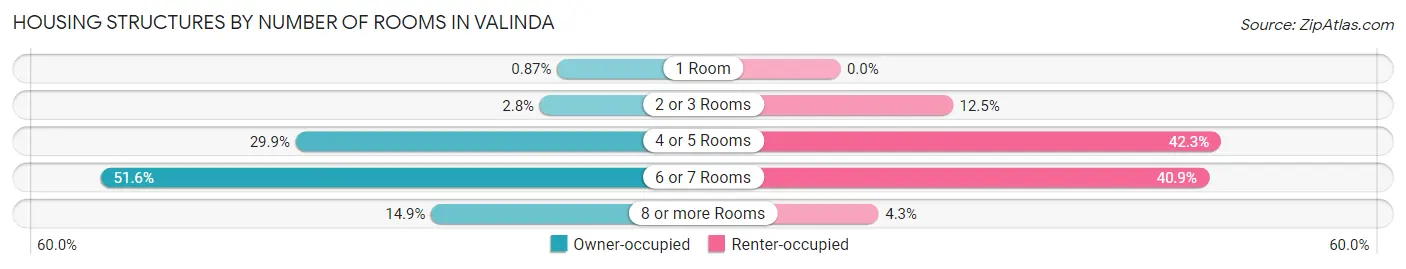
| Number of Rooms | Owner-occupied | Renter-occupied |
| 1 Room | 31 (0.9%) | 0 (0.0%) |
| 2 or 3 Rooms | 100 (2.8%) | 138 (12.5%) |
| 4 or 5 Rooms | 1,065 (29.9%) | 467 (42.3%) |
| 6 or 7 Rooms | 1,836 (51.6%) | 452 (40.9%) |
| 8 or more Rooms | 529 (14.9%) | 47 (4.3%) |
| Total | 3,561 (100.0%) | 1,104 (100.0%) |
Housing Structure by Heating Type in Valinda
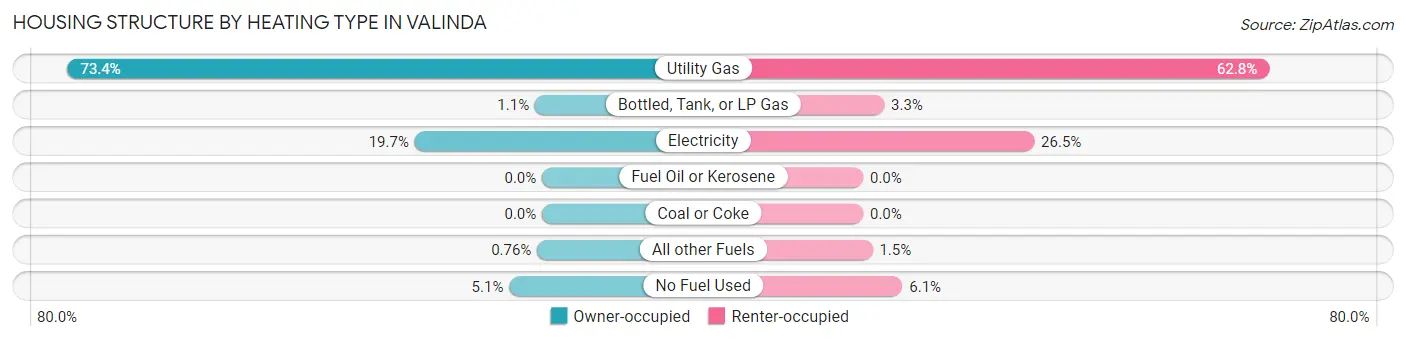
| Heating Type | Owner-occupied | Renter-occupied |
| Utility Gas | 2,613 (73.4%) | 693 (62.8%) |
| Bottled, Tank, or LP Gas | 39 (1.1%) | 36 (3.3%) |
| Electricity | 701 (19.7%) | 292 (26.5%) |
| Fuel Oil or Kerosene | 0 (0.0%) | 0 (0.0%) |
| Coal or Coke | 0 (0.0%) | 0 (0.0%) |
| All other Fuels | 27 (0.8%) | 16 (1.5%) |
| No Fuel Used | 181 (5.1%) | 67 (6.1%) |
| Total | 3,561 (100.0%) | 1,104 (100.0%) |
Household Vehicle Usage in Valinda
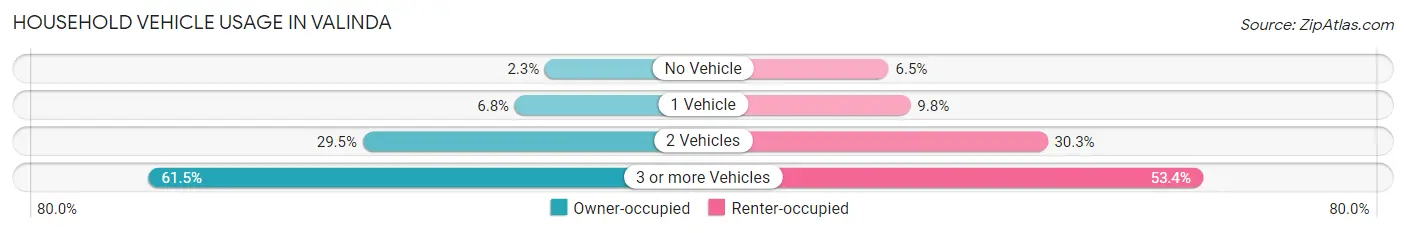
| Vehicles per Household | Owner-occupied | Renter-occupied |
| No Vehicle | 81 (2.3%) | 72 (6.5%) |
| 1 Vehicle | 241 (6.8%) | 108 (9.8%) |
| 2 Vehicles | 1,050 (29.5%) | 334 (30.2%) |
| 3 or more Vehicles | 2,189 (61.5%) | 590 (53.4%) |
| Total | 3,561 (100.0%) | 1,104 (100.0%) |
Real Estate & Mortgages in Valinda
Real Estate and Mortgage Overview in Valinda
| Characteristic | Without Mortgage | With Mortgage |
| Housing Units | 1,174 | 2,387 |
| Median Property Value | $528,000 | $607,500 |
| Median Household Income | $76,944 | $705 |
| Monthly Housing Costs | $571 | $541 |
| Real Estate Taxes | $3,155 | $30 |
Property Value by Mortgage Status in Valinda
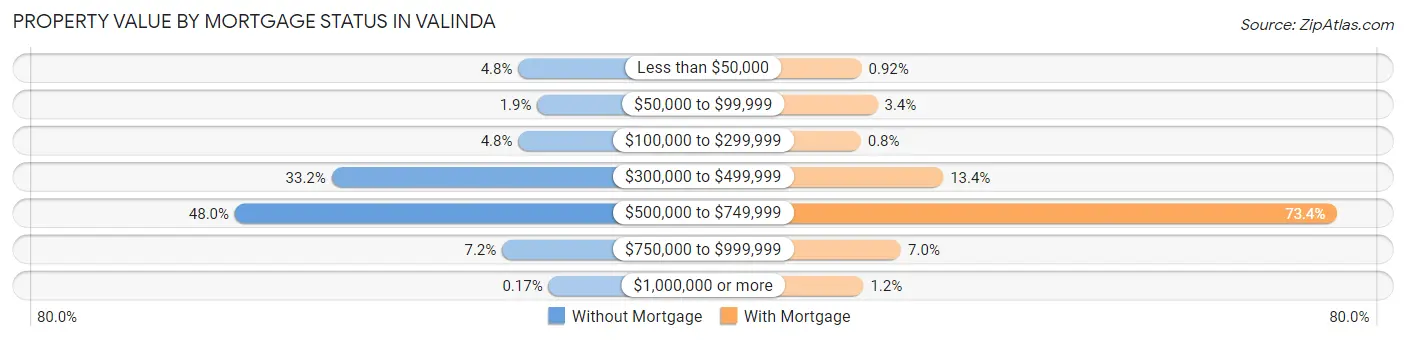
| Property Value | Without Mortgage | With Mortgage |
| Less than $50,000 | 56 (4.8%) | 22 (0.9%) |
| $50,000 to $99,999 | 22 (1.9%) | 80 (3.4%) |
| $100,000 to $299,999 | 56 (4.8%) | 19 (0.8%) |
| $300,000 to $499,999 | 390 (33.2%) | 319 (13.4%) |
| $500,000 to $749,999 | 563 (48.0%) | 1,752 (73.4%) |
| $750,000 to $999,999 | 85 (7.2%) | 166 (7.0%) |
| $1,000,000 or more | 2 (0.2%) | 29 (1.2%) |
| Total | 1,174 (100.0%) | 2,387 (100.0%) |
Household Income by Mortgage Status in Valinda
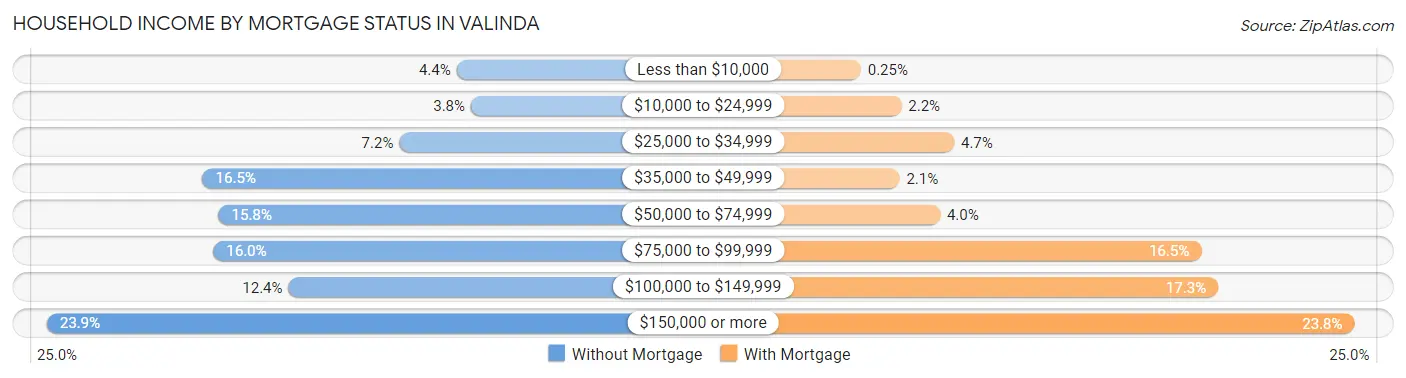
| Household Income | Without Mortgage | With Mortgage |
| Less than $10,000 | 52 (4.4%) | 6 (0.3%) |
| $10,000 to $24,999 | 44 (3.7%) | 52 (2.2%) |
| $25,000 to $34,999 | 84 (7.2%) | 112 (4.7%) |
| $35,000 to $49,999 | 194 (16.5%) | 50 (2.1%) |
| $50,000 to $74,999 | 185 (15.8%) | 96 (4.0%) |
| $75,000 to $99,999 | 188 (16.0%) | 393 (16.5%) |
| $100,000 to $149,999 | 146 (12.4%) | 412 (17.3%) |
| $150,000 or more | 281 (23.9%) | 567 (23.7%) |
| Total | 1,174 (100.0%) | 2,387 (100.0%) |
Property Value to Household Income Ratio in Valinda
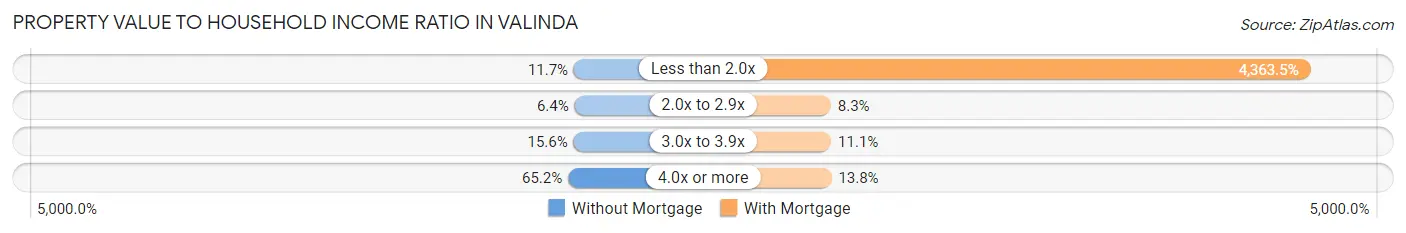
| Value-to-Income Ratio | Without Mortgage | With Mortgage |
| Less than 2.0x | 137 (11.7%) | 104,157 (4,363.5%) |
| 2.0x to 2.9x | 75 (6.4%) | 199 (8.3%) |
| 3.0x to 3.9x | 183 (15.6%) | 265 (11.1%) |
| 4.0x or more | 765 (65.2%) | 330 (13.8%) |
| Total | 1,174 (100.0%) | 2,387 (100.0%) |
Real Estate Taxes by Mortgage Status in Valinda
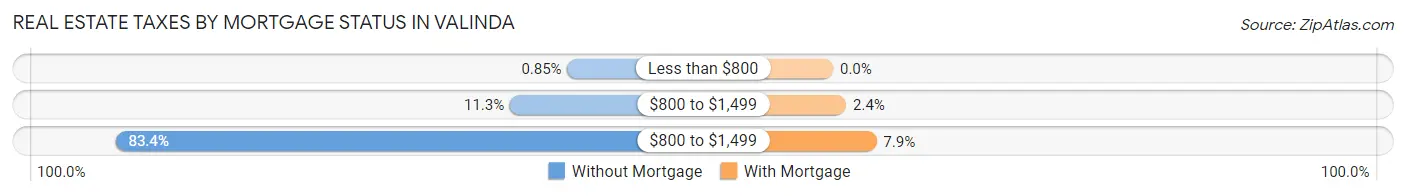
| Property Taxes | Without Mortgage | With Mortgage |
| Less than $800 | 10 (0.9%) | 0 (0.0%) |
| $800 to $1,499 | 133 (11.3%) | 57 (2.4%) |
| $800 to $1,499 | 979 (83.4%) | 189 (7.9%) |
| Total | 1,174 (100.0%) | 2,387 (100.0%) |
Health & Disability in Valinda
Health Insurance Coverage by Age in Valinda
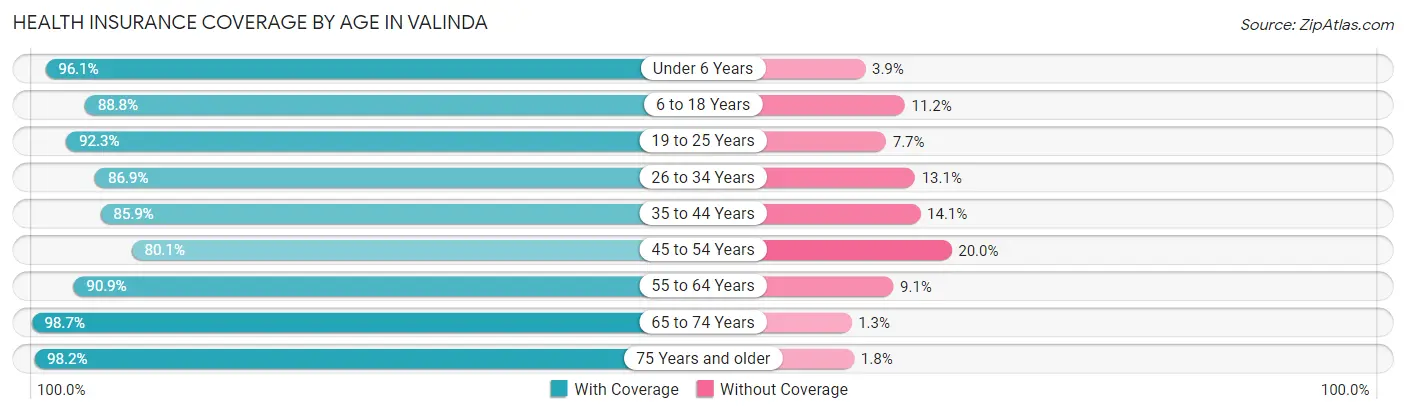
| Age Bracket | With Coverage | Without Coverage |
| Under 6 Years | 1,044 (96.1%) | 42 (3.9%) |
| 6 to 18 Years | 3,407 (88.8%) | 431 (11.2%) |
| 19 to 25 Years | 2,504 (92.3%) | 210 (7.7%) |
| 26 to 34 Years | 2,175 (86.9%) | 329 (13.1%) |
| 35 to 44 Years | 2,714 (85.9%) | 447 (14.1%) |
| 45 to 54 Years | 2,243 (80.0%) | 559 (20.0%) |
| 55 to 64 Years | 2,548 (90.9%) | 255 (9.1%) |
| 65 to 74 Years | 1,839 (98.7%) | 24 (1.3%) |
| 75 Years and older | 1,150 (98.2%) | 21 (1.8%) |
| Total | 19,624 (89.4%) | 2,318 (10.6%) |
Health Insurance Coverage by Citizenship Status in Valinda
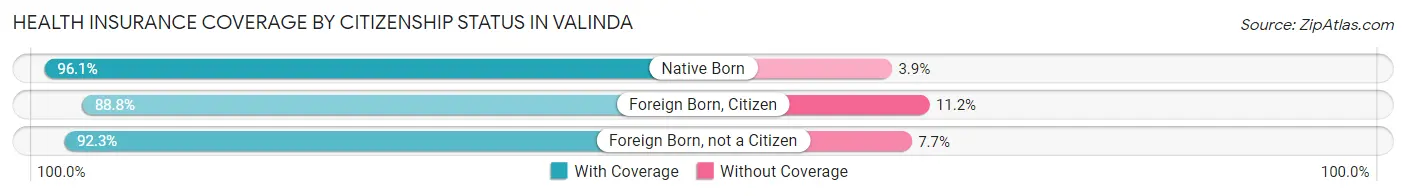
| Citizenship Status | With Coverage | Without Coverage |
| Native Born | 1,044 (96.1%) | 42 (3.9%) |
| Foreign Born, Citizen | 3,407 (88.8%) | 431 (11.2%) |
| Foreign Born, not a Citizen | 2,504 (92.3%) | 210 (7.7%) |
Health Insurance Coverage by Household Income in Valinda
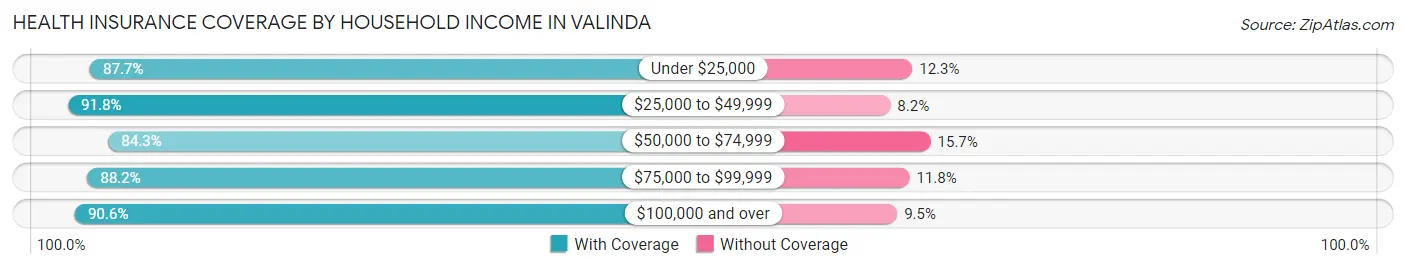
| Household Income | With Coverage | Without Coverage |
| Under $25,000 | 772 (87.7%) | 108 (12.3%) |
| $25,000 to $49,999 | 1,777 (91.8%) | 158 (8.2%) |
| $50,000 to $74,999 | 2,255 (84.3%) | 420 (15.7%) |
| $75,000 to $99,999 | 3,318 (88.2%) | 442 (11.8%) |
| $100,000 and over | 11,399 (90.5%) | 1,190 (9.5%) |
Public vs Private Health Insurance Coverage by Age in Valinda
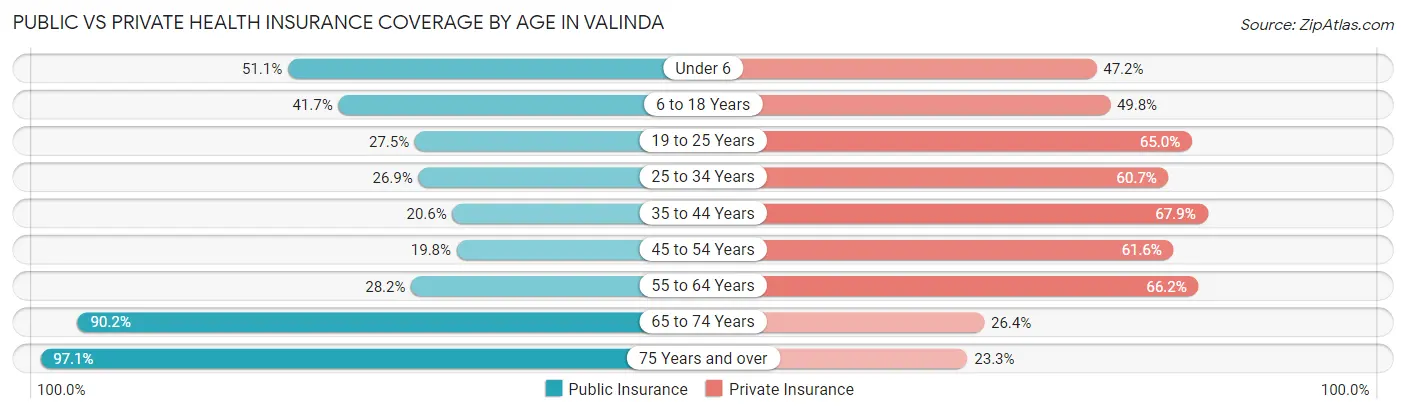
| Age Bracket | Public Insurance | Private Insurance |
| Under 6 | 555 (51.1%) | 513 (47.2%) |
| 6 to 18 Years | 1,602 (41.7%) | 1,910 (49.8%) |
| 19 to 25 Years | 747 (27.5%) | 1,764 (65.0%) |
| 25 to 34 Years | 673 (26.9%) | 1,519 (60.7%) |
| 35 to 44 Years | 650 (20.6%) | 2,146 (67.9%) |
| 45 to 54 Years | 554 (19.8%) | 1,726 (61.6%) |
| 55 to 64 Years | 791 (28.2%) | 1,856 (66.2%) |
| 65 to 74 Years | 1,680 (90.2%) | 492 (26.4%) |
| 75 Years and over | 1,137 (97.1%) | 273 (23.3%) |
| Total | 8,389 (38.2%) | 12,199 (55.6%) |
Disability Status by Sex by Age in Valinda
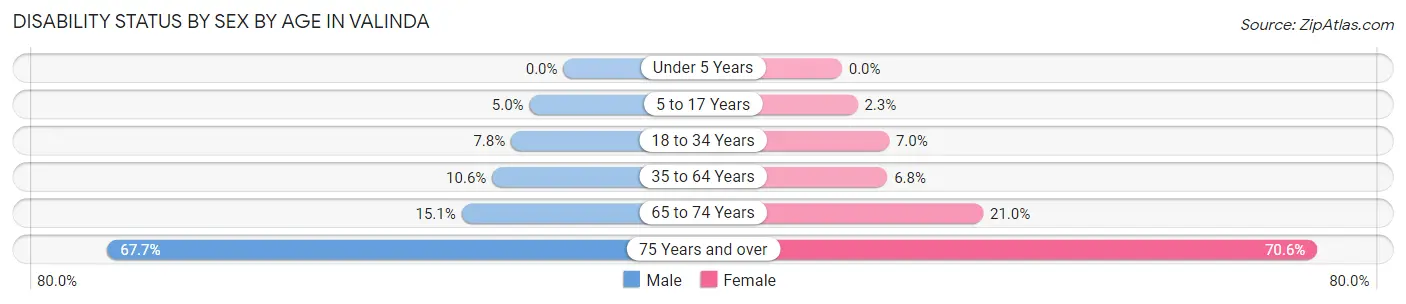
| Age Bracket | Male | Female |
| Under 5 Years | 0 (0.0%) | 0 (0.0%) |
| 5 to 17 Years | 101 (5.0%) | 36 (2.3%) |
| 18 to 34 Years | 235 (7.8%) | 190 (7.0%) |
| 35 to 64 Years | 502 (10.6%) | 271 (6.8%) |
| 65 to 74 Years | 121 (15.1%) | 223 (21.0%) |
| 75 Years and over | 344 (67.7%) | 468 (70.6%) |
Disability Class by Sex by Age in Valinda
Disability Class: Hearing Difficulty
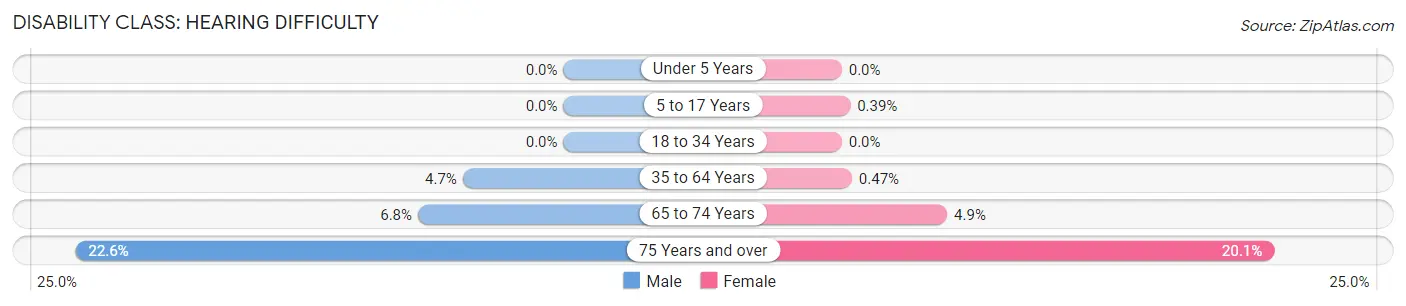
| Age Bracket | Male | Female |
| Under 5 Years | 0 (0.0%) | 0 (0.0%) |
| 5 to 17 Years | 0 (0.0%) | 6 (0.4%) |
| 18 to 34 Years | 0 (0.0%) | 0 (0.0%) |
| 35 to 64 Years | 222 (4.7%) | 19 (0.5%) |
| 65 to 74 Years | 54 (6.8%) | 52 (4.9%) |
| 75 Years and over | 115 (22.6%) | 133 (20.1%) |
Disability Class: Vision Difficulty
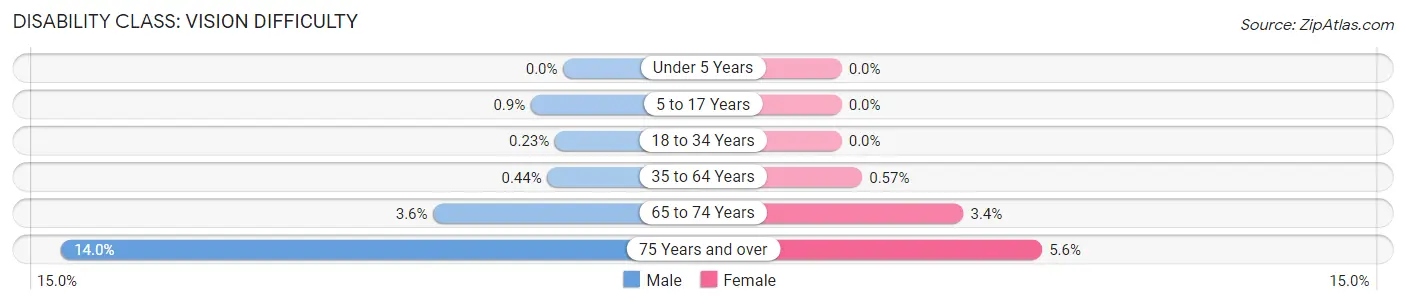
| Age Bracket | Male | Female |
| Under 5 Years | 0 (0.0%) | 0 (0.0%) |
| 5 to 17 Years | 18 (0.9%) | 0 (0.0%) |
| 18 to 34 Years | 7 (0.2%) | 0 (0.0%) |
| 35 to 64 Years | 21 (0.4%) | 23 (0.6%) |
| 65 to 74 Years | 29 (3.6%) | 36 (3.4%) |
| 75 Years and over | 71 (14.0%) | 37 (5.6%) |
Disability Class: Cognitive Difficulty
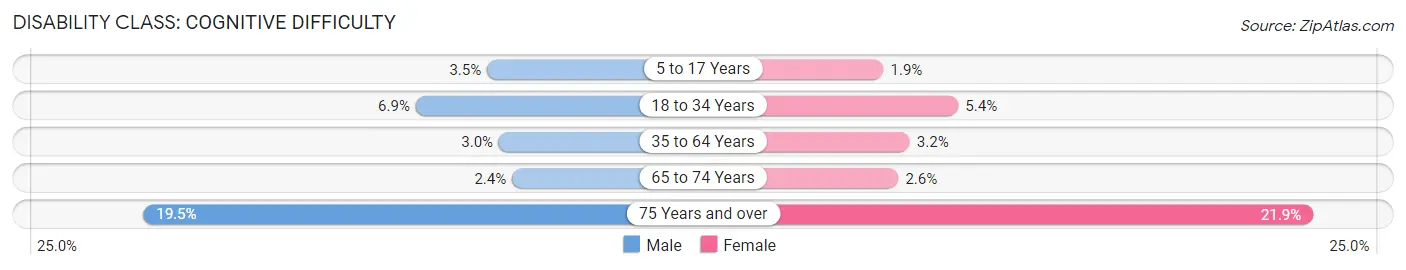
| Age Bracket | Male | Female |
| 5 to 17 Years | 71 (3.5%) | 30 (1.9%) |
| 18 to 34 Years | 207 (6.9%) | 147 (5.4%) |
| 35 to 64 Years | 142 (3.0%) | 127 (3.2%) |
| 65 to 74 Years | 19 (2.4%) | 28 (2.6%) |
| 75 Years and over | 99 (19.5%) | 145 (21.9%) |
Disability Class: Ambulatory Difficulty
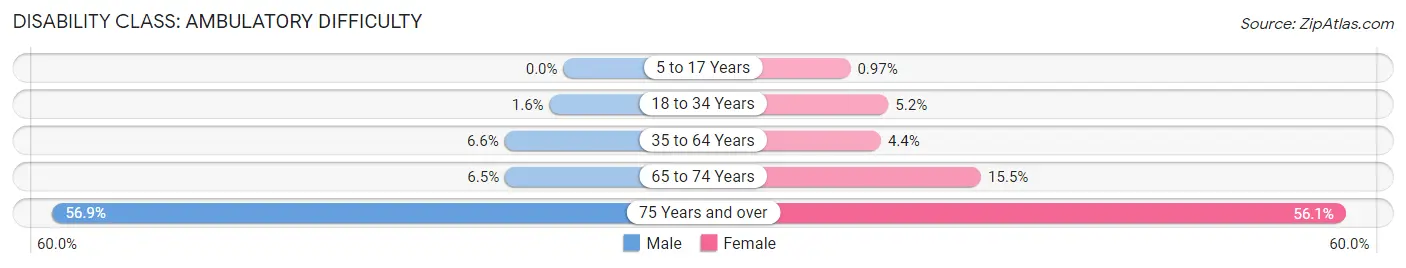
| Age Bracket | Male | Female |
| 5 to 17 Years | 0 (0.0%) | 15 (1.0%) |
| 18 to 34 Years | 47 (1.5%) | 141 (5.2%) |
| 35 to 64 Years | 311 (6.6%) | 175 (4.4%) |
| 65 to 74 Years | 52 (6.5%) | 165 (15.5%) |
| 75 Years and over | 289 (56.9%) | 372 (56.1%) |
Disability Class: Self-Care Difficulty
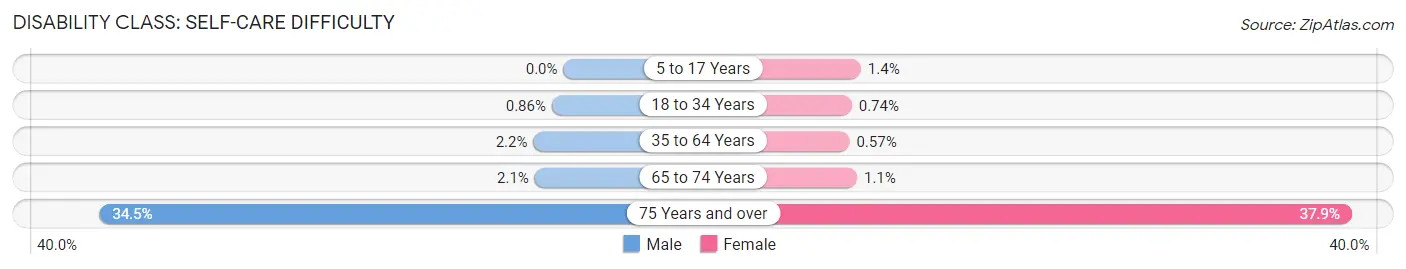
| Age Bracket | Male | Female |
| 5 to 17 Years | 0 (0.0%) | 22 (1.4%) |
| 18 to 34 Years | 26 (0.9%) | 20 (0.7%) |
| 35 to 64 Years | 106 (2.2%) | 23 (0.6%) |
| 65 to 74 Years | 17 (2.1%) | 12 (1.1%) |
| 75 Years and over | 175 (34.4%) | 251 (37.9%) |
Technology Access in Valinda
Computing Device Access in Valinda
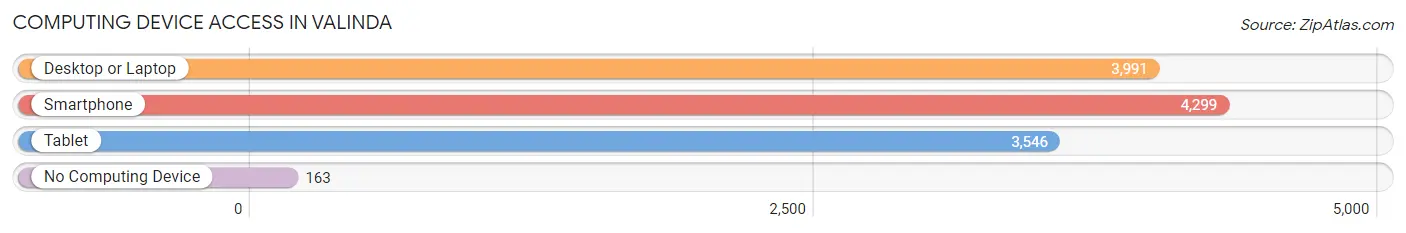
| Device Type | # Households | % Households |
| Desktop or Laptop | 3,991 | 85.6% |
| Smartphone | 4,299 | 92.1% |
| Tablet | 3,546 | 76.0% |
| No Computing Device | 163 | 3.5% |
| Total | 4,665 | 100.0% |
Internet Access in Valinda
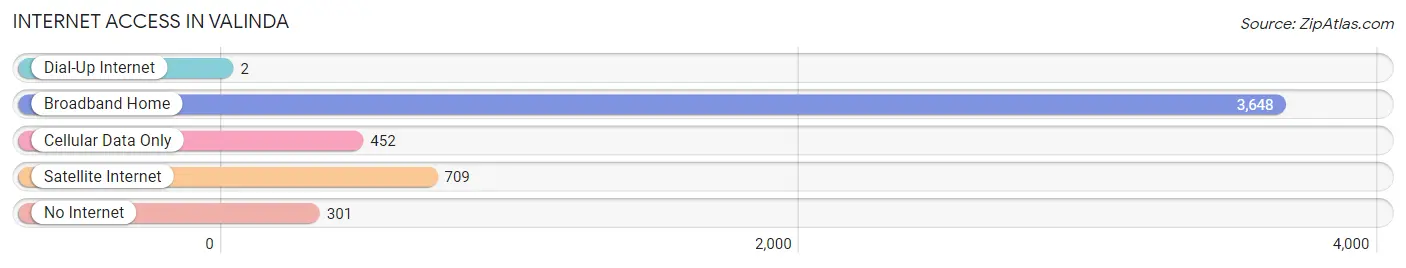
| Internet Type | # Households | % Households |
| Dial-Up Internet | 2 | 0.0% |
| Broadband Home | 3,648 | 78.2% |
| Cellular Data Only | 452 | 9.7% |
| Satellite Internet | 709 | 15.2% |
| No Internet | 301 | 6.5% |
| Total | 4,665 | 100.0% |
Valinda Summary
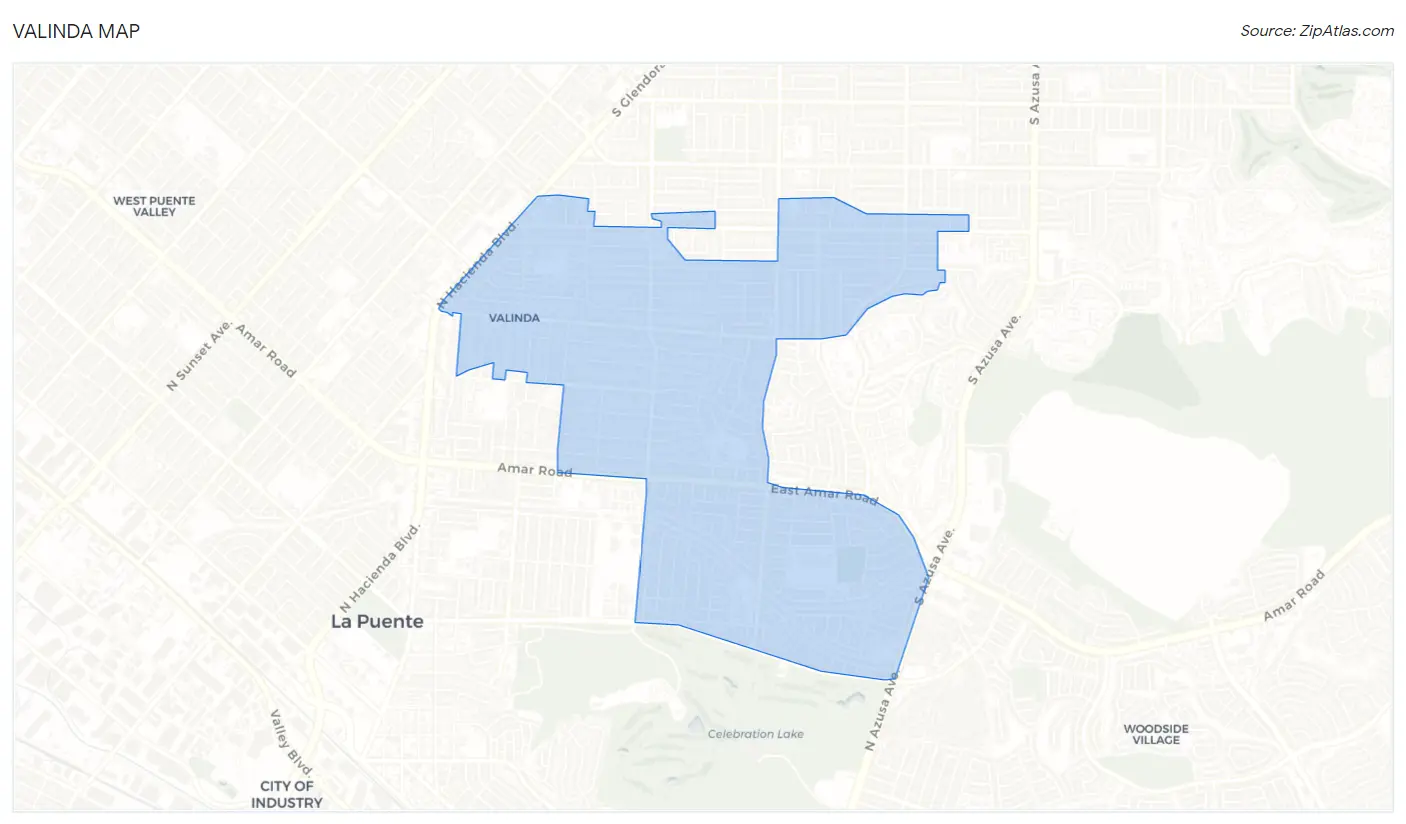
Valinda is a census-designated place located in Los Angeles County, California. It is located in the San Gabriel Valley, just south of the city of La Puente. Valinda is bordered by the cities of La Puente, West Covina, and Baldwin Park. The population of Valinda was estimated to be 24,837 in 2019.
Geography
Valinda is located at 34°2'7"N 117°57'45"W (34.035, -117.962). It is situated in the San Gabriel Valley, just south of the city of La Puente. Valinda is bordered by the cities of La Puente, West Covina, and Baldwin Park. The total area of Valinda is 2.7 square miles, with a population density of 9,093 people per square mile.
Economy
Valinda is home to a variety of businesses, including retail stores, restaurants, and professional services. The largest employers in Valinda are the Los Angeles County Department of Public Social Services, the Los Angeles County Department of Health Services, and the Los Angeles County Department of Mental Health. Other major employers include the Valinda School District, the Valinda Union School District, and the Valinda Community Services District.
Demographics
As of the 2019 census, the population of Valinda was estimated to be 24,837. The racial makeup of Valinda was 57.2% Hispanic or Latino, 24.3% White, 10.2% Asian, 8.2% African American, and 0.3% Native American. The median household income in Valinda was $50,945, and the median age was 33.
History
Valinda was originally part of the Rancho La Puente land grant, which was granted to John Rowland and William Workman in 1845. The area was later subdivided and sold to settlers in the late 19th century. The area was known as Valinda, which is derived from the Spanish words “valle” (valley) and “linda” (beautiful).
Valinda was officially incorporated as a census-designated place in 1980. Since then, the population of Valinda has grown steadily, and the area has become increasingly diverse. Valinda is now home to a variety of businesses, schools, and parks.
Common Questions
What is Per Capita Income in Valinda?
Per Capita income in Valinda is $28,522.
What is the Median Family Income in Valinda?
Median Family Income in Valinda is $95,099.
What is the Median Household income in Valinda?
Median Household Income in Valinda is $95,244.
What is Income or Wage Gap in Valinda?
Income or Wage Gap in Valinda is 19.6%.
Women in Valinda earn 80.4 cents for every dollar earned by a man.
What is Inequality or Gini Index in Valinda?
Inequality or Gini Index in Valinda is 0.42.
What is the Total Population of Valinda?
Total Population of Valinda is 21,952.
What is the Total Male Population of Valinda?
Total Male Population of Valinda is 11,500.
What is the Total Female Population of Valinda?
Total Female Population of Valinda is 10,452.
What is the Ratio of Males per 100 Females in Valinda?
There are 110.03 Males per 100 Females in Valinda.
What is the Ratio of Females per 100 Males in Valinda?
There are 90.89 Females per 100 Males in Valinda.
What is the Median Population Age in Valinda?
Median Population Age in Valinda is 37.9 Years.
What is the Average Family Size in Valinda
Average Family Size in Valinda is 4.8 People.
What is the Average Household Size in Valinda
Average Household Size in Valinda is 4.7 People.
How Large is the Labor Force in Valinda?
There are 11,874 People in the Labor Forcein in Valinda.
What is the Percentage of People in the Labor Force in Valinda?
65.3% of People are in the Labor Force in Valinda.
What is the Unemployment Rate in Valinda?
Unemployment Rate in Valinda is 6.0%.