Cities with the Highest Percentage of Guatemalan Population in North Carolina
RELATED REPORTS & OPTIONS
Guatemalan
North Carolina
Compare Cities
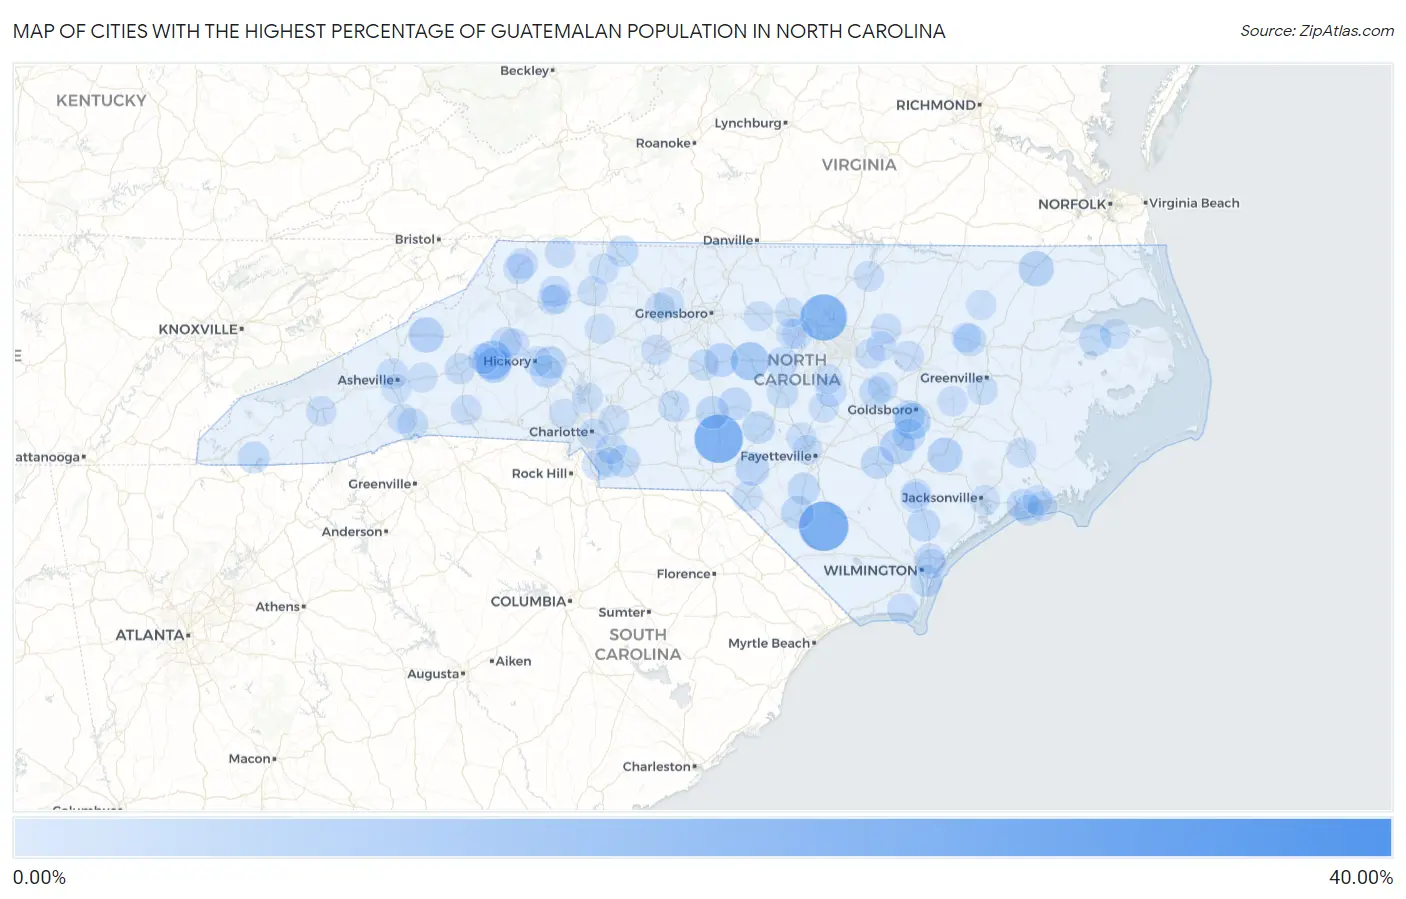
Map of Cities with the Highest Percentage of Guatemalan Population in North Carolina
0.00%
40.00%
Cities with the Highest Percentage of Guatemalan Population in North Carolina
| City | Guatemalan | vs State | vs National | |
| 1. | Dudley | 33.02% | 0.36%(+32.7)#1 | 0.50%(+32.5)#17 |
| 2. | Bladenboro | 20.16% | 0.36%(+19.8)#2 | 0.50%(+19.7)#39 |
| 3. | Norman | 19.08% | 0.36%(+18.7)#3 | 0.50%(+18.6)#46 |
| 4. | Gorman | 16.97% | 0.36%(+16.6)#4 | 0.50%(+16.5)#56 |
| 5. | Morganton | 9.13% | 0.36%(+8.77)#5 | 0.50%(+8.63)#150 |
| 6. | Siler City | 8.50% | 0.36%(+8.14)#6 | 0.50%(+8.00)#163 |
| 7. | Brogden | 6.45% | 0.36%(+6.09)#7 | 0.50%(+5.95)#237 |
| 8. | Salem | 5.81% | 0.36%(+5.45)#8 | 0.50%(+5.31)#279 |
| 9. | Burnsville | 5.59% | 0.36%(+5.22)#9 | 0.50%(+5.08)#288 |
| 10. | Winton | 5.49% | 0.36%(+5.13)#10 | 0.50%(+4.99)#292 |
| 11. | Faison | 5.37% | 0.36%(+5.01)#11 | 0.50%(+4.86)#297 |
| 12. | Pink Hill | 5.30% | 0.36%(+4.94)#12 | 0.50%(+4.80)#302 |
| 13. | Franklinville | 4.18% | 0.36%(+3.81)#13 | 0.50%(+3.67)#407 |
| 14. | Deercroft | 4.02% | 0.36%(+3.65)#14 | 0.50%(+3.51)#429 |
| 15. | Burgaw | 3.27% | 0.36%(+2.91)#15 | 0.50%(+2.77)#521 |
| 16. | Lumberton | 3.26% | 0.36%(+2.90)#16 | 0.50%(+2.76)#523 |
| 17. | Robbins | 3.24% | 0.36%(+2.88)#17 | 0.50%(+2.74)#525 |
| 18. | Clinton | 3.24% | 0.36%(+2.88)#18 | 0.50%(+2.74)#527 |
| 19. | Biscoe | 3.20% | 0.36%(+2.84)#19 | 0.50%(+2.69)#530 |
| 20. | Whispering Pines | 3.02% | 0.36%(+2.65)#20 | 0.50%(+2.51)#562 |
| 21. | Conover | 2.83% | 0.36%(+2.46)#21 | 0.50%(+2.32)#614 |
| 22. | Newton | 2.78% | 0.36%(+2.42)#22 | 0.50%(+2.27)#628 |
| 23. | Mount Olive | 2.71% | 0.36%(+2.34)#23 | 0.50%(+2.20)#643 |
| 24. | Monroe | 2.64% | 0.36%(+2.28)#24 | 0.50%(+2.14)#658 |
| 25. | Princeville | 2.64% | 0.36%(+2.27)#25 | 0.50%(+2.13)#659 |
| 26. | Creswell | 2.63% | 0.36%(+2.27)#26 | 0.50%(+2.13)#660 |
| 27. | St Pauls | 2.61% | 0.36%(+2.25)#27 | 0.50%(+2.11)#667 |
| 28. | Mar Mac | 2.45% | 0.36%(+2.09)#28 | 0.50%(+1.95)#716 |
| 29. | Hayesville | 2.23% | 0.36%(+1.86)#29 | 0.50%(+1.72)#782 |
| 30. | Cape Carteret | 2.19% | 0.36%(+1.82)#30 | 0.50%(+1.68)#792 |
| 31. | Sanford | 2.04% | 0.36%(+1.68)#31 | 0.50%(+1.54)#828 |
| 32. | Pittsboro | 2.00% | 0.36%(+1.63)#32 | 0.50%(+1.49)#846 |
| 33. | Flat Rock | 1.78% | 0.36%(+1.42)#33 | 0.50%(+1.28)#926 |
| 34. | Smithfield | 1.75% | 0.36%(+1.39)#34 | 0.50%(+1.25)#946 |
| 35. | Silver Lake | 1.72% | 0.36%(+1.36)#35 | 0.50%(+1.22)#958 |
| 36. | Badin | 1.69% | 0.36%(+1.32)#36 | 0.50%(+1.18)#973 |
| 37. | East Flat Rock | 1.53% | 0.36%(+1.17)#37 | 0.50%(+1.03)#1,055 |
| 38. | Asheboro | 1.52% | 0.36%(+1.16)#38 | 0.50%(+1.02)#1,059 |
| 39. | Spout Springs | 1.43% | 0.36%(+1.07)#39 | 0.50%(+0.931)#1,128 |
| 40. | Marvin | 1.43% | 0.36%(+1.07)#40 | 0.50%(+0.929)#1,129 |
| 41. | Angier | 1.40% | 0.36%(+1.04)#41 | 0.50%(+0.898)#1,148 |
| 42. | Woodfin | 1.32% | 0.36%(+0.953)#42 | 0.50%(+0.812)#1,206 |
| 43. | Marion | 1.25% | 0.36%(+0.891)#43 | 0.50%(+0.750)#1,250 |
| 44. | Gamewell | 1.24% | 0.36%(+0.877)#44 | 0.50%(+0.736)#1,265 |
| 45. | Emerald Isle | 1.19% | 0.36%(+0.825)#45 | 0.50%(+0.685)#1,315 |
| 46. | Jefferson | 1.18% | 0.36%(+0.812)#46 | 0.50%(+0.671)#1,330 |
| 47. | Chapel Hill | 1.09% | 0.36%(+0.723)#47 | 0.50%(+0.582)#1,416 |
| 48. | Mulberry | 1.01% | 0.36%(+0.647)#48 | 0.50%(+0.506)#1,498 |
| 49. | Sims | 0.99% | 0.36%(+0.622)#49 | 0.50%(+0.481)#1,518 |
| 50. | Northchase | 0.97% | 0.36%(+0.611)#50 | 0.50%(+0.470)#1,532 |
| 51. | Snow Hill | 0.91% | 0.36%(+0.545)#51 | 0.50%(+0.404)#1,609 |
| 52. | St James | 0.90% | 0.36%(+0.535)#52 | 0.50%(+0.394)#1,618 |
| 53. | Cajah S Mountain | 0.88% | 0.36%(+0.521)#53 | 0.50%(+0.380)#1,635 |
| 54. | Henderson | 0.86% | 0.36%(+0.497)#54 | 0.50%(+0.356)#1,674 |
| 55. | Glen Alpine | 0.84% | 0.36%(+0.481)#55 | 0.50%(+0.340)#1,698 |
| 56. | Bunn | 0.84% | 0.36%(+0.474)#56 | 0.50%(+0.333)#1,712 |
| 57. | Ruth | 0.81% | 0.36%(+0.442)#57 | 0.50%(+0.301)#1,758 |
| 58. | Charlotte | 0.75% | 0.36%(+0.383)#58 | 0.50%(+0.242)#1,840 |
| 59. | Winterville | 0.73% | 0.36%(+0.369)#59 | 0.50%(+0.229)#1,878 |
| 60. | West Jefferson | 0.73% | 0.36%(+0.366)#60 | 0.50%(+0.225)#1,887 |
| 61. | Sparta | 0.72% | 0.36%(+0.361)#61 | 0.50%(+0.220)#1,892 |
| 62. | Wallace | 0.70% | 0.36%(+0.334)#62 | 0.50%(+0.193)#1,940 |
| 63. | Lexington | 0.66% | 0.36%(+0.300)#63 | 0.50%(+0.159)#1,986 |
| 64. | Sylva | 0.65% | 0.36%(+0.290)#64 | 0.50%(+0.149)#2,012 |
| 65. | Stallings | 0.65% | 0.36%(+0.285)#65 | 0.50%(+0.144)#2,026 |
| 66. | Laurel Park | 0.61% | 0.36%(+0.249)#66 | 0.50%(+0.108)#2,106 |
| 67. | Dobson | 0.61% | 0.36%(+0.244)#67 | 0.50%(+0.103)#2,120 |
| 68. | Cricket | 0.60% | 0.36%(+0.239)#68 | 0.50%(+0.098)#2,126 |
| 69. | North Wilkesboro | 0.60% | 0.36%(+0.235)#69 | 0.50%(+0.094)#2,135 |
| 70. | Tarboro | 0.59% | 0.36%(+0.226)#70 | 0.50%(+0.085)#2,158 |
| 71. | Laurinburg | 0.58% | 0.36%(+0.218)#71 | 0.50%(+0.077)#2,174 |
| 72. | New Bern | 0.55% | 0.36%(+0.182)#72 | 0.50%(+0.041)#2,258 |
| 73. | Cornelius | 0.54% | 0.36%(+0.181)#73 | 0.50%(+0.041)#2,260 |
| 74. | Harrisburg | 0.54% | 0.36%(+0.181)#74 | 0.50%(+0.040)#2,262 |
| 75. | Walkertown | 0.54% | 0.36%(+0.180)#75 | 0.50%(+0.039)#2,266 |
| 76. | Carrboro | 0.54% | 0.36%(+0.178)#76 | 0.50%(+0.037)#2,272 |
| 77. | Scotland Neck | 0.54% | 0.36%(+0.174)#77 | 0.50%(+0.033)#2,281 |
| 78. | Columbia | 0.54% | 0.36%(+0.172)#78 | 0.50%(+0.032)#2,289 |
| 79. | Lillington | 0.53% | 0.36%(+0.162)#79 | 0.50%(+0.022)#2,312 |
| 80. | Wendell | 0.52% | 0.36%(+0.157)#80 | 0.50%(+0.016)#2,321 |
| 81. | Jonesville | 0.49% | 0.36%(+0.130)#81 | 0.50%(-0.011)#2,399 |
| 82. | Jacksonville | 0.49% | 0.36%(+0.122)#82 | 0.50%(-0.019)#2,422 |
| 83. | Fuquay Varina | 0.46% | 0.36%(+0.097)#83 | 0.50%(-0.044)#2,494 |
| 84. | Zebulon | 0.46% | 0.36%(+0.095)#84 | 0.50%(-0.046)#2,503 |
| 85. | Indian Beach | 0.44% | 0.36%(+0.081)#85 | 0.50%(-0.060)#2,543 |
| 86. | Spring Lake | 0.44% | 0.36%(+0.081)#86 | 0.50%(-0.060)#2,544 |
| 87. | Asheville | 0.43% | 0.36%(+0.069)#87 | 0.50%(-0.072)#2,580 |
| 88. | Graham | 0.43% | 0.36%(+0.069)#88 | 0.50%(-0.072)#2,583 |
| 89. | Winston Salem | 0.43% | 0.36%(+0.062)#89 | 0.50%(-0.079)#2,608 |
| 90. | Kings Grant | 0.42% | 0.36%(+0.057)#90 | 0.50%(-0.084)#2,621 |
| 91. | Stanley | 0.40% | 0.36%(+0.040)#91 | 0.50%(-0.101)#2,671 |
| 92. | Hickory | 0.40% | 0.36%(+0.036)#92 | 0.50%(-0.105)#2,691 |
| 93. | Broad Creek | 0.40% | 0.36%(+0.034)#93 | 0.50%(-0.107)#2,698 |
| 94. | Black Mountain | 0.39% | 0.36%(+0.028)#94 | 0.50%(-0.113)#2,721 |
| 95. | Selma | 0.39% | 0.36%(+0.024)#95 | 0.50%(-0.116)#2,735 |
| 96. | Wesley Chapel | 0.37% | 0.36%(+0.002)#96 | 0.50%(-0.139)#2,823 |
| 97. | Fayetteville | 0.36% | 0.36%(-0.005)#97 | 0.50%(-0.146)#2,849 |
| 98. | Hillsborough | 0.36% | 0.36%(-0.007)#98 | 0.50%(-0.147)#2,855 |
| 99. | Teachey | 0.35% | 0.36%(-0.015)#99 | 0.50%(-0.156)#2,906 |
| 100. | Harmony | 0.34% | 0.36%(-0.021)#100 | 0.50%(-0.162)#2,932 |
Common Questions
What are the Top 10 Cities with the Highest Percentage of Guatemalan Population in North Carolina?
Top 10 Cities with the Highest Percentage of Guatemalan Population in North Carolina are:
#1
20.16%
#2
19.08%
#3
16.97%
#4
9.13%
#5
8.50%
#6
6.45%
#7
5.81%
#8
5.59%
#9
5.49%
#10
5.37%
What city has the Highest Percentage of Guatemalan Population in North Carolina?
Bladenboro has the Highest Percentage of Guatemalan Population in North Carolina with 20.16%.
What is the Percentage of Guatemalan Population in the State of North Carolina?
Percentage of Guatemalan Population in North Carolina is 0.36%.
What is the Percentage of Guatemalan Population in the United States?
Percentage of Guatemalan Population in the United States is 0.50%.