Cities with the Highest Percentage of Guatemalan Population in Oregon
RELATED REPORTS & OPTIONS
Guatemalan
Oregon
Compare Cities
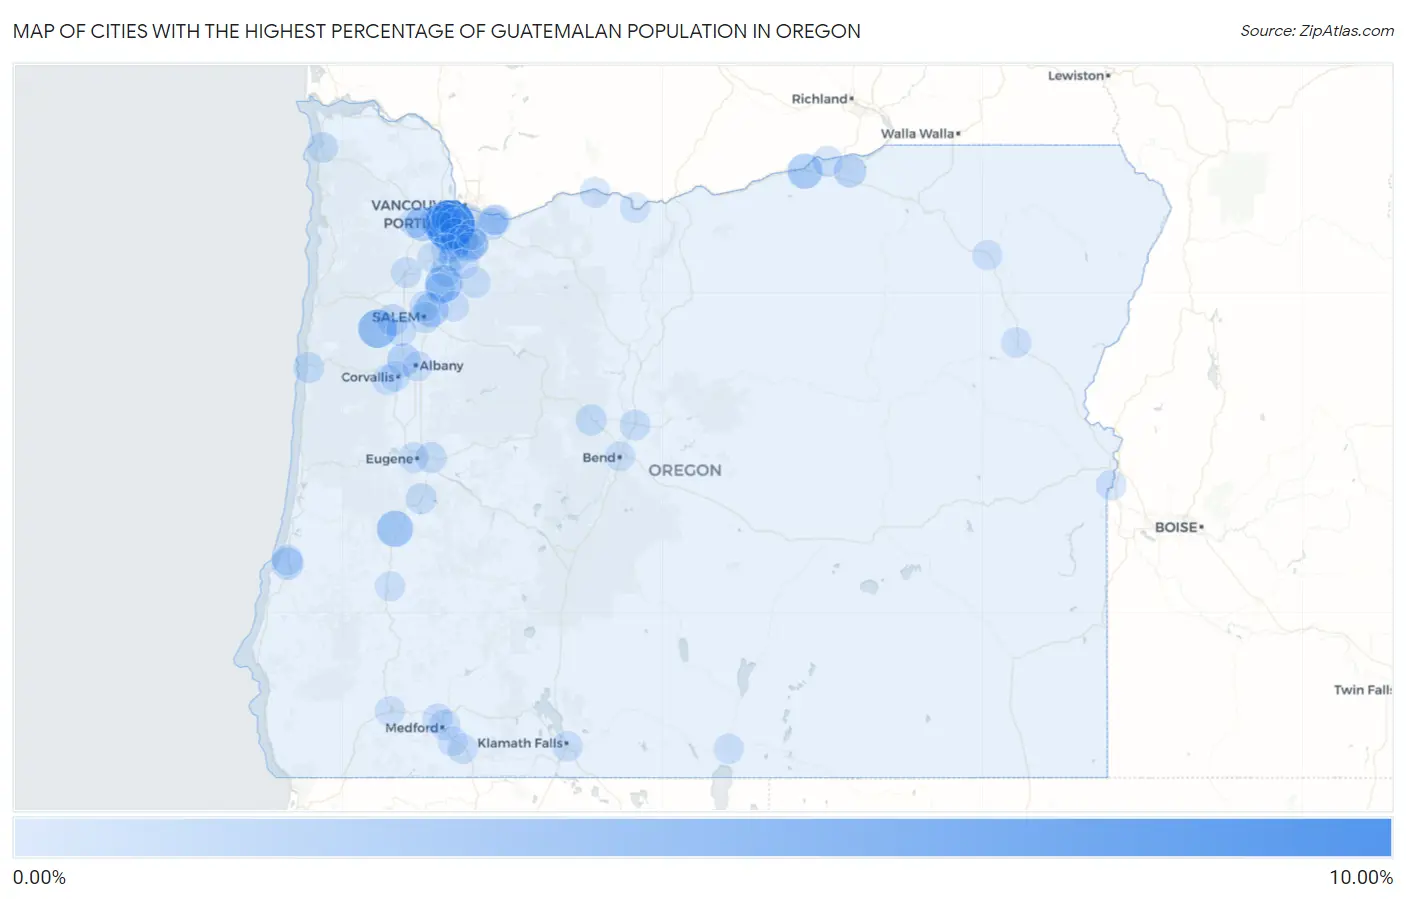
Map of Cities with the Highest Percentage of Guatemalan Population in Oregon
0.00%
10.00%
Cities with the Highest Percentage of Guatemalan Population in Oregon
| City | Guatemalan | vs State | vs National | |
| 1. | Cedar Hills | 9.23% | 0.30%(+8.93)#1 | 0.50%(+8.73)#147 |
| 2. | Elmira | 5.88% | 0.30%(+5.58)#2 | 0.50%(+5.38)#272 |
| 3. | Falls City | 3.86% | 0.30%(+3.56)#3 | 0.50%(+3.36)#443 |
| 4. | Woodburn | 3.14% | 0.30%(+2.84)#4 | 0.50%(+2.63)#538 |
| 5. | Yoncalla | 2.72% | 0.30%(+2.42)#5 | 0.50%(+2.21)#639 |
| 6. | Boardman | 2.27% | 0.30%(+1.97)#6 | 0.50%(+1.77)#765 |
| 7. | Cornelius | 2.05% | 0.30%(+1.75)#7 | 0.50%(+1.54)#826 |
| 8. | Hayesville | 1.90% | 0.30%(+1.60)#8 | 0.50%(+1.40)#883 |
| 9. | Jennings Lodge | 1.50% | 0.30%(+1.20)#9 | 0.50%(+0.997)#1,075 |
| 10. | Adair Village | 1.35% | 0.30%(+1.05)#10 | 0.50%(+0.846)#1,185 |
| 11. | Marlene | 1.15% | 0.30%(+0.856)#11 | 0.50%(+0.650)#1,346 |
| 12. | Hermiston | 1.10% | 0.30%(+0.802)#12 | 0.50%(+0.596)#1,400 |
| 13. | Coos Bay | 1.00% | 0.30%(+0.705)#13 | 0.50%(+0.499)#1,504 |
| 14. | Tualatin | 0.97% | 0.30%(+0.669)#14 | 0.50%(+0.463)#1,540 |
| 15. | Beaverton | 0.96% | 0.30%(+0.660)#15 | 0.50%(+0.454)#1,551 |
| 16. | Rockcreek | 0.78% | 0.30%(+0.477)#16 | 0.50%(+0.272)#1,787 |
| 17. | Dallas | 0.76% | 0.30%(+0.463)#17 | 0.50%(+0.257)#1,811 |
| 18. | Hillsboro | 0.70% | 0.30%(+0.406)#18 | 0.50%(+0.200)#1,929 |
| 19. | Bethany | 0.67% | 0.30%(+0.370)#19 | 0.50%(+0.164)#1,978 |
| 20. | Donald | 0.61% | 0.30%(+0.310)#20 | 0.50%(+0.104)#2,117 |
| 21. | Tigard | 0.57% | 0.30%(+0.276)#21 | 0.50%(+0.071)#2,190 |
| 22. | Sisters | 0.53% | 0.30%(+0.236)#22 | 0.50%(+0.031)#2,293 |
| 23. | Aloha | 0.51% | 0.30%(+0.215)#23 | 0.50%(+0.010)#2,342 |
| 24. | Salem | 0.51% | 0.30%(+0.207)#24 | 0.50%(+0.001)#2,366 |
| 25. | Newport | 0.43% | 0.30%(+0.128)#25 | 0.50%(-0.078)#2,604 |
| 26. | Cedar Mill | 0.41% | 0.30%(+0.109)#26 | 0.50%(-0.097)#2,658 |
| 27. | West Haven Sylvan | 0.41% | 0.30%(+0.107)#27 | 0.50%(-0.098)#2,663 |
| 28. | Gresham | 0.40% | 0.30%(+0.098)#28 | 0.50%(-0.108)#2,703 |
| 29. | Redmond | 0.38% | 0.30%(+0.082)#29 | 0.50%(-0.124)#2,761 |
| 30. | Irrigon | 0.37% | 0.30%(+0.076)#30 | 0.50%(-0.130)#2,780 |
| 31. | Molalla | 0.37% | 0.30%(+0.076)#31 | 0.50%(-0.130)#2,781 |
| 32. | Medford | 0.37% | 0.30%(+0.073)#32 | 0.50%(-0.132)#2,792 |
| 33. | Cottage Grove | 0.37% | 0.30%(+0.070)#33 | 0.50%(-0.136)#2,804 |
| 34. | Springfield | 0.36% | 0.30%(+0.066)#34 | 0.50%(-0.140)#2,825 |
| 35. | Eugene | 0.32% | 0.30%(+0.024)#35 | 0.50%(-0.182)#2,998 |
| 36. | Portland | 0.31% | 0.30%(+0.013)#36 | 0.50%(-0.192)#3,061 |
| 37. | Gervais | 0.31% | 0.30%(+0.009)#37 | 0.50%(-0.197)#3,081 |
| 38. | Forest Grove | 0.30% | 0.30%(+0.004)#38 | 0.50%(-0.202)#3,102 |
| 39. | Keizer | 0.30% | 0.30%(-0.002)#39 | 0.50%(-0.208)#3,132 |
| 40. | North Bend | 0.29% | 0.30%(-0.006)#40 | 0.50%(-0.211)#3,154 |
| 41. | Durham | 0.27% | 0.30%(-0.030)#41 | 0.50%(-0.235)#3,266 |
| 42. | Mcminnville | 0.26% | 0.30%(-0.043)#42 | 0.50%(-0.249)#3,332 |
| 43. | Seaside | 0.25% | 0.30%(-0.046)#43 | 0.50%(-0.252)#3,356 |
| 44. | Philomath | 0.24% | 0.30%(-0.059)#44 | 0.50%(-0.265)#3,435 |
| 45. | Corvallis | 0.23% | 0.30%(-0.064)#45 | 0.50%(-0.269)#3,462 |
| 46. | Metzger | 0.23% | 0.30%(-0.070)#46 | 0.50%(-0.275)#3,503 |
| 47. | Nyssa | 0.22% | 0.30%(-0.080)#47 | 0.50%(-0.285)#3,553 |
| 48. | Silverton | 0.19% | 0.30%(-0.107)#48 | 0.50%(-0.313)#3,720 |
| 49. | Klamath Falls | 0.19% | 0.30%(-0.110)#49 | 0.50%(-0.316)#3,744 |
| 50. | Troutdale | 0.17% | 0.30%(-0.125)#50 | 0.50%(-0.331)#3,835 |
| 51. | Hood River | 0.17% | 0.30%(-0.130)#51 | 0.50%(-0.335)#3,865 |
| 52. | Ashland | 0.17% | 0.30%(-0.130)#52 | 0.50%(-0.336)#3,870 |
| 53. | Oak Hills | 0.15% | 0.30%(-0.146)#53 | 0.50%(-0.351)#3,957 |
| 54. | Monmouth | 0.14% | 0.30%(-0.154)#54 | 0.50%(-0.359)#4,011 |
| 55. | Lake Oswego | 0.14% | 0.30%(-0.160)#55 | 0.50%(-0.366)#4,051 |
| 56. | Central Point | 0.12% | 0.30%(-0.183)#56 | 0.50%(-0.389)#4,230 |
| 57. | Gladstone | 0.10% | 0.30%(-0.198)#57 | 0.50%(-0.404)#4,353 |
| 58. | Albany | 0.092% | 0.30%(-0.206)#58 | 0.50%(-0.412)#4,413 |
| 59. | Talent | 0.080% | 0.30%(-0.219)#59 | 0.50%(-0.424)#4,518 |
| 60. | Sherwood | 0.079% | 0.30%(-0.220)#60 | 0.50%(-0.425)#4,528 |
| 61. | The Dalles | 0.075% | 0.30%(-0.223)#61 | 0.50%(-0.429)#4,574 |
| 62. | Wilsonville | 0.069% | 0.30%(-0.229)#62 | 0.50%(-0.435)#4,630 |
| 63. | Lakeview | 0.068% | 0.30%(-0.231)#63 | 0.50%(-0.436)#4,646 |
| 64. | Bend | 0.064% | 0.30%(-0.234)#64 | 0.50%(-0.440)#4,673 |
| 65. | West Linn | 0.059% | 0.30%(-0.240)#65 | 0.50%(-0.445)#4,715 |
| 66. | Grants Pass | 0.056% | 0.30%(-0.242)#66 | 0.50%(-0.448)#4,730 |
| 67. | Canby | 0.055% | 0.30%(-0.243)#67 | 0.50%(-0.449)#4,740 |
| 68. | Milwaukie | 0.052% | 0.30%(-0.247)#68 | 0.50%(-0.452)#4,757 |
| 69. | Baker City | 0.049% | 0.30%(-0.249)#69 | 0.50%(-0.455)#4,773 |
| 70. | La Grande | 0.031% | 0.30%(-0.268)#70 | 0.50%(-0.474)#4,915 |
| 71. | Roseburg | 0.030% | 0.30%(-0.269)#71 | 0.50%(-0.475)#4,921 |
| 72. | Wood Village | 0.022% | 0.30%(-0.276)#72 | 0.50%(-0.482)#4,992 |
| 73. | Newberg | 0.012% | 0.30%(-0.287)#73 | 0.50%(-0.492)#5,084 |
Common Questions
What are the Top 10 Cities with the Highest Percentage of Guatemalan Population in Oregon?
Top 10 Cities with the Highest Percentage of Guatemalan Population in Oregon are:
#1
9.23%
#2
3.86%
#3
3.14%
#4
2.72%
#5
2.27%
#6
2.05%
#7
1.90%
#8
1.50%
#9
1.35%
#10
1.10%
What city has the Highest Percentage of Guatemalan Population in Oregon?
Cedar Hills has the Highest Percentage of Guatemalan Population in Oregon with 9.23%.
What is the Percentage of Guatemalan Population in the State of Oregon?
Percentage of Guatemalan Population in Oregon is 0.30%.
What is the Percentage of Guatemalan Population in the United States?
Percentage of Guatemalan Population in the United States is 0.50%.