Cities with the Highest Percentage of Guatemalan Population in Illinois
RELATED REPORTS & OPTIONS
Guatemalan
Illinois
Compare Cities
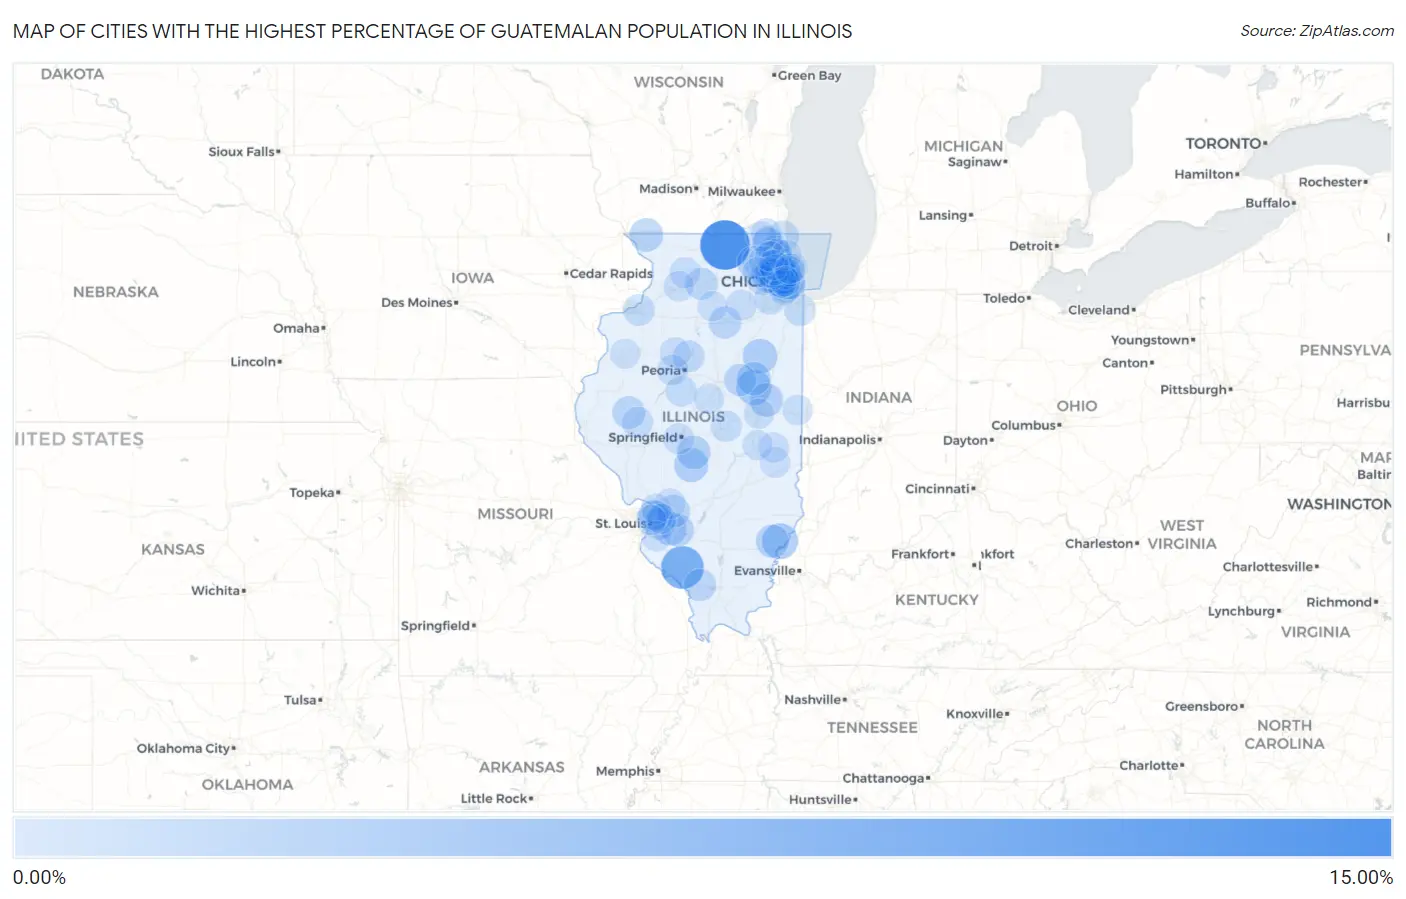
Map of Cities with the Highest Percentage of Guatemalan Population in Illinois
0.00%
15.00%
Cities with the Highest Percentage of Guatemalan Population in Illinois
| City | Guatemalan | vs State | vs National | |
| 1. | Timberlane | 11.59% | 0.34%(+11.3)#1 | 0.50%(+11.1)#104 |
| 2. | Percy | 7.53% | 0.34%(+7.19)#2 | 0.50%(+7.02)#187 |
| 3. | Bensenville | 5.00% | 0.34%(+4.66)#3 | 0.50%(+4.49)#330 |
| 4. | Wood Dale | 4.77% | 0.34%(+4.43)#4 | 0.50%(+4.26)#344 |
| 5. | Bellmont | 3.56% | 0.34%(+3.22)#5 | 0.50%(+3.05)#480 |
| 6. | Gibson City | 3.18% | 0.34%(+2.84)#6 | 0.50%(+2.68)#533 |
| 7. | Cullom | 2.83% | 0.34%(+2.49)#7 | 0.50%(+2.32)#611 |
| 8. | Melrose Park | 2.67% | 0.34%(+2.33)#8 | 0.50%(+2.16)#652 |
| 9. | Morrisonville | 2.57% | 0.34%(+2.23)#9 | 0.50%(+2.06)#679 |
| 10. | Rantoul | 2.34% | 0.34%(+2.00)#10 | 0.50%(+1.84)#745 |
| 11. | Scales Mound | 2.30% | 0.34%(+1.96)#11 | 0.50%(+1.80)#752 |
| 12. | Northlake | 2.29% | 0.34%(+1.95)#12 | 0.50%(+1.78)#759 |
| 13. | Kincaid | 2.27% | 0.34%(+1.93)#13 | 0.50%(+1.76)#766 |
| 14. | Sibley | 2.25% | 0.34%(+1.91)#14 | 0.50%(+1.75)#774 |
| 15. | Addison | 2.14% | 0.34%(+1.80)#15 | 0.50%(+1.63)#801 |
| 16. | Berkeley | 2.12% | 0.34%(+1.78)#16 | 0.50%(+1.62)#806 |
| 17. | Scott Afb | 2.11% | 0.34%(+1.77)#17 | 0.50%(+1.61)#810 |
| 18. | Albion | 2.06% | 0.34%(+1.72)#18 | 0.50%(+1.56)#824 |
| 19. | Gilberts | 2.03% | 0.34%(+1.69)#19 | 0.50%(+1.53)#835 |
| 20. | Franklin Park | 1.98% | 0.34%(+1.64)#20 | 0.50%(+1.47)#853 |
| 21. | Cicero | 1.95% | 0.34%(+1.61)#21 | 0.50%(+1.45)#866 |
| 22. | New Baden | 1.89% | 0.34%(+1.55)#22 | 0.50%(+1.38)#887 |
| 23. | Holcomb | 1.80% | 0.34%(+1.46)#23 | 0.50%(+1.29)#919 |
| 24. | River Grove | 1.79% | 0.34%(+1.45)#24 | 0.50%(+1.28)#924 |
| 25. | Rushville | 1.76% | 0.34%(+1.42)#25 | 0.50%(+1.26)#937 |
| 26. | Marine | 1.74% | 0.34%(+1.40)#26 | 0.50%(+1.24)#951 |
| 27. | Naplate | 1.68% | 0.34%(+1.34)#27 | 0.50%(+1.17)#978 |
| 28. | Colfax | 1.57% | 0.34%(+1.23)#28 | 0.50%(+1.07)#1,028 |
| 29. | Long Grove | 1.56% | 0.34%(+1.22)#29 | 0.50%(+1.05)#1,035 |
| 30. | Murphysboro | 1.53% | 0.34%(+1.20)#30 | 0.50%(+1.03)#1,053 |
| 31. | Prospect Heights | 1.46% | 0.34%(+1.12)#31 | 0.50%(+0.959)#1,108 |
| 32. | Franklin Grove | 1.45% | 0.34%(+1.11)#32 | 0.50%(+0.948)#1,118 |
| 33. | Rosemont | 1.40% | 0.34%(+1.06)#33 | 0.50%(+0.893)#1,152 |
| 34. | Villa Park | 1.36% | 0.34%(+1.02)#34 | 0.50%(+0.854)#1,179 |
| 35. | Caseyville | 1.34% | 0.34%(+0.996)#35 | 0.50%(+0.832)#1,195 |
| 36. | Elmwood Park | 1.32% | 0.34%(+0.978)#36 | 0.50%(+0.814)#1,203 |
| 37. | Rome | 1.25% | 0.34%(+0.906)#37 | 0.50%(+0.742)#1,257 |
| 38. | Silvis | 1.22% | 0.34%(+0.882)#38 | 0.50%(+0.718)#1,289 |
| 39. | Broadview | 1.14% | 0.34%(+0.804)#39 | 0.50%(+0.640)#1,357 |
| 40. | Harwood Heights | 1.14% | 0.34%(+0.801)#40 | 0.50%(+0.637)#1,363 |
| 41. | Sauk Village | 1.14% | 0.34%(+0.796)#41 | 0.50%(+0.632)#1,368 |
| 42. | Romeoville | 1.07% | 0.34%(+0.727)#42 | 0.50%(+0.562)#1,437 |
| 43. | Summit | 1.06% | 0.34%(+0.720)#43 | 0.50%(+0.556)#1,442 |
| 44. | Zion | 1.05% | 0.34%(+0.710)#44 | 0.50%(+0.546)#1,455 |
| 45. | Beardstown | 1.04% | 0.34%(+0.697)#45 | 0.50%(+0.533)#1,470 |
| 46. | Berwyn | 1.02% | 0.34%(+0.677)#46 | 0.50%(+0.513)#1,494 |
| 47. | Oreana | 0.93% | 0.34%(+0.590)#47 | 0.50%(+0.425)#1,582 |
| 48. | Green Valley | 0.91% | 0.34%(+0.567)#48 | 0.50%(+0.403)#1,611 |
| 49. | Schiller Park | 0.86% | 0.34%(+0.522)#49 | 0.50%(+0.358)#1,671 |
| 50. | Glendale Heights | 0.86% | 0.34%(+0.515)#50 | 0.50%(+0.351)#1,682 |
| 51. | Mundelein | 0.85% | 0.34%(+0.509)#51 | 0.50%(+0.344)#1,693 |
| 52. | Hanna City | 0.85% | 0.34%(+0.507)#52 | 0.50%(+0.343)#1,695 |
| 53. | Stone Park | 0.83% | 0.34%(+0.492)#53 | 0.50%(+0.328)#1,718 |
| 54. | Round Lake Heights | 0.82% | 0.34%(+0.479)#54 | 0.50%(+0.315)#1,737 |
| 55. | Leland Grove | 0.81% | 0.34%(+0.472)#55 | 0.50%(+0.308)#1,747 |
| 56. | Norridge | 0.81% | 0.34%(+0.471)#56 | 0.50%(+0.307)#1,749 |
| 57. | Madison | 0.75% | 0.34%(+0.407)#57 | 0.50%(+0.243)#1,834 |
| 58. | Millington | 0.72% | 0.34%(+0.381)#58 | 0.50%(+0.217)#1,899 |
| 59. | Polo | 0.71% | 0.34%(+0.374)#59 | 0.50%(+0.210)#1,909 |
| 60. | Carpentersville | 0.69% | 0.34%(+0.350)#60 | 0.50%(+0.186)#1,949 |
| 61. | Chicago | 0.68% | 0.34%(+0.343)#61 | 0.50%(+0.178)#1,958 |
| 62. | Carol Stream | 0.68% | 0.34%(+0.338)#62 | 0.50%(+0.174)#1,962 |
| 63. | West Chicago | 0.67% | 0.34%(+0.327)#63 | 0.50%(+0.163)#1,982 |
| 64. | Hamel | 0.63% | 0.34%(+0.293)#64 | 0.50%(+0.129)#2,057 |
| 65. | Pontoon Beach | 0.63% | 0.34%(+0.289)#65 | 0.50%(+0.125)#2,064 |
| 66. | Channel Lake | 0.62% | 0.34%(+0.277)#66 | 0.50%(+0.112)#2,096 |
| 67. | Hanover Park | 0.62% | 0.34%(+0.275)#67 | 0.50%(+0.111)#2,100 |
| 68. | Princeville | 0.61% | 0.34%(+0.273)#68 | 0.50%(+0.109)#2,103 |
| 69. | Westfield | 0.60% | 0.34%(+0.257)#69 | 0.50%(+0.092)#2,140 |
| 70. | Long Lake | 0.58% | 0.34%(+0.239)#70 | 0.50%(+0.074)#2,180 |
| 71. | Evanston | 0.56% | 0.34%(+0.220)#71 | 0.50%(+0.056)#2,226 |
| 72. | Itasca | 0.55% | 0.34%(+0.211)#72 | 0.50%(+0.046)#2,243 |
| 73. | Danville | 0.54% | 0.34%(+0.203)#73 | 0.50%(+0.039)#2,268 |
| 74. | Oakland | 0.54% | 0.34%(+0.200)#74 | 0.50%(+0.036)#2,276 |
| 75. | Champaign | 0.52% | 0.34%(+0.178)#75 | 0.50%(+0.014)#2,328 |
| 76. | Mclean | 0.51% | 0.34%(+0.175)#76 | 0.50%(+0.011)#2,337 |
| 77. | Arcola | 0.51% | 0.34%(+0.174)#77 | 0.50%(+0.009)#2,343 |
| 78. | Sterling | 0.51% | 0.34%(+0.172)#78 | 0.50%(+0.008)#2,346 |
| 79. | Des Plaines | 0.50% | 0.34%(+0.161)#79 | 0.50%(-0.003)#2,381 |
| 80. | Granite City | 0.49% | 0.34%(+0.152)#80 | 0.50%(-0.012)#2,402 |
| 81. | Monmouth | 0.49% | 0.34%(+0.151)#81 | 0.50%(-0.013)#2,404 |
| 82. | Highwood | 0.48% | 0.34%(+0.138)#82 | 0.50%(-0.026)#2,446 |
| 83. | Roselle | 0.47% | 0.34%(+0.128)#83 | 0.50%(-0.036)#2,468 |
| 84. | Vernon Hills | 0.46% | 0.34%(+0.120)#84 | 0.50%(-0.044)#2,495 |
| 85. | Spring Grove | 0.46% | 0.34%(+0.117)#85 | 0.50%(-0.047)#2,508 |
| 86. | Justice | 0.46% | 0.34%(+0.115)#86 | 0.50%(-0.049)#2,513 |
| 87. | Elk Grove Village | 0.44% | 0.34%(+0.100)#87 | 0.50%(-0.064)#2,555 |
| 88. | Lincolnwood | 0.44% | 0.34%(+0.097)#88 | 0.50%(-0.067)#2,566 |
| 89. | Barrington Hills | 0.44% | 0.34%(+0.097)#89 | 0.50%(-0.067)#2,568 |
| 90. | Hartford | 0.43% | 0.34%(+0.091)#90 | 0.50%(-0.074)#2,591 |
| 91. | Millstadt | 0.42% | 0.34%(+0.081)#91 | 0.50%(-0.083)#2,620 |
| 92. | Rolling Meadows | 0.42% | 0.34%(+0.080)#92 | 0.50%(-0.084)#2,622 |
| 93. | Westchester | 0.42% | 0.34%(+0.079)#93 | 0.50%(-0.085)#2,624 |
| 94. | South Elgin | 0.41% | 0.34%(+0.071)#94 | 0.50%(-0.093)#2,648 |
| 95. | Lake Zurich | 0.41% | 0.34%(+0.070)#95 | 0.50%(-0.094)#2,651 |
| 96. | Forest Park | 0.41% | 0.34%(+0.070)#96 | 0.50%(-0.095)#2,653 |
| 97. | Skokie | 0.40% | 0.34%(+0.063)#97 | 0.50%(-0.102)#2,678 |
| 98. | Mendota | 0.40% | 0.34%(+0.062)#98 | 0.50%(-0.102)#2,680 |
| 99. | Collinsville | 0.40% | 0.34%(+0.059)#99 | 0.50%(-0.105)#2,690 |
| 100. | Venice | 0.40% | 0.34%(+0.057)#100 | 0.50%(-0.107)#2,699 |
Common Questions
What are the Top 10 Cities with the Highest Percentage of Guatemalan Population in Illinois?
Top 10 Cities with the Highest Percentage of Guatemalan Population in Illinois are:
#1
11.59%
#2
7.53%
#3
5.00%
#4
4.77%
#5
3.56%
#6
3.18%
#7
2.83%
#8
2.67%
#9
2.57%
#10
2.34%
What city has the Highest Percentage of Guatemalan Population in Illinois?
Timberlane has the Highest Percentage of Guatemalan Population in Illinois with 11.59%.
What is the Percentage of Guatemalan Population in the State of Illinois?
Percentage of Guatemalan Population in Illinois is 0.34%.
What is the Percentage of Guatemalan Population in the United States?
Percentage of Guatemalan Population in the United States is 0.50%.