Azusa, CA Map & Demographics
Azusa Map
Azusa Overview
$30,180
PER CAPITA INCOME
$84,556
AVG FAMILY INCOME
$81,516
AVG HOUSEHOLD INCOME
22.0%
WAGE / INCOME GAP [ % ]
78.0¢/ $1
WAGE / INCOME GAP [ $ ]
$11,582
FAMILY INCOME DEFICIT
0.40
INEQUALITY / GINI INDEX
49,704
TOTAL POPULATION
24,845
MALE POPULATION
24,859
FEMALE POPULATION
99.94
MALES / 100 FEMALES
100.06
FEMALES / 100 MALES
32.8
MEDIAN AGE
3.7
AVG FAMILY SIZE
3.2
AVG HOUSEHOLD SIZE
26,618
LABOR FORCE [ PEOPLE ]
66.1%
PERCENT IN LABOR FORCE
6.1%
UNEMPLOYMENT RATE
Azusa Zip Codes
Azusa Area Codes
Income in Azusa
Income Overview in Azusa
Per Capita Income in Azusa is $30,180, while median incomes of families and households are $84,556 and $81,516 respectively.
| Characteristic | Number | Measure |
| Per Capita Income | 49,704 | $30,180 |
| Median Family Income | 10,175 | $84,556 |
| Mean Family Income | 10,175 | $103,530 |
| Median Household Income | 14,102 | $81,516 |
| Mean Household Income | 14,102 | $100,912 |
| Income Deficit | 10,175 | $11,582 |
| Wage / Income Gap (%) | 49,704 | 22.01% |
| Wage / Income Gap ($) | 49,704 | 77.99¢ per $1 |
| Gini / Inequality Index | 49,704 | 0.40 |
Earnings by Sex in Azusa
Average Earnings in Azusa are $33,211, $36,534 for men and $28,493 for women, a difference of 22.0%.
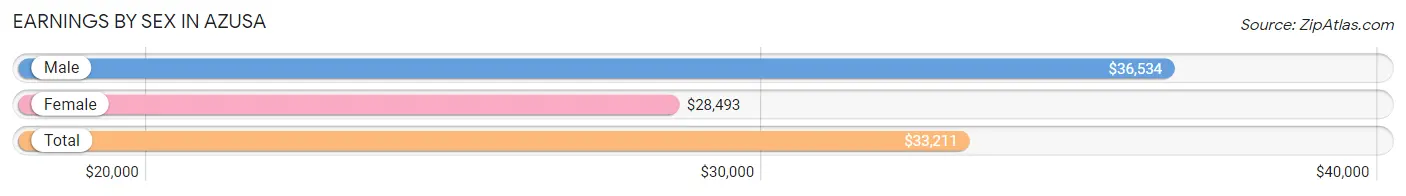
| Sex | Number | Average Earnings |
| Male | 15,296 (54.1%) | $36,534 |
| Female | 12,982 (45.9%) | $28,493 |
| Total | 28,278 (100.0%) | $33,211 |
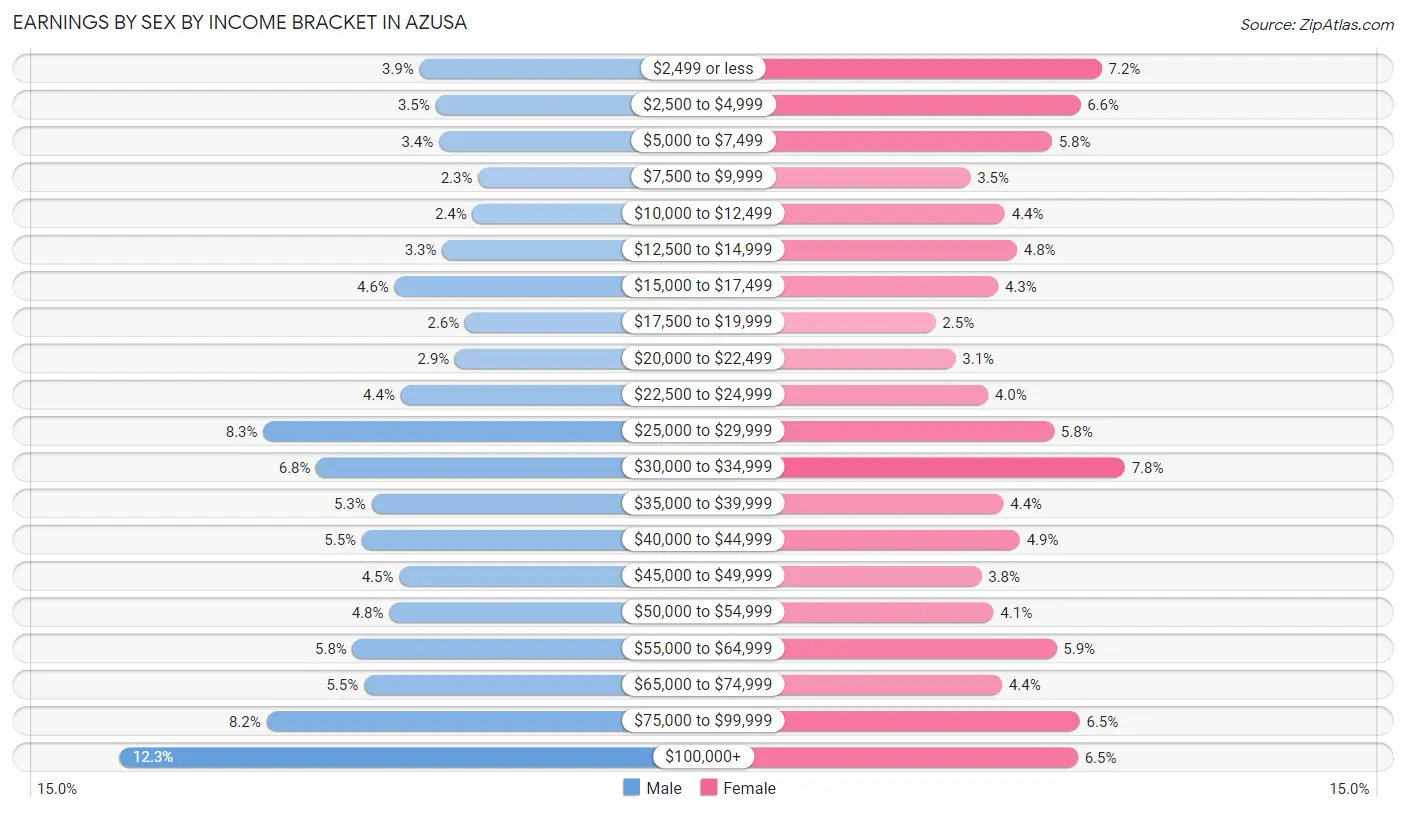
Earnings by Sex by Income Bracket in Azusa
The most common earnings brackets in Azusa are $100,000+ for men (1,884 | 12.3%) and $30,000 to $34,999 for women (1,014 | 7.8%).
| Income | Male | Female |
| $2,499 or less | 597 (3.9%) | 929 (7.2%) |
| $2,500 to $4,999 | 527 (3.5%) | 851 (6.6%) |
| $5,000 to $7,499 | 512 (3.4%) | 748 (5.8%) |
| $7,500 to $9,999 | 344 (2.2%) | 450 (3.5%) |
| $10,000 to $12,499 | 369 (2.4%) | 576 (4.4%) |
| $12,500 to $14,999 | 499 (3.3%) | 621 (4.8%) |
| $15,000 to $17,499 | 703 (4.6%) | 552 (4.3%) |
| $17,500 to $19,999 | 401 (2.6%) | 323 (2.5%) |
| $20,000 to $22,499 | 444 (2.9%) | 396 (3.0%) |
| $22,500 to $24,999 | 677 (4.4%) | 516 (4.0%) |
| $25,000 to $29,999 | 1,268 (8.3%) | 755 (5.8%) |
| $30,000 to $34,999 | 1,040 (6.8%) | 1,014 (7.8%) |
| $35,000 to $39,999 | 803 (5.2%) | 571 (4.4%) |
| $40,000 to $44,999 | 844 (5.5%) | 631 (4.9%) |
| $45,000 to $49,999 | 683 (4.5%) | 491 (3.8%) |
| $50,000 to $54,999 | 727 (4.8%) | 535 (4.1%) |
| $55,000 to $64,999 | 884 (5.8%) | 765 (5.9%) |
| $65,000 to $74,999 | 835 (5.5%) | 566 (4.4%) |
| $75,000 to $99,999 | 1,255 (8.2%) | 849 (6.5%) |
| $100,000+ | 1,884 (12.3%) | 843 (6.5%) |
| Total | 15,296 (100.0%) | 12,982 (100.0%) |
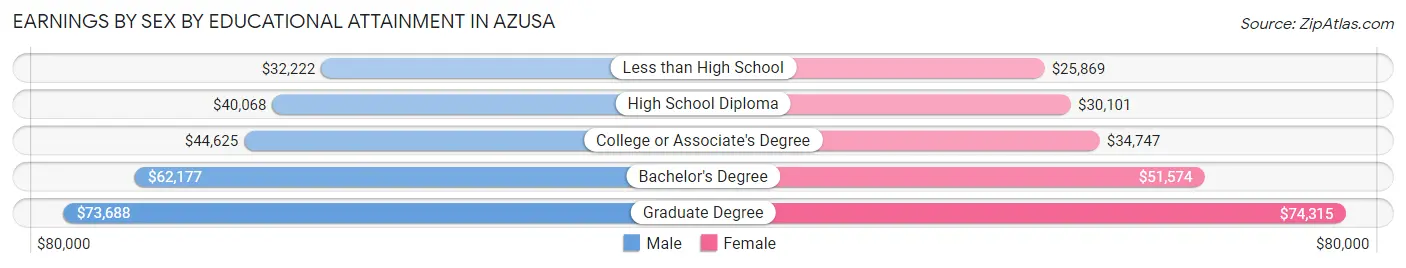
Earnings by Sex by Educational Attainment in Azusa
Average earnings in Azusa are $43,100 for men and $36,190 for women, a difference of 16.0%. Men with an educational attainment of graduate degree enjoy the highest average annual earnings of $73,688, while those with less than high school education earn the least with $32,222. Women with an educational attainment of graduate degree earn the most with the average annual earnings of $74,315, while those with less than high school education have the smallest earnings of $25,869.
| Educational Attainment | Male Income | Female Income |
| Less than High School | $32,222 | $25,869 |
| High School Diploma | $40,068 | $30,101 |
| College or Associate's Degree | $44,625 | $34,747 |
| Bachelor's Degree | $62,177 | $51,574 |
| Graduate Degree | $73,688 | $74,315 |
| Total | $43,100 | $36,190 |
Family Income in Azusa
Family Income Brackets in Azusa
According to the Azusa family income data, there are 2,015 families falling into the $50,000 to $74,999 income range, which is the most common income bracket and makes up 19.8% of all families. Conversely, the $10,000 to $14,999 income bracket is the least frequent group with only 234 families (2.3%) belonging to this category.
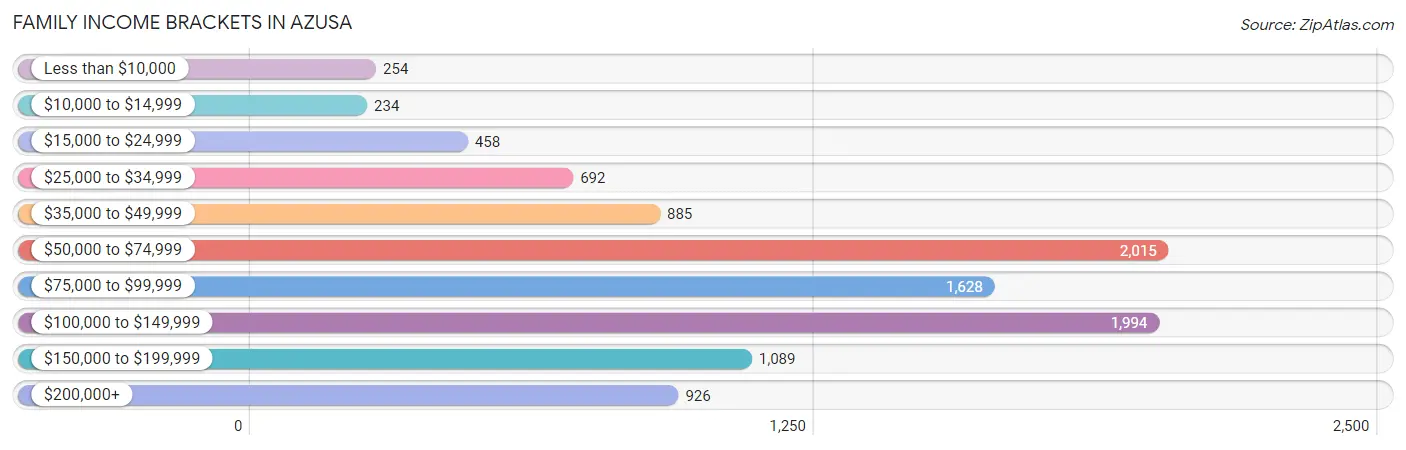
| Income Bracket | # Families | % Families |
| Less than $10,000 | 254 | 2.5% |
| $10,000 to $14,999 | 234 | 2.3% |
| $15,000 to $24,999 | 458 | 4.5% |
| $25,000 to $34,999 | 692 | 6.8% |
| $35,000 to $49,999 | 885 | 8.7% |
| $50,000 to $74,999 | 2,015 | 19.8% |
| $75,000 to $99,999 | 1,628 | 16.0% |
| $100,000 to $149,999 | 1,994 | 19.6% |
| $150,000 to $199,999 | 1,089 | 10.7% |
| $200,000+ | 926 | 9.1% |
Family Income by Famaliy Size in Azusa
7+ person families (402 | 4.0%) account for the highest median family income in Azusa with $178,750 per family, while 2-person families (3,554 | 34.9%) have the highest median income of $41,728 per family member.
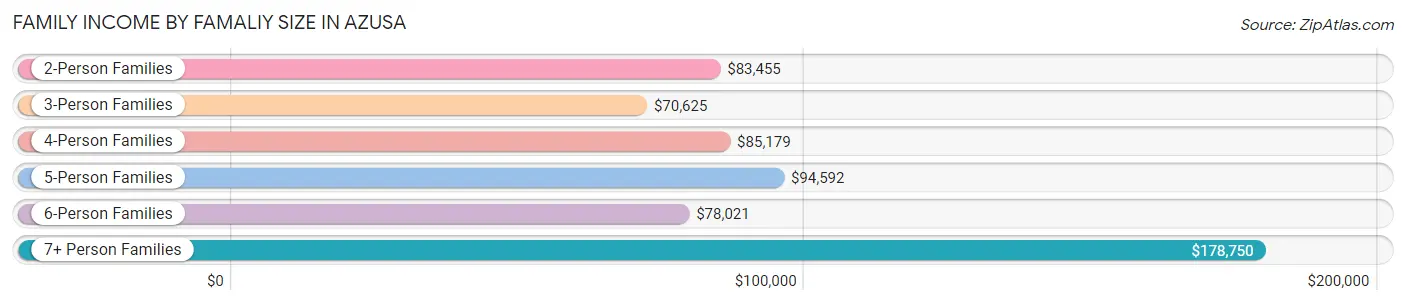
| Income Bracket | # Families | Median Income |
| 2-Person Families | 3,554 (34.9%) | $83,455 |
| 3-Person Families | 2,274 (22.4%) | $70,625 |
| 4-Person Families | 2,229 (21.9%) | $85,179 |
| 5-Person Families | 1,158 (11.4%) | $94,592 |
| 6-Person Families | 558 (5.5%) | $78,021 |
| 7+ Person Families | 402 (4.0%) | $178,750 |
| Total | 10,175 (100.0%) | $84,556 |
Family Income by Number of Earners in Azusa
The median family income in Azusa is $84,556, with families comprising 3+ earners (2,072) having the highest median family income of $118,603, while families with no earners (943) have the lowest median family income of $31,493, accounting for 20.4% and 9.3% of families, respectively.
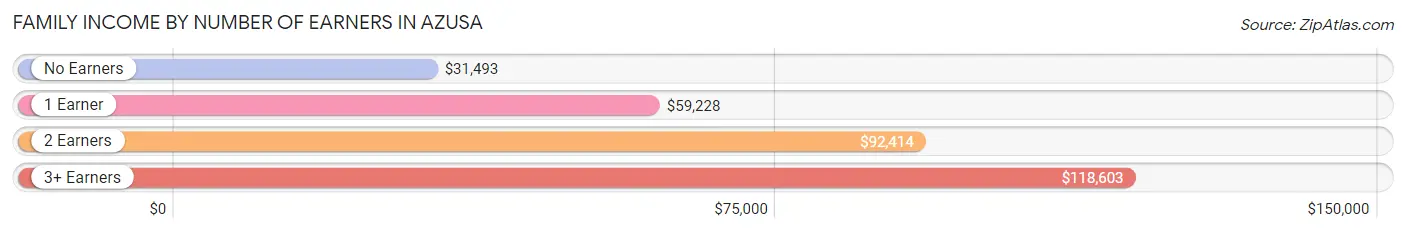
| Number of Earners | # Families | Median Income |
| No Earners | 943 (9.3%) | $31,493 |
| 1 Earner | 3,054 (30.0%) | $59,228 |
| 2 Earners | 4,106 (40.4%) | $92,414 |
| 3+ Earners | 2,072 (20.4%) | $118,603 |
| Total | 10,175 (100.0%) | $84,556 |
Household Income in Azusa
Household Income Brackets in Azusa
With 2,863 households falling in the category, the $100,000 to $149,999 income range is the most frequent in Azusa, accounting for 20.3% of all households. In contrast, only 381 households (2.7%) fall into the less than $10,000 income bracket, making it the least populous group.
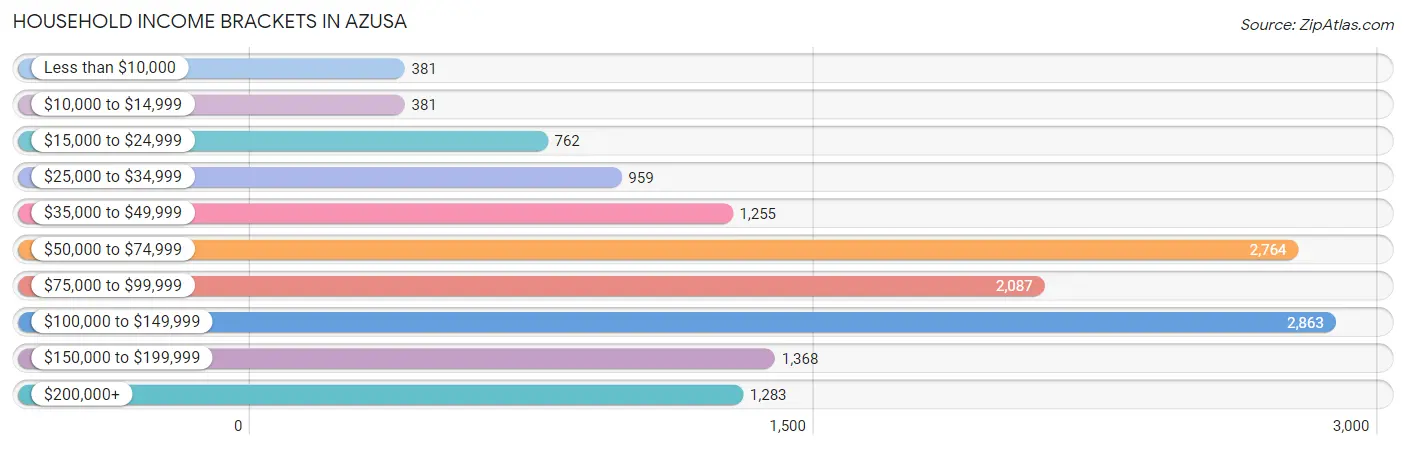
| Income Bracket | # Households | % Households |
| Less than $10,000 | 381 | 2.7% |
| $10,000 to $14,999 | 381 | 2.7% |
| $15,000 to $24,999 | 762 | 5.4% |
| $25,000 to $34,999 | 959 | 6.8% |
| $35,000 to $49,999 | 1,255 | 8.9% |
| $50,000 to $74,999 | 2,764 | 19.6% |
| $75,000 to $99,999 | 2,087 | 14.8% |
| $100,000 to $149,999 | 2,863 | 20.3% |
| $150,000 to $199,999 | 1,368 | 9.7% |
| $200,000+ | 1,283 | 9.1% |
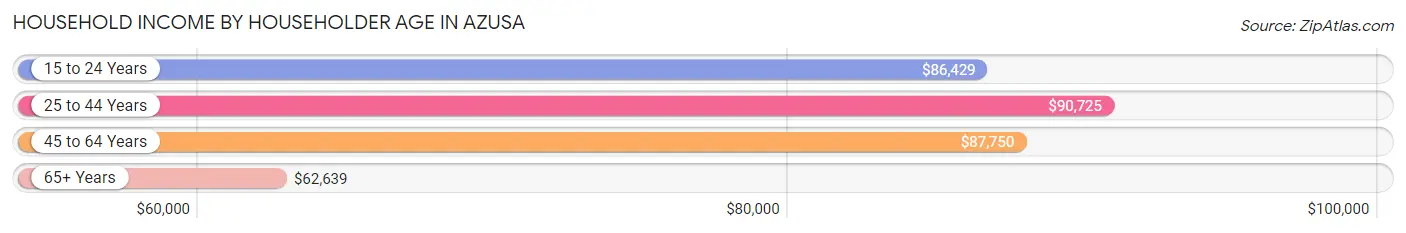
Household Income by Householder Age in Azusa
The median household income in Azusa is $81,516, with the highest median household income of $90,725 found in the 25 to 44 years age bracket for the primary householder. A total of 5,203 households (36.9%) fall into this category. Meanwhile, the 65+ years age bracket for the primary householder has the lowest median household income of $62,639, with 2,804 households (19.9%) in this group.
| Income Bracket | # Households | Median Income |
| 15 to 24 Years | 370 (2.6%) | $86,429 |
| 25 to 44 Years | 5,203 (36.9%) | $90,725 |
| 45 to 64 Years | 5,725 (40.6%) | $87,750 |
| 65+ Years | 2,804 (19.9%) | $62,639 |
| Total | 14,102 (100.0%) | $81,516 |
Poverty in Azusa
Income Below Poverty by Sex and Age in Azusa
With 12.9% poverty level for males and 13.6% for females among the residents of Azusa, 5 year old males and under 5 year old females are the most vulnerable to poverty, with 131 males (32.4%) and 353 females (27.6%) in their respective age groups living below the poverty level.
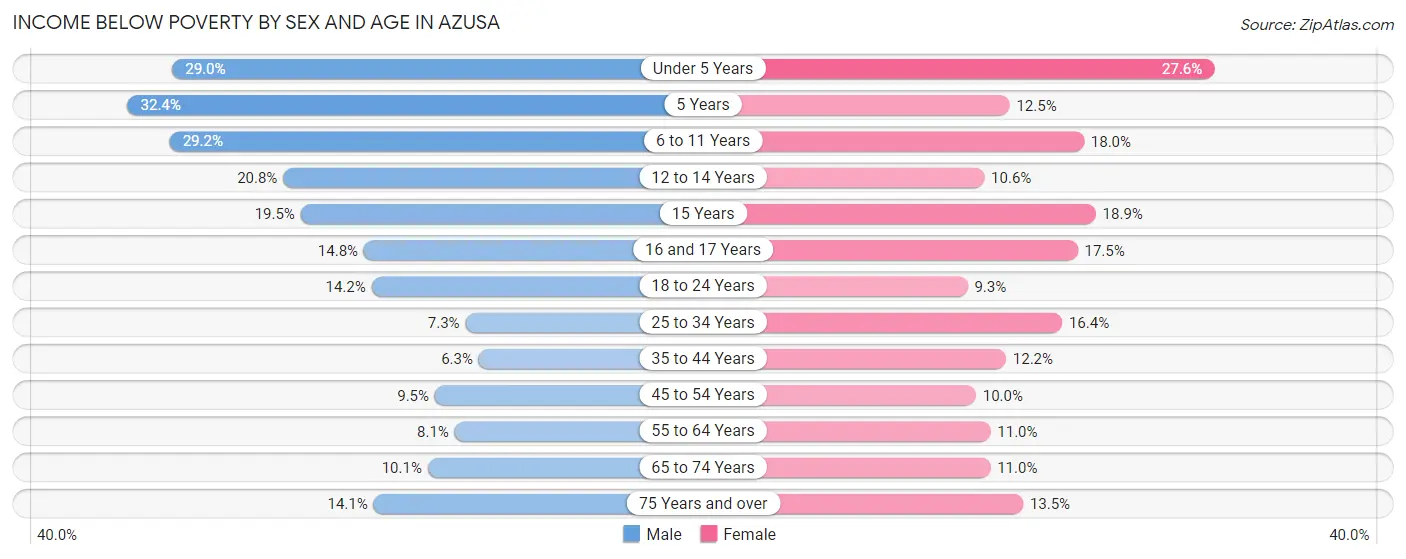
| Age Bracket | Male | Female |
| Under 5 Years | 409 (29.0%) | 353 (27.6%) |
| 5 Years | 131 (32.4%) | 33 (12.4%) |
| 6 to 11 Years | 519 (29.2%) | 269 (18.0%) |
| 12 to 14 Years | 239 (20.8%) | 91 (10.6%) |
| 15 Years | 39 (19.5%) | 46 (18.9%) |
| 16 and 17 Years | 68 (14.8%) | 91 (17.5%) |
| 18 to 24 Years | 341 (14.2%) | 181 (9.3%) |
| 25 to 34 Years | 318 (7.3%) | 591 (16.4%) |
| 35 to 44 Years | 226 (6.3%) | 385 (12.2%) |
| 45 to 54 Years | 261 (9.5%) | 298 (10.0%) |
| 55 to 64 Years | 208 (8.1%) | 305 (11.0%) |
| 65 to 74 Years | 152 (10.1%) | 206 (11.0%) |
| 75 Years and over | 112 (14.1%) | 167 (13.5%) |
| Total | 3,023 (12.9%) | 3,016 (13.6%) |
Income Above Poverty by Sex and Age in Azusa
According to the poverty statistics in Azusa, males aged 35 to 44 years and females aged 18 to 24 years are the age groups that are most secure financially, with 93.7% of males and 90.7% of females in these age groups living above the poverty line.
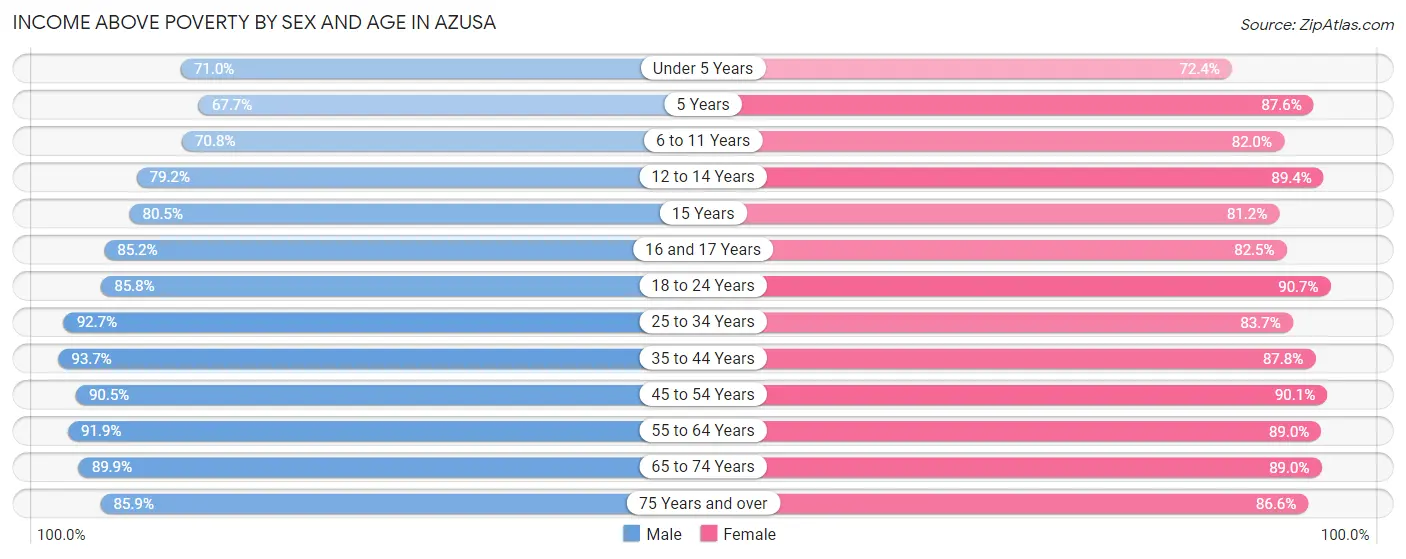
| Age Bracket | Male | Female |
| Under 5 Years | 1,000 (71.0%) | 924 (72.4%) |
| 5 Years | 274 (67.6%) | 232 (87.5%) |
| 6 to 11 Years | 1,257 (70.8%) | 1,228 (82.0%) |
| 12 to 14 Years | 910 (79.2%) | 770 (89.4%) |
| 15 Years | 161 (80.5%) | 198 (81.1%) |
| 16 and 17 Years | 391 (85.2%) | 429 (82.5%) |
| 18 to 24 Years | 2,054 (85.8%) | 1,760 (90.7%) |
| 25 to 34 Years | 4,056 (92.7%) | 3,023 (83.7%) |
| 35 to 44 Years | 3,373 (93.7%) | 2,777 (87.8%) |
| 45 to 54 Years | 2,476 (90.5%) | 2,698 (90.0%) |
| 55 to 64 Years | 2,370 (91.9%) | 2,461 (89.0%) |
| 65 to 74 Years | 1,358 (89.9%) | 1,664 (89.0%) |
| 75 Years and over | 683 (85.9%) | 1,075 (86.6%) |
| Total | 20,363 (87.1%) | 19,239 (86.5%) |
Income Below Poverty Among Married-Couple Families in Azusa
The poverty statistics for married-couple families in Azusa show that 5.9% or 389 of the total 6,610 families live below the poverty line. Families with 5 or more children have the highest poverty rate of 100.0%, comprising of 11 families. On the other hand, families with no children have the lowest poverty rate of 2.5%, which includes 92 families.
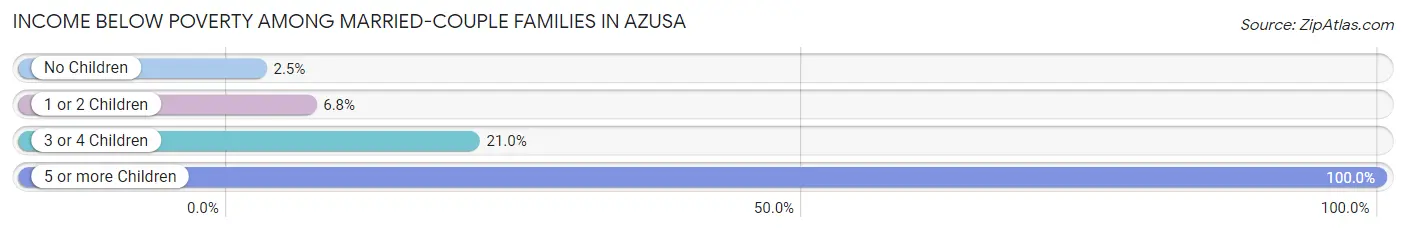
| Children | Above Poverty | Below Poverty |
| No Children | 3,617 (97.5%) | 92 (2.5%) |
| 1 or 2 Children | 2,108 (93.2%) | 154 (6.8%) |
| 3 or 4 Children | 496 (79.0%) | 132 (21.0%) |
| 5 or more Children | 0 (0.0%) | 11 (100.0%) |
| Total | 6,221 (94.1%) | 389 (5.9%) |
Income Below Poverty Among Single-Parent Households in Azusa
According to the poverty data in Azusa, 7.2% or 78 single-father households and 21.2% or 528 single-mother households are living below the poverty line. Among single-father households, those with 3 or 4 children have the highest poverty rate, with 29 households (20.1%) experiencing poverty. Likewise, among single-mother households, those with 3 or 4 children have the highest poverty rate, with 195 households (58.6%) falling below the poverty line.
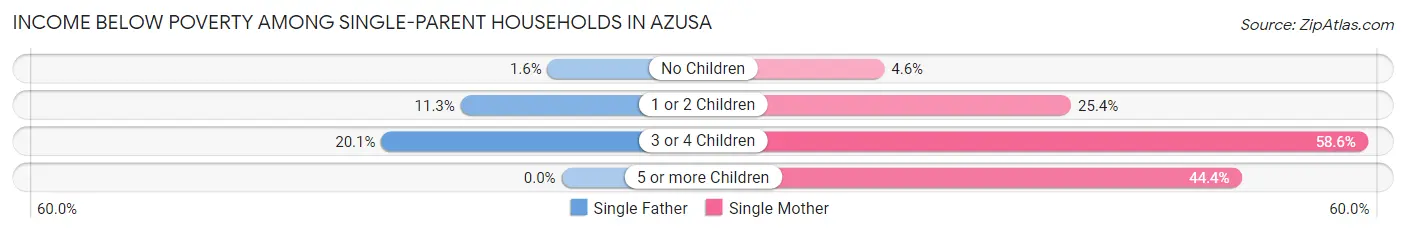
| Children | Single Father | Single Mother |
| No Children | 9 (1.6%) | 48 (4.5%) |
| 1 or 2 Children | 40 (11.3%) | 273 (25.4%) |
| 3 or 4 Children | 29 (20.1%) | 195 (58.6%) |
| 5 or more Children | 0 (0.0%) | 12 (44.4%) |
| Total | 78 (7.2%) | 528 (21.2%) |
Income Below Poverty Among Married-Couple vs Single-Parent Households in Azusa
The poverty data for Azusa shows that 389 of the married-couple family households (5.9%) and 606 of the single-parent households (17.0%) are living below the poverty level. Within the married-couple family households, those with 5 or more children have the highest poverty rate, with 11 households (100.0%) falling below the poverty line. Among the single-parent households, those with 3 or 4 children have the highest poverty rate, with 224 household (47.0%) living below poverty.
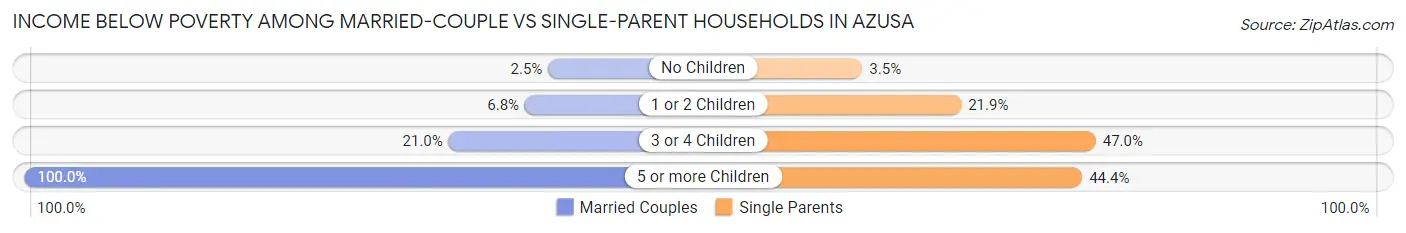
| Children | Married-Couple Families | Single-Parent Households |
| No Children | 92 (2.5%) | 57 (3.5%) |
| 1 or 2 Children | 154 (6.8%) | 313 (21.9%) |
| 3 or 4 Children | 132 (21.0%) | 224 (47.0%) |
| 5 or more Children | 11 (100.0%) | 12 (44.4%) |
| Total | 389 (5.9%) | 606 (17.0%) |
Race in Azusa
The most populous races in Azusa are Hispanic or Latino (32,142 | 64.7%), White / Caucasian (18,950 | 38.1%), and Some other Race (11,056 | 22.2%).
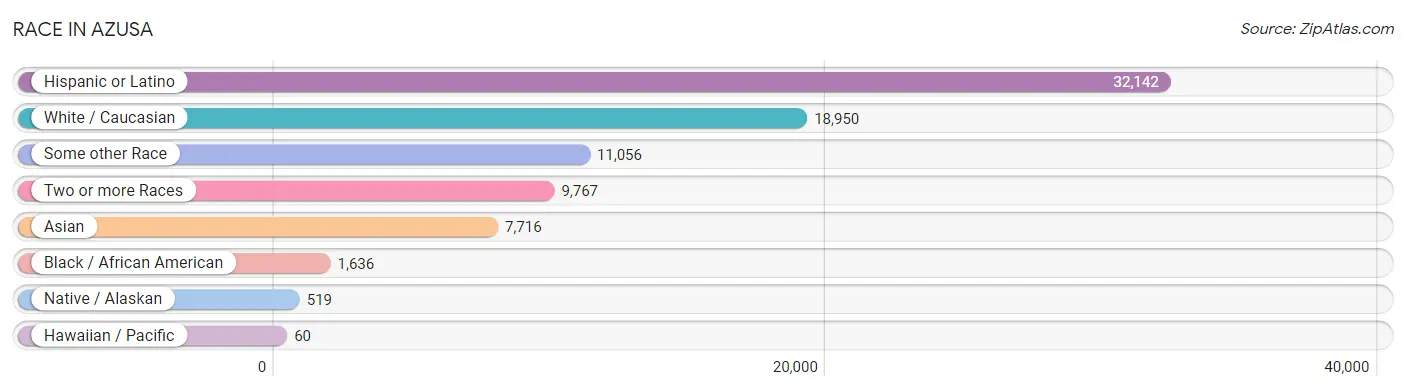
| Race | # Population | % Population |
| Asian | 7,716 | 15.5% |
| Black / African American | 1,636 | 3.3% |
| Hawaiian / Pacific | 60 | 0.1% |
| Hispanic or Latino | 32,142 | 64.7% |
| Native / Alaskan | 519 | 1.0% |
| White / Caucasian | 18,950 | 38.1% |
| Two or more Races | 9,767 | 19.7% |
| Some other Race | 11,056 | 22.2% |
| Total | 49,704 | 100.0% |
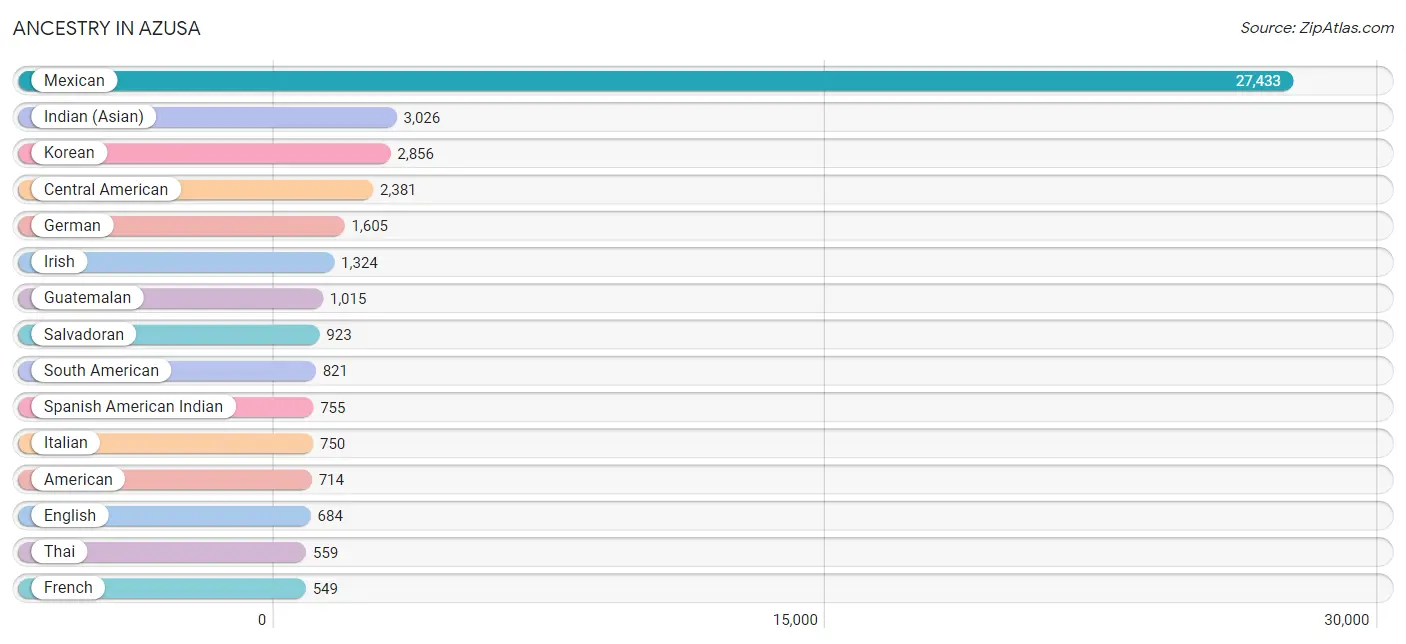
Ancestry in Azusa
The most populous ancestries reported in Azusa are Mexican (27,433 | 55.2%), Indian (Asian) (3,026 | 6.1%), Korean (2,856 | 5.8%), Central American (2,381 | 4.8%), and German (1,605 | 3.2%), together accounting for 75.0% of all Azusa residents.
| Ancestry | # Population | % Population |
| Afghan | 43 | 0.1% |
| African | 91 | 0.2% |
| American | 714 | 1.4% |
| Apache | 6 | 0.0% |
| Arab | 276 | 0.6% |
| Argentinean | 218 | 0.4% |
| Armenian | 306 | 0.6% |
| Australian | 61 | 0.1% |
| Austrian | 13 | 0.0% |
| Belizean | 142 | 0.3% |
| Bhutanese | 508 | 1.0% |
| Blackfeet | 4 | 0.0% |
| Brazilian | 22 | 0.0% |
| British | 119 | 0.2% |
| Burmese | 494 | 1.0% |
| Cambodian | 28 | 0.1% |
| Canadian | 61 | 0.1% |
| Cape Verdean | 6 | 0.0% |
| Central American | 2,381 | 4.8% |
| Central American Indian | 55 | 0.1% |
| Cherokee | 112 | 0.2% |
| Chickasaw | 8 | 0.0% |
| Chilean | 120 | 0.2% |
| Chippewa | 2 | 0.0% |
| Colombian | 140 | 0.3% |
| Costa Rican | 183 | 0.4% |
| Creek | 12 | 0.0% |
| Croatian | 9 | 0.0% |
| Cuban | 179 | 0.4% |
| Czech | 8 | 0.0% |
| Danish | 48 | 0.1% |
| Dominican | 2 | 0.0% |
| Dutch | 173 | 0.4% |
| Eastern European | 18 | 0.0% |
| Ecuadorian | 76 | 0.2% |
| Egyptian | 61 | 0.1% |
| English | 684 | 1.4% |
| Estonian | 31 | 0.1% |
| Ethiopian | 6 | 0.0% |
| European | 529 | 1.1% |
| Filipino | 109 | 0.2% |
| French | 549 | 1.1% |
| French Canadian | 28 | 0.1% |
| German | 1,605 | 3.2% |
| Ghanaian | 15 | 0.0% |
| Greek | 75 | 0.2% |
| Guamanian / Chamorro | 6 | 0.0% |
| Guatemalan | 1,015 | 2.0% |
| Guyanese | 7 | 0.0% |
| Haitian | 15 | 0.0% |
| Honduran | 159 | 0.3% |
| Hungarian | 39 | 0.1% |
| Indian (Asian) | 3,026 | 6.1% |
| Indonesian | 44 | 0.1% |
| Inupiat | 4 | 0.0% |
| Iranian | 46 | 0.1% |
| Iraqi | 24 | 0.1% |
| Irish | 1,324 | 2.7% |
| Israeli | 6 | 0.0% |
| Italian | 750 | 1.5% |
| Jamaican | 21 | 0.0% |
| Japanese | 75 | 0.2% |
| Jordanian | 52 | 0.1% |
| Kenyan | 6 | 0.0% |
| Korean | 2,856 | 5.8% |
| Laotian | 31 | 0.1% |
| Latvian | 8 | 0.0% |
| Lebanese | 88 | 0.2% |
| Lithuanian | 50 | 0.1% |
| Luxembourger | 6 | 0.0% |
| Macedonian | 4 | 0.0% |
| Maltese | 39 | 0.1% |
| Mexican | 27,433 | 55.2% |
| Mexican American Indian | 449 | 0.9% |
| Native Hawaiian | 93 | 0.2% |
| Navajo | 7 | 0.0% |
| Nicaraguan | 101 | 0.2% |
| Nigerian | 46 | 0.1% |
| Northern European | 136 | 0.3% |
| Norwegian | 213 | 0.4% |
| Okinawan | 25 | 0.1% |
| Paiute | 10 | 0.0% |
| Pakistani | 64 | 0.1% |
| Paraguayan | 15 | 0.0% |
| Peruvian | 245 | 0.5% |
| Polish | 210 | 0.4% |
| Portuguese | 58 | 0.1% |
| Pueblo | 27 | 0.1% |
| Puerto Rican | 303 | 0.6% |
| Romanian | 32 | 0.1% |
| Russian | 57 | 0.1% |
| Salvadoran | 923 | 1.9% |
| Scandinavian | 97 | 0.2% |
| Scotch-Irish | 44 | 0.1% |
| Scottish | 159 | 0.3% |
| Seminole | 10 | 0.0% |
| Serbian | 16 | 0.0% |
| Slavic | 47 | 0.1% |
| Slovak | 16 | 0.0% |
| Slovene | 5 | 0.0% |
| South African | 18 | 0.0% |
| South American | 821 | 1.7% |
| Spaniard | 304 | 0.6% |
| Spanish | 169 | 0.3% |
| Spanish American Indian | 755 | 1.5% |
| Sri Lankan | 493 | 1.0% |
| Subsaharan African | 189 | 0.4% |
| Swedish | 183 | 0.4% |
| Swiss | 83 | 0.2% |
| Syrian | 19 | 0.0% |
| Thai | 559 | 1.1% |
| Turkish | 7 | 0.0% |
| Ukrainian | 13 | 0.0% |
| Uruguayan | 7 | 0.0% |
| Welsh | 37 | 0.1% |
| Yaqui | 16 | 0.0% | View All 116 Rows |
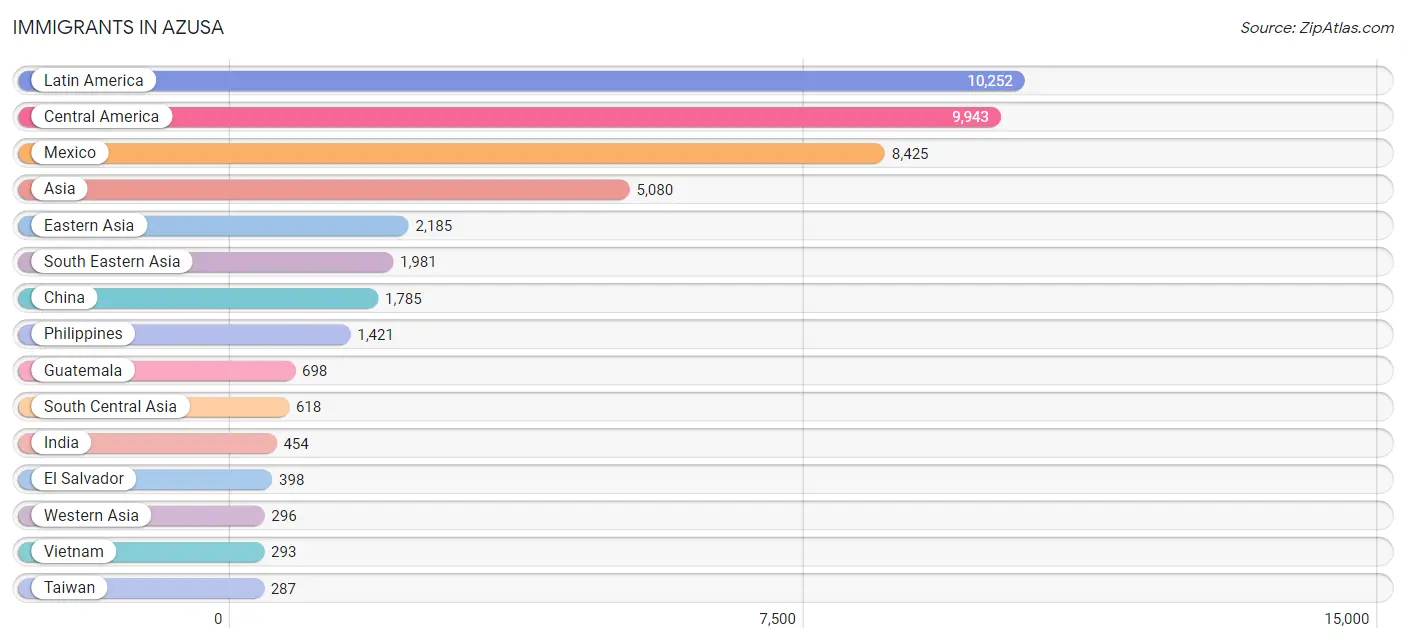
Immigrants in Azusa
The most numerous immigrant groups reported in Azusa came from Latin America (10,252 | 20.6%), Central America (9,943 | 20.0%), Mexico (8,425 | 17.0%), Asia (5,080 | 10.2%), and Eastern Asia (2,185 | 4.4%), together accounting for 72.2% of all Azusa residents.
| Immigration Origin | # Population | % Population |
| Afghanistan | 14 | 0.0% |
| Africa | 147 | 0.3% |
| Argentina | 109 | 0.2% |
| Armenia | 22 | 0.0% |
| Asia | 5,080 | 10.2% |
| Belize | 72 | 0.1% |
| Brazil | 22 | 0.0% |
| Bulgaria | 12 | 0.0% |
| Cambodia | 4 | 0.0% |
| Cameroon | 6 | 0.0% |
| Canada | 76 | 0.2% |
| Caribbean | 53 | 0.1% |
| Central America | 9,943 | 20.0% |
| China | 1,785 | 3.6% |
| Colombia | 74 | 0.2% |
| Costa Rica | 135 | 0.3% |
| Cuba | 32 | 0.1% |
| Dominican Republic | 16 | 0.0% |
| Eastern Africa | 6 | 0.0% |
| Eastern Asia | 2,185 | 4.4% |
| Eastern Europe | 60 | 0.1% |
| Egypt | 26 | 0.1% |
| El Salvador | 398 | 0.8% |
| England | 6 | 0.0% |
| Europe | 200 | 0.4% |
| France | 30 | 0.1% |
| Germany | 60 | 0.1% |
| Ghana | 9 | 0.0% |
| Greece | 11 | 0.0% |
| Guatemala | 698 | 1.4% |
| Haiti | 5 | 0.0% |
| Honduras | 166 | 0.3% |
| Hong Kong | 37 | 0.1% |
| Hungary | 8 | 0.0% |
| India | 454 | 0.9% |
| Indonesia | 74 | 0.2% |
| Iran | 34 | 0.1% |
| Iraq | 49 | 0.1% |
| Israel | 13 | 0.0% |
| Italy | 6 | 0.0% |
| Japan | 178 | 0.4% |
| Jordan | 8 | 0.0% |
| Kenya | 6 | 0.0% |
| Korea | 222 | 0.4% |
| Kuwait | 11 | 0.0% |
| Latin America | 10,252 | 20.6% |
| Lebanon | 163 | 0.3% |
| Malaysia | 75 | 0.2% |
| Mexico | 8,425 | 17.0% |
| Middle Africa | 6 | 0.0% |
| Nepal | 23 | 0.1% |
| Nicaragua | 49 | 0.1% |
| Nigeria | 10 | 0.0% |
| Northern Africa | 70 | 0.1% |
| Northern Europe | 33 | 0.1% |
| Oceania | 12 | 0.0% |
| Pakistan | 55 | 0.1% |
| Peru | 51 | 0.1% |
| Philippines | 1,421 | 2.9% |
| Poland | 15 | 0.0% |
| Romania | 5 | 0.0% |
| Russia | 16 | 0.0% |
| Saudi Arabia | 11 | 0.0% |
| Singapore | 37 | 0.1% |
| South Africa | 46 | 0.1% |
| South America | 256 | 0.5% |
| South Central Asia | 618 | 1.2% |
| South Eastern Asia | 1,981 | 4.0% |
| Southern Europe | 17 | 0.0% |
| Sri Lanka | 38 | 0.1% |
| Syria | 19 | 0.0% |
| Taiwan | 287 | 0.6% |
| Thailand | 33 | 0.1% |
| Vietnam | 293 | 0.6% |
| Western Africa | 19 | 0.0% |
| Western Asia | 296 | 0.6% |
| Western Europe | 90 | 0.2% | View All 77 Rows |
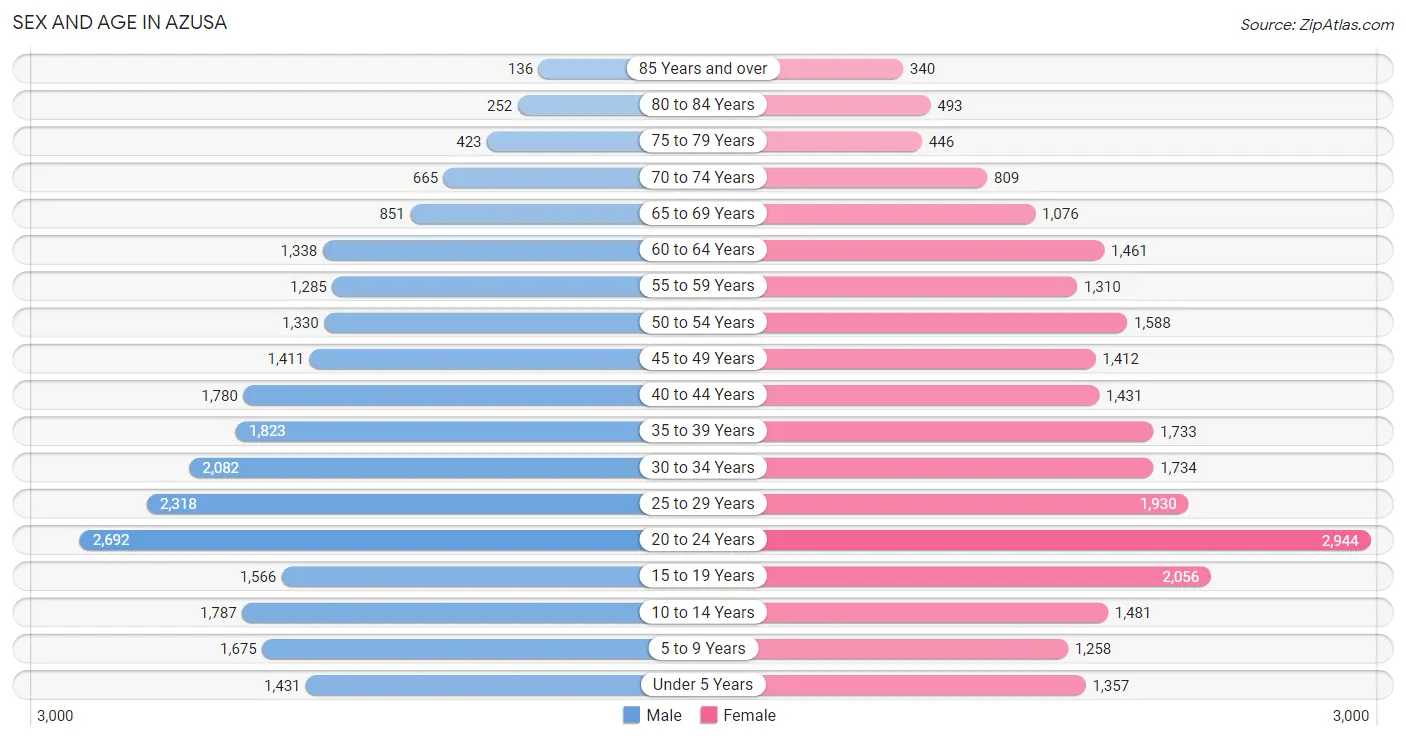
Sex and Age in Azusa
Sex and Age in Azusa
The most populous age groups in Azusa are 20 to 24 Years (2,692 | 10.8%) for men and 20 to 24 Years (2,944 | 11.8%) for women.
| Age Bracket | Male | Female |
| Under 5 Years | 1,431 (5.8%) | 1,357 (5.5%) |
| 5 to 9 Years | 1,675 (6.7%) | 1,258 (5.1%) |
| 10 to 14 Years | 1,787 (7.2%) | 1,481 (6.0%) |
| 15 to 19 Years | 1,566 (6.3%) | 2,056 (8.3%) |
| 20 to 24 Years | 2,692 (10.8%) | 2,944 (11.8%) |
| 25 to 29 Years | 2,318 (9.3%) | 1,930 (7.8%) |
| 30 to 34 Years | 2,082 (8.4%) | 1,734 (7.0%) |
| 35 to 39 Years | 1,823 (7.3%) | 1,733 (7.0%) |
| 40 to 44 Years | 1,780 (7.2%) | 1,431 (5.8%) |
| 45 to 49 Years | 1,411 (5.7%) | 1,412 (5.7%) |
| 50 to 54 Years | 1,330 (5.3%) | 1,588 (6.4%) |
| 55 to 59 Years | 1,285 (5.2%) | 1,310 (5.3%) |
| 60 to 64 Years | 1,338 (5.4%) | 1,461 (5.9%) |
| 65 to 69 Years | 851 (3.4%) | 1,076 (4.3%) |
| 70 to 74 Years | 665 (2.7%) | 809 (3.3%) |
| 75 to 79 Years | 423 (1.7%) | 446 (1.8%) |
| 80 to 84 Years | 252 (1.0%) | 493 (2.0%) |
| 85 Years and over | 136 (0.5%) | 340 (1.4%) |
| Total | 24,845 (100.0%) | 24,859 (100.0%) |
Families and Households in Azusa
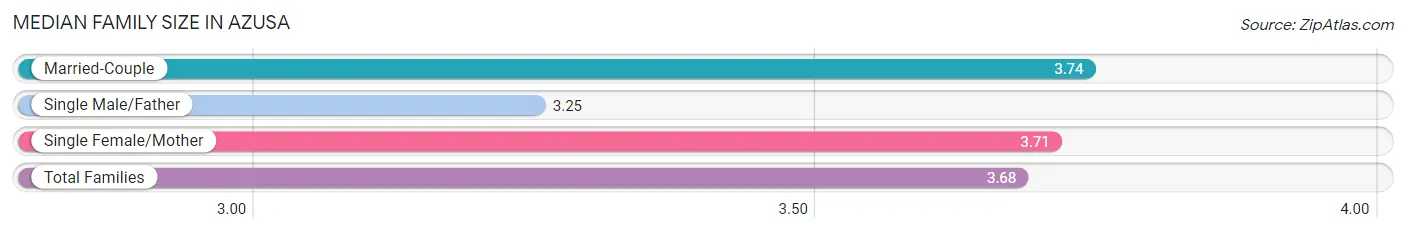
Median Family Size in Azusa
The median family size in Azusa is 3.68 persons per family, with married-couple families (6,610 | 65.0%) accounting for the largest median family size of 3.74 persons per family. On the other hand, single male/father families (1,077 | 10.6%) represent the smallest median family size with 3.25 persons per family.
| Family Type | # Families | Family Size |
| Married-Couple | 6,610 (65.0%) | 3.74 |
| Single Male/Father | 1,077 (10.6%) | 3.25 |
| Single Female/Mother | 2,488 (24.4%) | 3.71 |
| Total Families | 10,175 (100.0%) | 3.68 |
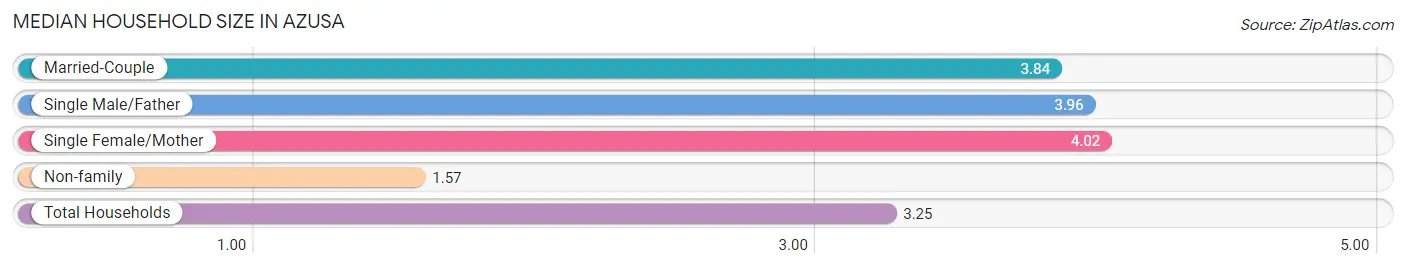
Median Household Size in Azusa
The median household size in Azusa is 3.25 persons per household, with single female/mother households (2,488 | 17.6%) accounting for the largest median household size of 4.02 persons per household. non-family households (3,927 | 27.9%) represent the smallest median household size with 1.57 persons per household.
| Household Type | # Households | Household Size |
| Married-Couple | 6,610 (46.9%) | 3.84 |
| Single Male/Father | 1,077 (7.6%) | 3.96 |
| Single Female/Mother | 2,488 (17.6%) | 4.02 |
| Non-family | 3,927 (27.9%) | 1.57 |
| Total Households | 14,102 (100.0%) | 3.25 |
Household Size by Marriage Status in Azusa
Out of a total of 14,102 households in Azusa, 10,175 (72.2%) are family households, while 3,927 (27.9%) are nonfamily households. The most numerous type of family households are 2-person households, comprising 3,105, and the most common type of nonfamily households are 1-person households, comprising 2,424.
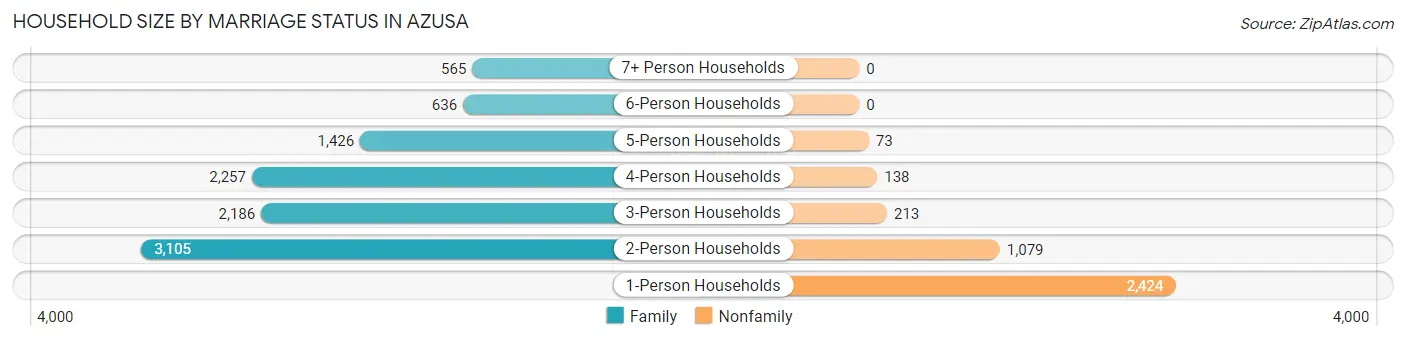
| Household Size | Family Households | Nonfamily Households |
| 1-Person Households | - | 2,424 (17.2%) |
| 2-Person Households | 3,105 (22.0%) | 1,079 (7.6%) |
| 3-Person Households | 2,186 (15.5%) | 213 (1.5%) |
| 4-Person Households | 2,257 (16.0%) | 138 (1.0%) |
| 5-Person Households | 1,426 (10.1%) | 73 (0.5%) |
| 6-Person Households | 636 (4.5%) | 0 (0.0%) |
| 7+ Person Households | 565 (4.0%) | 0 (0.0%) |
| Total | 10,175 (72.2%) | 3,927 (27.9%) |
Female Fertility in Azusa
Fertility by Age in Azusa
Average fertility rate in Azusa is 51.0 births per 1,000 women. Women in the age bracket of 20 to 34 years have the highest fertility rate with 73.0 births per 1,000 women. Women in the age bracket of 20 to 34 years acount for 68.6% of all women with births.
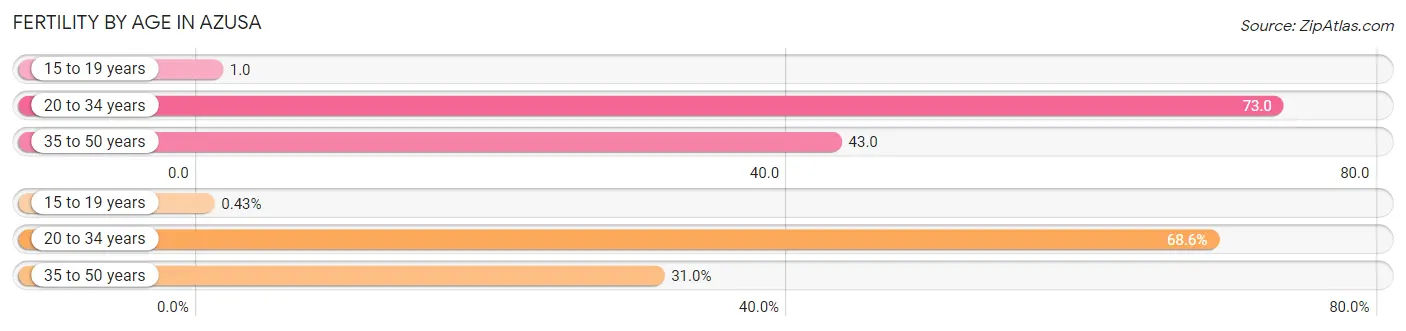
| Age Bracket | Women with Births | Births / 1,000 Women |
| 15 to 19 years | 3 (0.4%) | 1.0 |
| 20 to 34 years | 481 (68.6%) | 73.0 |
| 35 to 50 years | 217 (31.0%) | 43.0 |
| Total | 701 (100.0%) | 51.0 |
Fertility by Age by Marriage Status in Azusa
53.6% of women with births (701) in Azusa are married. The highest percentage of unmarried women with births falls into 20 to 34 years age bracket with 50.5% of them unmarried at the time of birth, while the lowest percentage of unmarried women with births belong to 15 to 19 years age bracket with 0.0% of them unmarried.
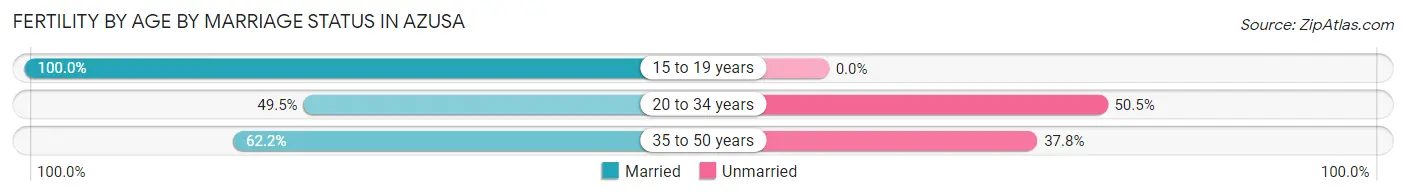
| Age Bracket | Married | Unmarried |
| 15 to 19 years | 3 (100.0%) | 0 (0.0%) |
| 20 to 34 years | 238 (49.5%) | 243 (50.5%) |
| 35 to 50 years | 135 (62.2%) | 82 (37.8%) |
| Total | 376 (53.6%) | 325 (46.4%) |
Fertility by Education in Azusa
Average fertility rate in Azusa is 51.0 births per 1,000 women. Women with the education attainment of high school diploma have the highest fertility rate of 97.0 births per 1,000 women, while women with the education attainment of college or associate's degree have the lowest fertility at 21.0 births per 1,000 women. Women with the education attainment of high school diploma represent 36.4% of all women with births.
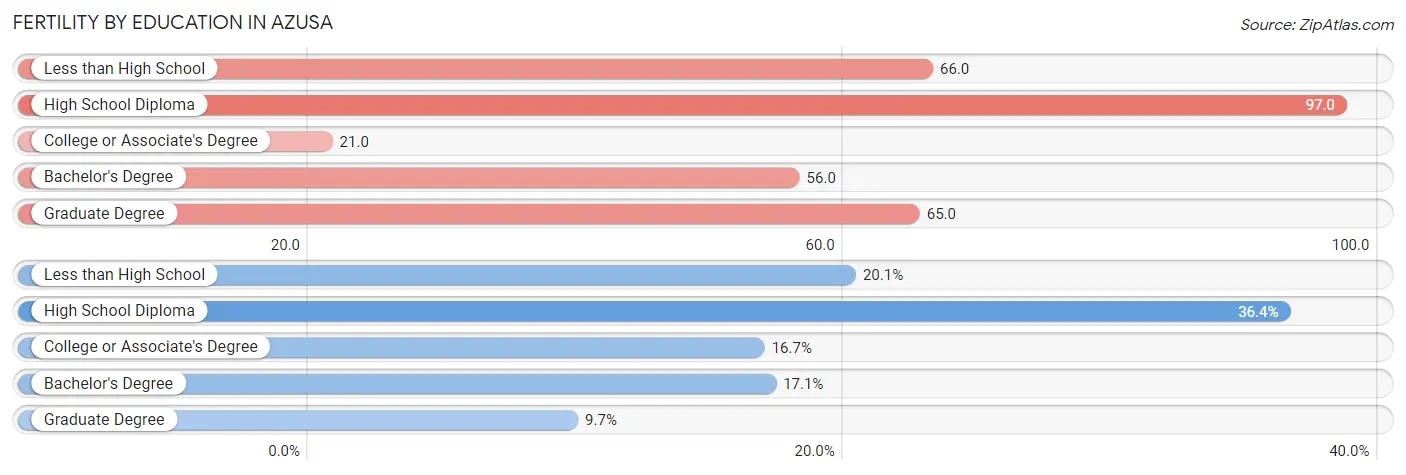
| Educational Attainment | Women with Births | Births / 1,000 Women |
| Less than High School | 141 (20.1%) | 66.0 |
| High School Diploma | 255 (36.4%) | 97.0 |
| College or Associate's Degree | 117 (16.7%) | 21.0 |
| Bachelor's Degree | 120 (17.1%) | 56.0 |
| Graduate Degree | 68 (9.7%) | 65.0 |
| Total | 701 (100.0%) | 51.0 |
Fertility by Education by Marriage Status in Azusa
46.4% of women with births in Azusa are unmarried. Women with the educational attainment of graduate degree are most likely to be married with 100.0% of them married at childbirth, while women with the educational attainment of less than high school are least likely to be married with 89.4% of them unmarried at childbirth.
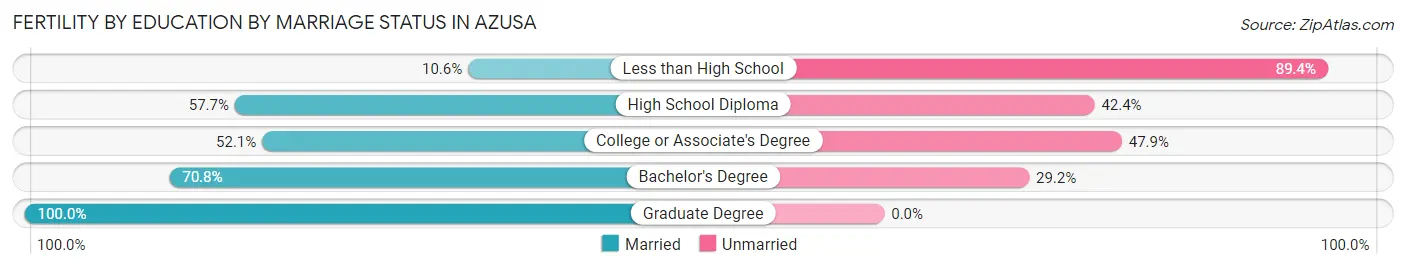
| Educational Attainment | Married | Unmarried |
| Less than High School | 15 (10.6%) | 126 (89.4%) |
| High School Diploma | 147 (57.7%) | 108 (42.3%) |
| College or Associate's Degree | 61 (52.1%) | 56 (47.9%) |
| Bachelor's Degree | 85 (70.8%) | 35 (29.2%) |
| Graduate Degree | 68 (100.0%) | 0 (0.0%) |
| Total | 376 (53.6%) | 325 (46.4%) |
Employment Characteristics in Azusa
Employment by Class of Employer in Azusa
Among the 24,382 employed individuals in Azusa, private company employees (16,893 | 69.3%), not-for-profit organizations (2,784 | 11.4%), and local government employees (2,450 | 10.1%) make up the most common classes of employment.
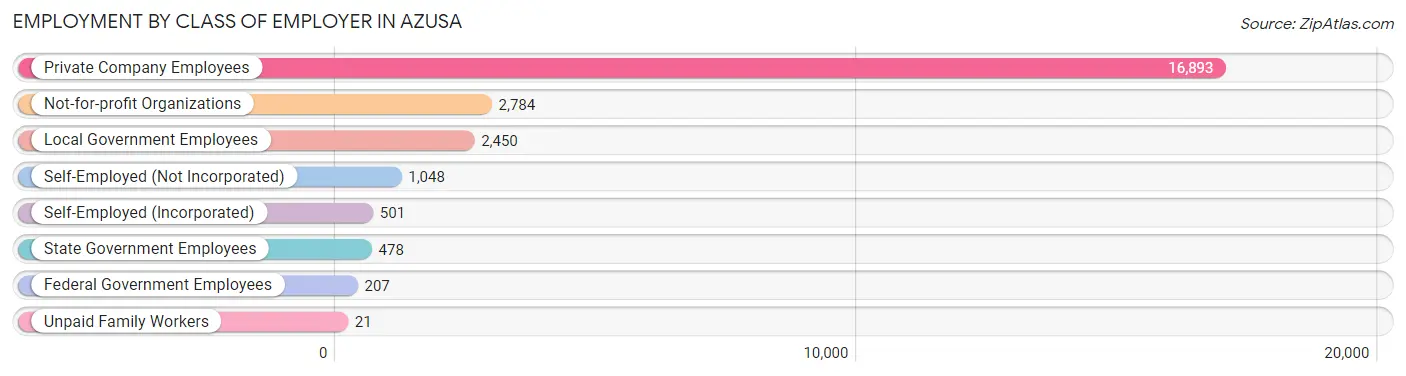
| Employer Class | # Employees | % Employees |
| Private Company Employees | 16,893 | 69.3% |
| Self-Employed (Incorporated) | 501 | 2.1% |
| Self-Employed (Not Incorporated) | 1,048 | 4.3% |
| Not-for-profit Organizations | 2,784 | 11.4% |
| Local Government Employees | 2,450 | 10.1% |
| State Government Employees | 478 | 2.0% |
| Federal Government Employees | 207 | 0.9% |
| Unpaid Family Workers | 21 | 0.1% |
| Total | 24,382 | 100.0% |
Employment Status by Age in Azusa
According to the labor force statistics for Azusa, out of the total population over 16 years of age (40,270), 66.1% or 26,618 individuals are in the labor force, with 6.1% or 1,624 of them unemployed. The age group with the highest labor force participation rate is 35 to 44 years, with 87.8% or 5,941 individuals in the labor force. Within the labor force, the 75 years and over age range has the highest percentage of unemployed individuals, with 13.4% or 24 of them being unemployed.
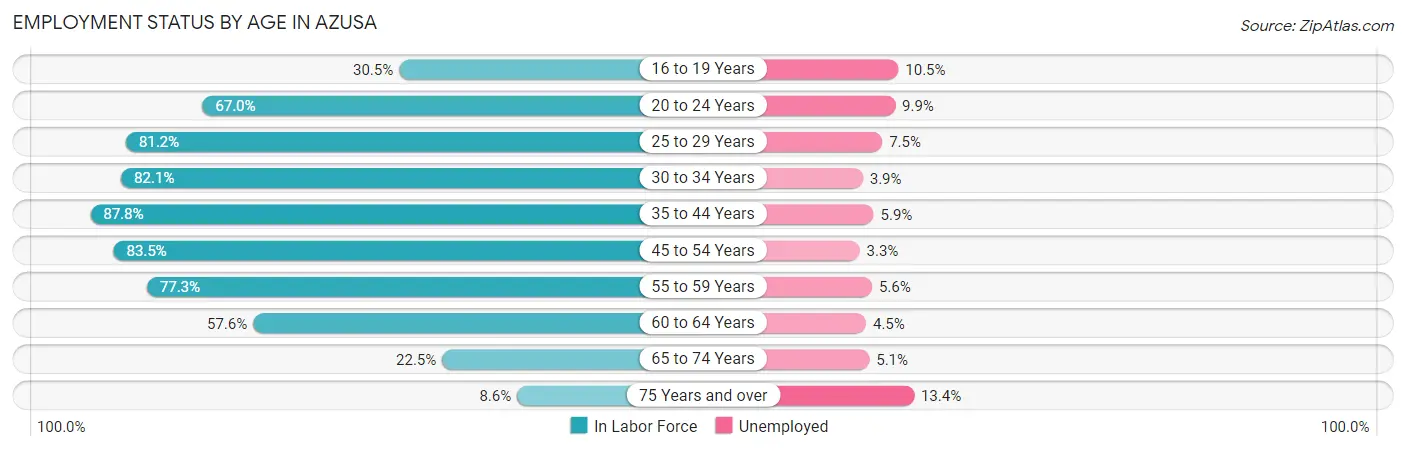
| Age Bracket | In Labor Force | Unemployed |
| 16 to 19 Years | 969 (30.5%) | 102 (10.5%) |
| 20 to 24 Years | 3,776 (67.0%) | 374 (9.9%) |
| 25 to 29 Years | 3,449 (81.2%) | 259 (7.5%) |
| 30 to 34 Years | 3,133 (82.1%) | 122 (3.9%) |
| 35 to 44 Years | 5,941 (87.8%) | 351 (5.9%) |
| 45 to 54 Years | 4,794 (83.5%) | 158 (3.3%) |
| 55 to 59 Years | 2,006 (77.3%) | 112 (5.6%) |
| 60 to 64 Years | 1,612 (57.6%) | 73 (4.5%) |
| 65 to 74 Years | 765 (22.5%) | 39 (5.1%) |
| 75 Years and over | 180 (8.6%) | 24 (13.4%) |
| Total | 26,618 (66.1%) | 1,624 (6.1%) |
Employment Status by Educational Attainment in Azusa
According to labor force statistics for Azusa, 80.6% of individuals (20,929) out of the total population between 25 and 64 years of age (25,966) are in the labor force, with 5.1% or 1,067 of them being unemployed. The group with the highest labor force participation rate are those with the educational attainment of bachelor's degree or higher, with 87.3% or 6,279 individuals in the labor force. Within the labor force, individuals with college / associate degree education have the highest percentage of unemployment, with 6.4% or 418 of them being unemployed.
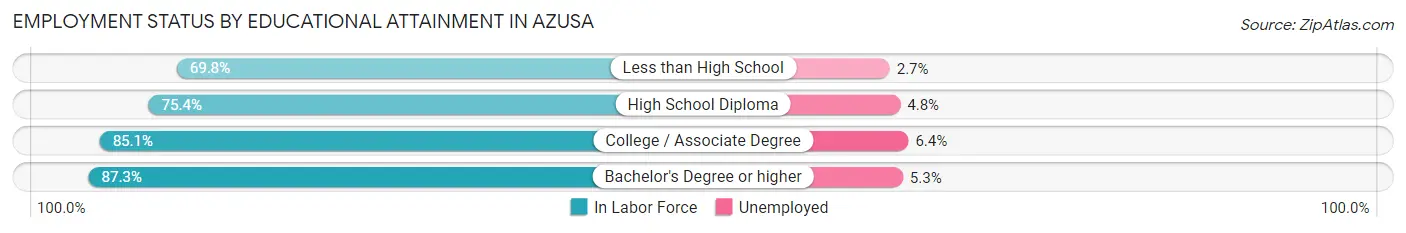
| Educational Attainment | In Labor Force | Unemployed |
| Less than High School | 3,117 (69.8%) | 121 (2.7%) |
| High School Diploma | 5,008 (75.4%) | 319 (4.8%) |
| College / Associate Degree | 6,525 (85.1%) | 491 (6.4%) |
| Bachelor's Degree or higher | 6,279 (87.3%) | 381 (5.3%) |
| Total | 20,929 (80.6%) | 1,324 (5.1%) |
Employment Occupations by Sex in Azusa
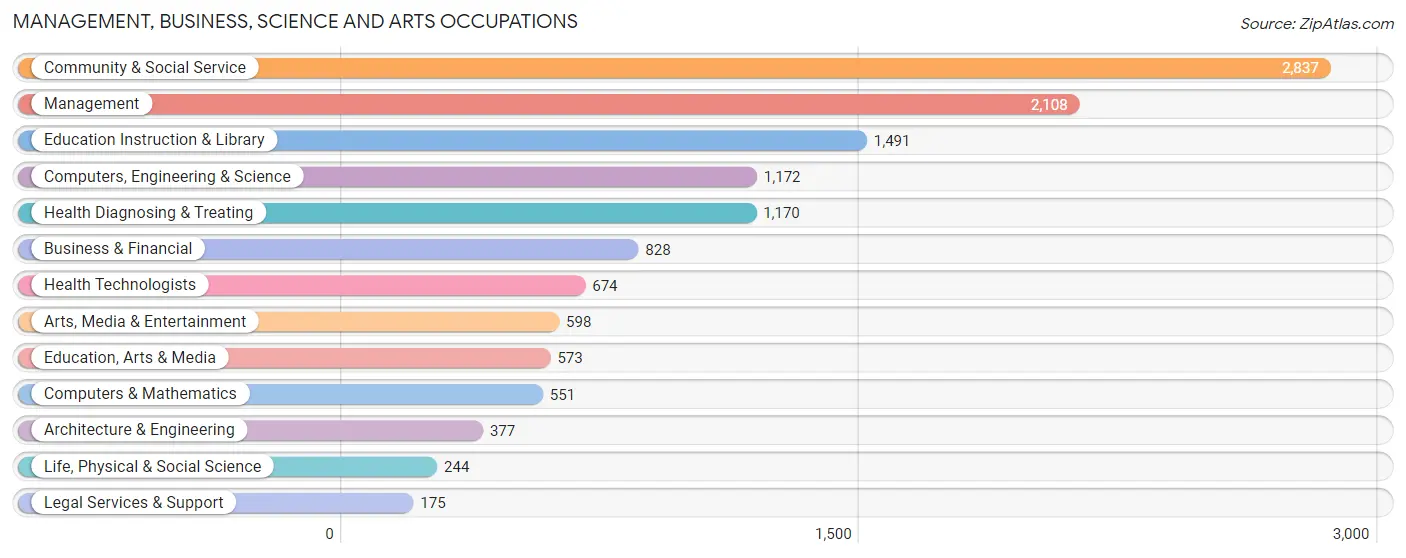
Management, Business, Science and Arts Occupations
The most common Management, Business, Science and Arts occupations in Azusa are Community & Social Service (2,837 | 11.4%), Management (2,108 | 8.4%), Education Instruction & Library (1,491 | 6.0%), Computers, Engineering & Science (1,172 | 4.7%), and Health Diagnosing & Treating (1,170 | 4.7%).
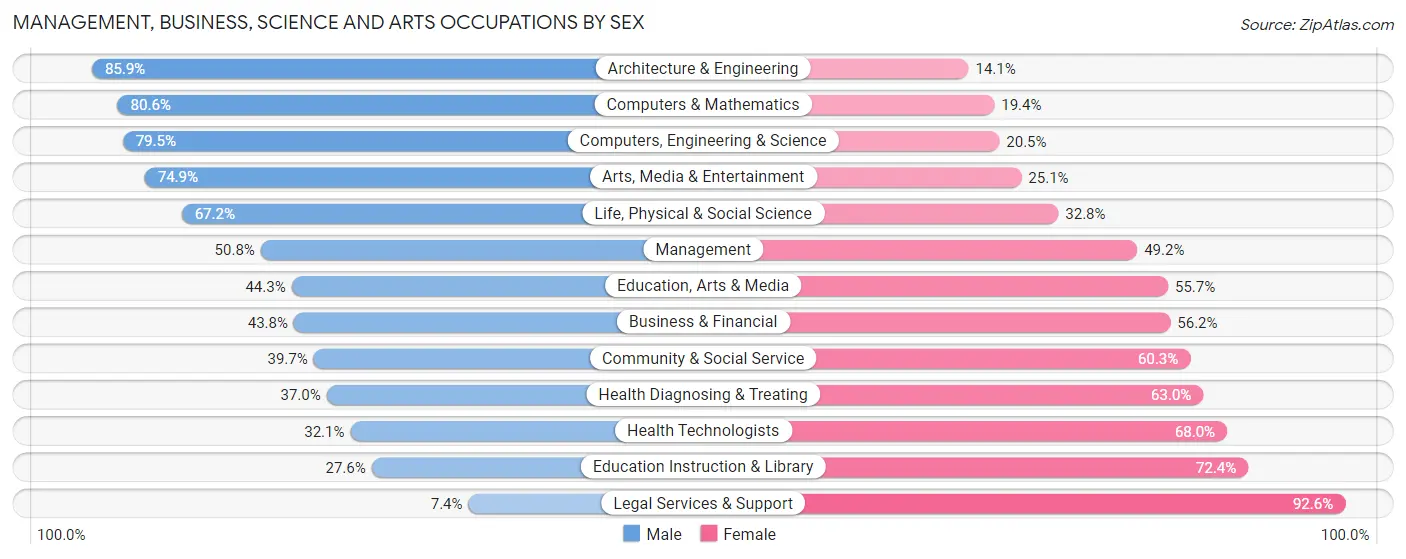
Management, Business, Science and Arts Occupations by Sex
Within the Management, Business, Science and Arts occupations in Azusa, the most male-oriented occupations are Architecture & Engineering (85.9%), Computers & Mathematics (80.6%), and Computers, Engineering & Science (79.5%), while the most female-oriented occupations are Legal Services & Support (92.6%), Education Instruction & Library (72.4%), and Health Technologists (67.9%).
| Occupation | Male | Female |
| Management | 1,070 (50.8%) | 1,038 (49.2%) |
| Business & Financial | 363 (43.8%) | 465 (56.2%) |
| Computers, Engineering & Science | 932 (79.5%) | 240 (20.5%) |
| Computers & Mathematics | 444 (80.6%) | 107 (19.4%) |
| Architecture & Engineering | 324 (85.9%) | 53 (14.1%) |
| Life, Physical & Social Science | 164 (67.2%) | 80 (32.8%) |
| Community & Social Service | 1,127 (39.7%) | 1,710 (60.3%) |
| Education, Arts & Media | 254 (44.3%) | 319 (55.7%) |
| Legal Services & Support | 13 (7.4%) | 162 (92.6%) |
| Education Instruction & Library | 412 (27.6%) | 1,079 (72.4%) |
| Arts, Media & Entertainment | 448 (74.9%) | 150 (25.1%) |
| Health Diagnosing & Treating | 433 (37.0%) | 737 (63.0%) |
| Health Technologists | 216 (32.1%) | 458 (67.9%) |
| Total (Category) | 3,925 (48.4%) | 4,190 (51.6%) |
| Total (Overall) | 13,621 (54.5%) | 11,366 (45.5%) |
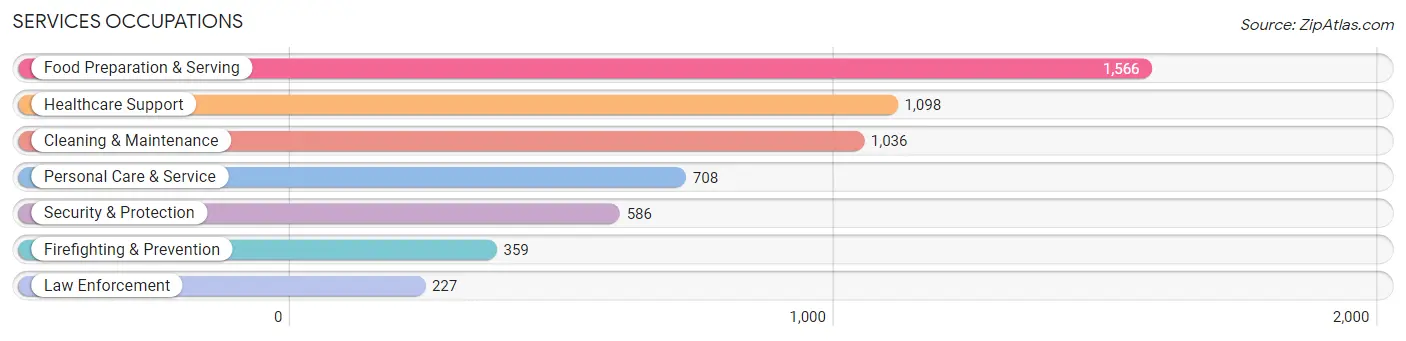
Services Occupations
The most common Services occupations in Azusa are Food Preparation & Serving (1,566 | 6.3%), Healthcare Support (1,098 | 4.4%), Cleaning & Maintenance (1,036 | 4.2%), Personal Care & Service (708 | 2.8%), and Security & Protection (586 | 2.4%).
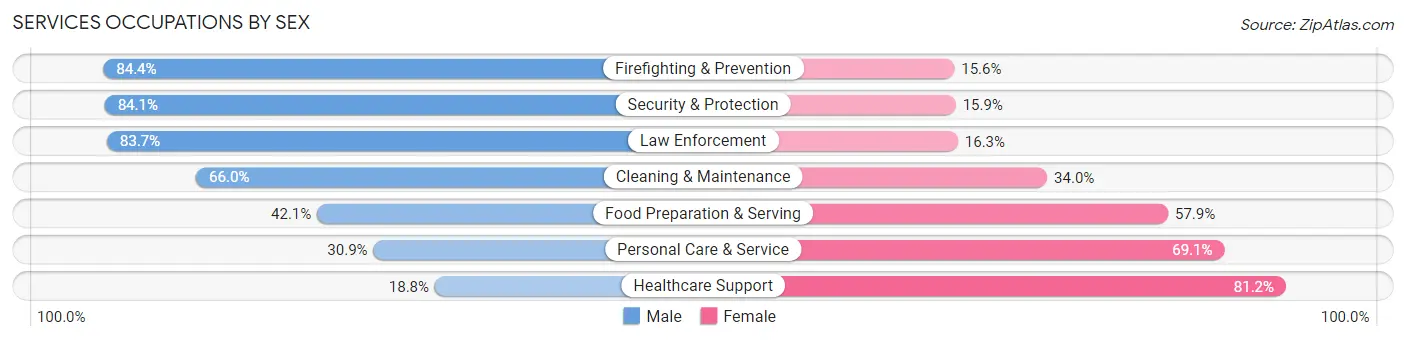
Services Occupations by Sex
Within the Services occupations in Azusa, the most male-oriented occupations are Firefighting & Prevention (84.4%), Security & Protection (84.1%), and Law Enforcement (83.7%), while the most female-oriented occupations are Healthcare Support (81.2%), Personal Care & Service (69.1%), and Food Preparation & Serving (57.9%).
| Occupation | Male | Female |
| Healthcare Support | 206 (18.8%) | 892 (81.2%) |
| Security & Protection | 493 (84.1%) | 93 (15.9%) |
| Firefighting & Prevention | 303 (84.4%) | 56 (15.6%) |
| Law Enforcement | 190 (83.7%) | 37 (16.3%) |
| Food Preparation & Serving | 659 (42.1%) | 907 (57.9%) |
| Cleaning & Maintenance | 684 (66.0%) | 352 (34.0%) |
| Personal Care & Service | 219 (30.9%) | 489 (69.1%) |
| Total (Category) | 2,261 (45.3%) | 2,733 (54.7%) |
| Total (Overall) | 13,621 (54.5%) | 11,366 (45.5%) |
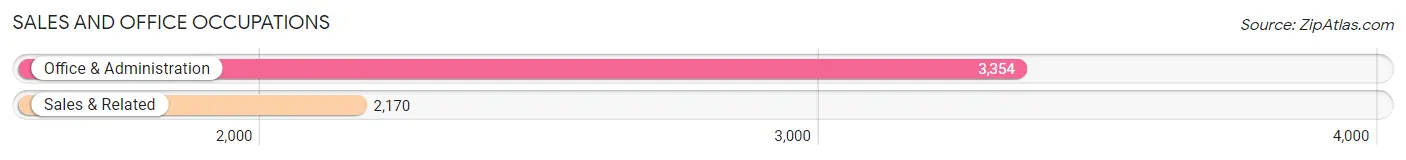
Sales and Office Occupations
The most common Sales and Office occupations in Azusa are Office & Administration (3,354 | 13.4%), and Sales & Related (2,170 | 8.7%).
Sales and Office Occupations by Sex
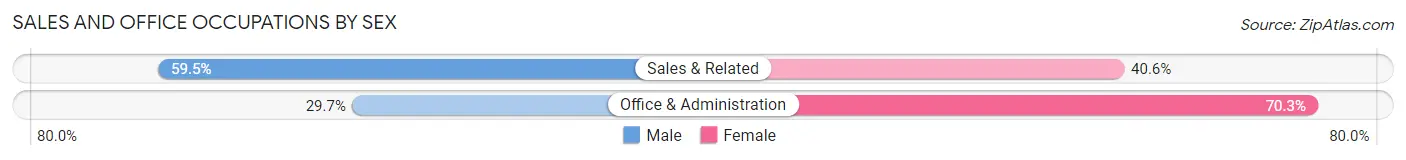
| Occupation | Male | Female |
| Sales & Related | 1,290 (59.5%) | 880 (40.6%) |
| Office & Administration | 995 (29.7%) | 2,359 (70.3%) |
| Total (Category) | 2,285 (41.4%) | 3,239 (58.6%) |
| Total (Overall) | 13,621 (54.5%) | 11,366 (45.5%) |
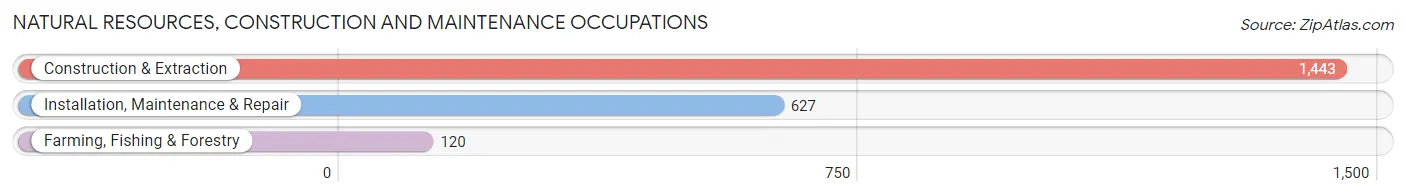
Natural Resources, Construction and Maintenance Occupations
The most common Natural Resources, Construction and Maintenance occupations in Azusa are Construction & Extraction (1,443 | 5.8%), Installation, Maintenance & Repair (627 | 2.5%), and Farming, Fishing & Forestry (120 | 0.5%).
Natural Resources, Construction and Maintenance Occupations by Sex
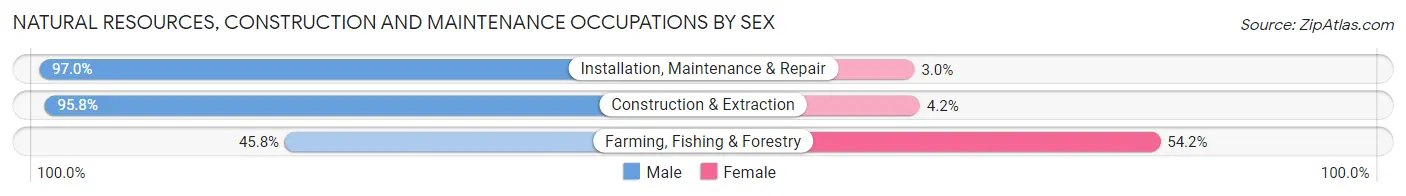
| Occupation | Male | Female |
| Farming, Fishing & Forestry | 55 (45.8%) | 65 (54.2%) |
| Construction & Extraction | 1,383 (95.8%) | 60 (4.2%) |
| Installation, Maintenance & Repair | 608 (97.0%) | 19 (3.0%) |
| Total (Category) | 2,046 (93.4%) | 144 (6.6%) |
| Total (Overall) | 13,621 (54.5%) | 11,366 (45.5%) |
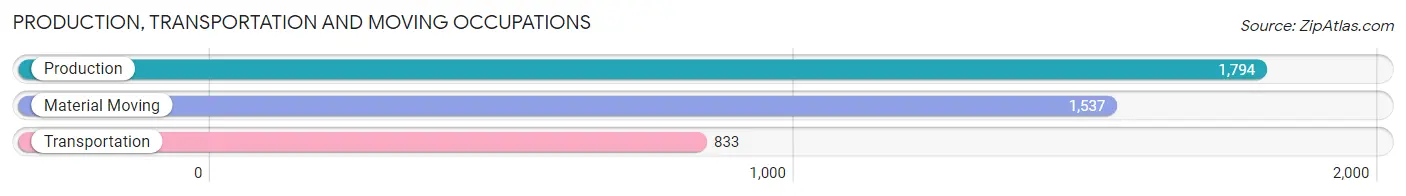
Production, Transportation and Moving Occupations
The most common Production, Transportation and Moving occupations in Azusa are Production (1,794 | 7.2%), Material Moving (1,537 | 6.1%), and Transportation (833 | 3.3%).
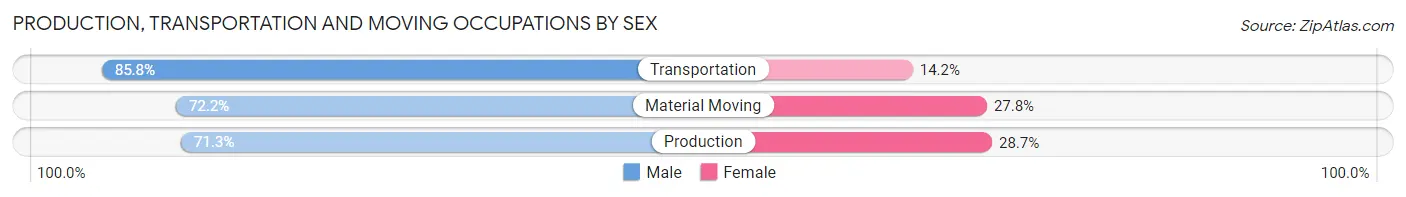
Production, Transportation and Moving Occupations by Sex
| Occupation | Male | Female |
| Production | 1,279 (71.3%) | 515 (28.7%) |
| Transportation | 715 (85.8%) | 118 (14.2%) |
| Material Moving | 1,110 (72.2%) | 427 (27.8%) |
| Total (Category) | 3,104 (74.5%) | 1,060 (25.5%) |
| Total (Overall) | 13,621 (54.5%) | 11,366 (45.5%) |
Employment Industries by Sex in Azusa
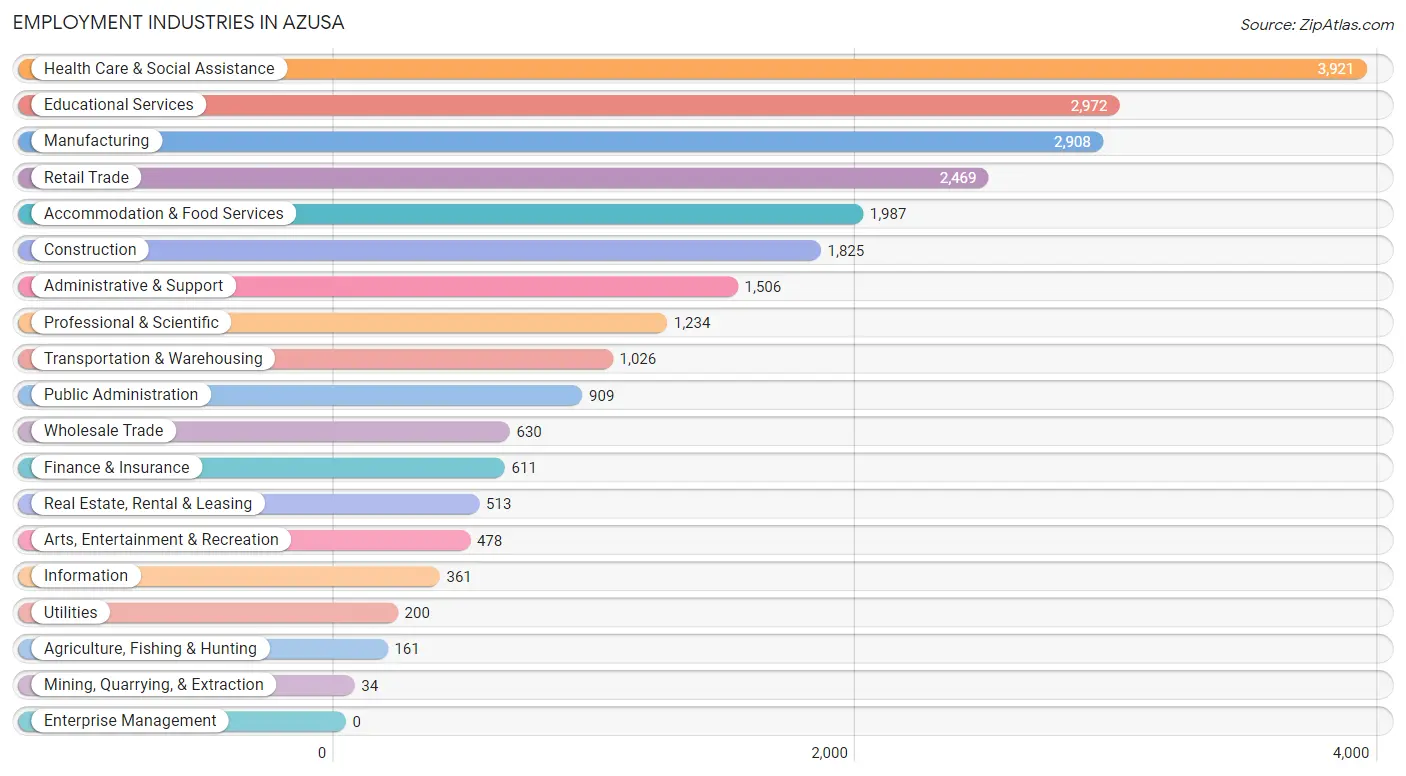
Employment Industries in Azusa
The major employment industries in Azusa include Health Care & Social Assistance (3,921 | 15.7%), Educational Services (2,972 | 11.9%), Manufacturing (2,908 | 11.6%), Retail Trade (2,469 | 9.9%), and Accommodation & Food Services (1,987 | 8.0%).
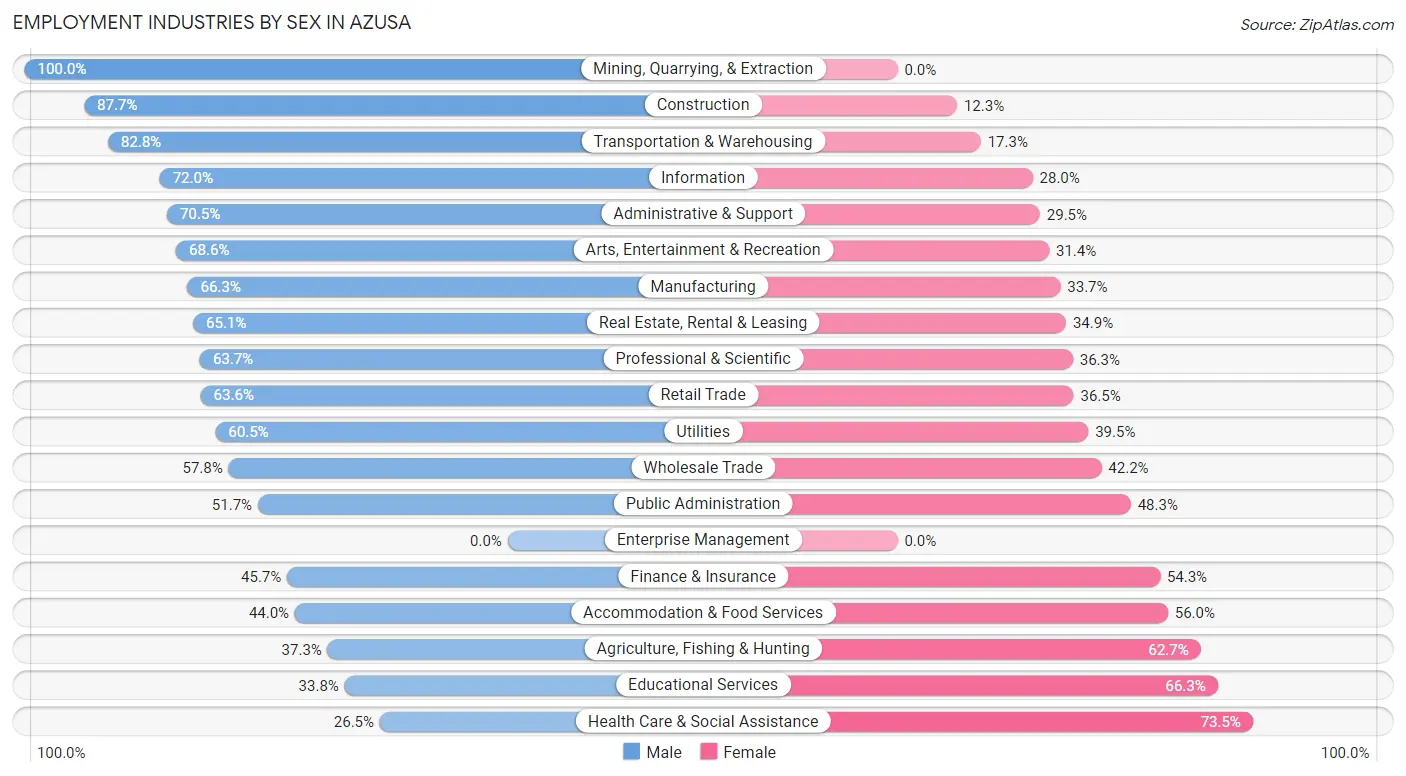
Employment Industries by Sex in Azusa
The Azusa industries that see more men than women are Mining, Quarrying, & Extraction (100.0%), Construction (87.7%), and Transportation & Warehousing (82.8%), whereas the industries that tend to have a higher number of women are Health Care & Social Assistance (73.5%), Educational Services (66.2%), and Agriculture, Fishing & Hunting (62.7%).
| Industry | Male | Female |
| Agriculture, Fishing & Hunting | 60 (37.3%) | 101 (62.7%) |
| Mining, Quarrying, & Extraction | 34 (100.0%) | 0 (0.0%) |
| Construction | 1,600 (87.7%) | 225 (12.3%) |
| Manufacturing | 1,927 (66.3%) | 981 (33.7%) |
| Wholesale Trade | 364 (57.8%) | 266 (42.2%) |
| Retail Trade | 1,569 (63.5%) | 900 (36.4%) |
| Transportation & Warehousing | 849 (82.8%) | 177 (17.2%) |
| Utilities | 121 (60.5%) | 79 (39.5%) |
| Information | 260 (72.0%) | 101 (28.0%) |
| Finance & Insurance | 279 (45.7%) | 332 (54.3%) |
| Real Estate, Rental & Leasing | 334 (65.1%) | 179 (34.9%) |
| Professional & Scientific | 786 (63.7%) | 448 (36.3%) |
| Enterprise Management | 0 (0.0%) | 0 (0.0%) |
| Administrative & Support | 1,062 (70.5%) | 444 (29.5%) |
| Educational Services | 1,003 (33.8%) | 1,969 (66.2%) |
| Health Care & Social Assistance | 1,038 (26.5%) | 2,883 (73.5%) |
| Arts, Entertainment & Recreation | 328 (68.6%) | 150 (31.4%) |
| Accommodation & Food Services | 875 (44.0%) | 1,112 (56.0%) |
| Public Administration | 470 (51.7%) | 439 (48.3%) |
| Total | 13,621 (54.5%) | 11,366 (45.5%) |
Education in Azusa
School Enrollment in Azusa
The most common levels of schooling among the 15,465 students in Azusa are college / undergraduate (6,587 | 42.6%), middle school (2,474 | 16.0%), and elementary school (2,135 | 13.8%).
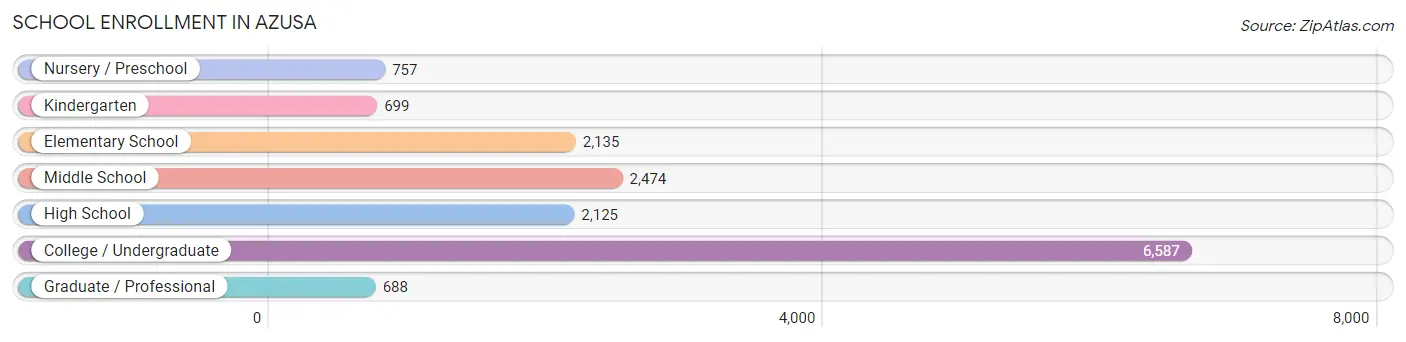
| School Level | # Students | % Students |
| Nursery / Preschool | 757 | 4.9% |
| Kindergarten | 699 | 4.5% |
| Elementary School | 2,135 | 13.8% |
| Middle School | 2,474 | 16.0% |
| High School | 2,125 | 13.7% |
| College / Undergraduate | 6,587 | 42.6% |
| Graduate / Professional | 688 | 4.4% |
| Total | 15,465 | 100.0% |
School Enrollment by Age by Funding Source in Azusa
Out of a total of 15,465 students who are enrolled in schools in Azusa, 4,794 (31.0%) attend a private institution, while the remaining 10,671 (69.0%) are enrolled in public schools. The age group of 20 to 24 year olds has the highest likelihood of being enrolled in private schools, with 2,599 (72.9% in the age bracket) enrolled. Conversely, the age group of 15 to 17 year olds has the lowest likelihood of being enrolled in a private school, with 1,329 (95.8% in the age bracket) attending a public institution.
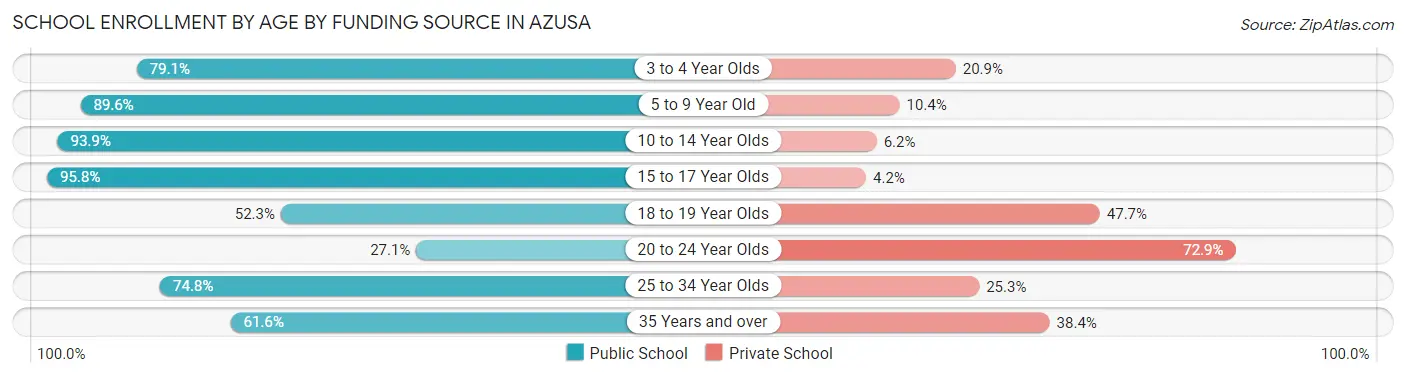
| Age Bracket | Public School | Private School |
| 3 to 4 Year Olds | 451 (79.1%) | 119 (20.9%) |
| 5 to 9 Year Old | 2,505 (89.6%) | 291 (10.4%) |
| 10 to 14 Year Olds | 2,963 (93.9%) | 194 (6.1%) |
| 15 to 17 Year Olds | 1,329 (95.8%) | 58 (4.2%) |
| 18 to 19 Year Olds | 975 (52.3%) | 890 (47.7%) |
| 20 to 24 Year Olds | 964 (27.1%) | 2,599 (72.9%) |
| 25 to 34 Year Olds | 986 (74.8%) | 333 (25.3%) |
| 35 Years and over | 498 (61.6%) | 310 (38.4%) |
| Total | 10,671 (69.0%) | 4,794 (31.0%) |
Educational Attainment by Field of Study in Azusa
Business (1,480 | 16.7%), science & technology (1,031 | 11.7%), social sciences (802 | 9.1%), visual & performing arts (691 | 7.8%), and computers & mathematics (652 | 7.4%) are the most common fields of study among 8,853 individuals in Azusa who have obtained a bachelor's degree or higher.
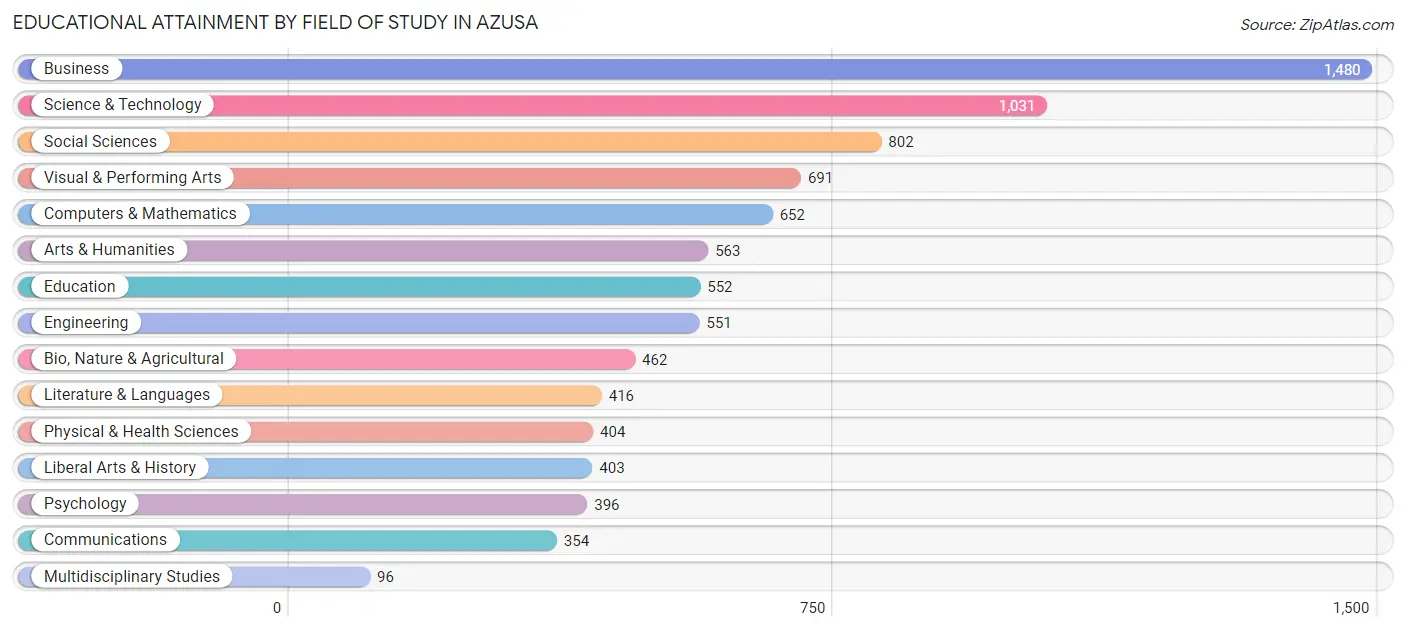
| Field of Study | # Graduates | % Graduates |
| Computers & Mathematics | 652 | 7.4% |
| Bio, Nature & Agricultural | 462 | 5.2% |
| Physical & Health Sciences | 404 | 4.6% |
| Psychology | 396 | 4.5% |
| Social Sciences | 802 | 9.1% |
| Engineering | 551 | 6.2% |
| Multidisciplinary Studies | 96 | 1.1% |
| Science & Technology | 1,031 | 11.7% |
| Business | 1,480 | 16.7% |
| Education | 552 | 6.2% |
| Literature & Languages | 416 | 4.7% |
| Liberal Arts & History | 403 | 4.5% |
| Visual & Performing Arts | 691 | 7.8% |
| Communications | 354 | 4.0% |
| Arts & Humanities | 563 | 6.4% |
| Total | 8,853 | 100.0% |
Transportation & Commute in Azusa
Vehicle Availability by Sex in Azusa
The most prevalent vehicle ownership categories in Azusa are males with 2 vehicles (4,086, accounting for 31.5%) and females with 2 vehicles (3,650, making up 41.5%).
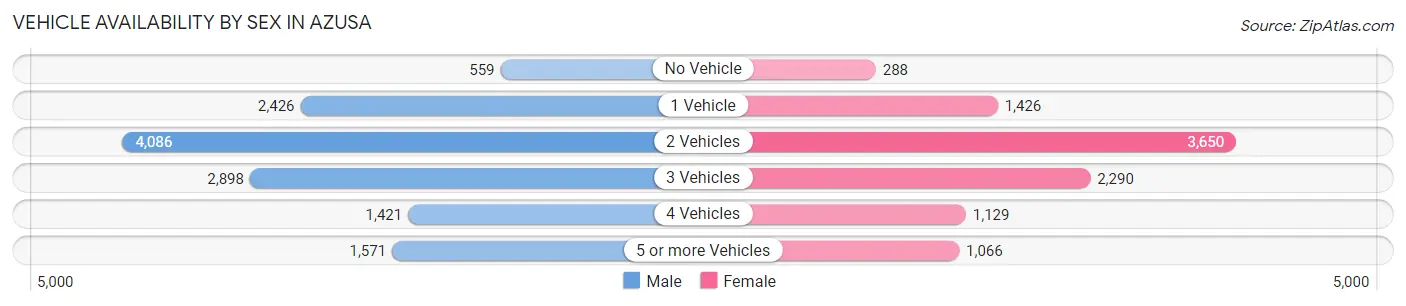
| Vehicles Available | Male | Female |
| No Vehicle | 559 (4.3%) | 288 (2.9%) |
| 1 Vehicle | 2,426 (18.7%) | 1,426 (14.5%) |
| 2 Vehicles | 4,086 (31.5%) | 3,650 (37.1%) |
| 3 Vehicles | 2,898 (22.4%) | 2,290 (23.3%) |
| 4 Vehicles | 1,421 (11.0%) | 1,129 (11.5%) |
| 5 or more Vehicles | 1,571 (12.1%) | 1,066 (10.8%) |
| Total | 12,961 (100.0%) | 9,849 (100.0%) |
Commute Time in Azusa
The most frequently occuring commute durations in Azusa are 30 to 34 minutes (3,854 commuters, 17.0%), 15 to 19 minutes (3,396 commuters, 15.0%), and 10 to 14 minutes (2,908 commuters, 12.8%).
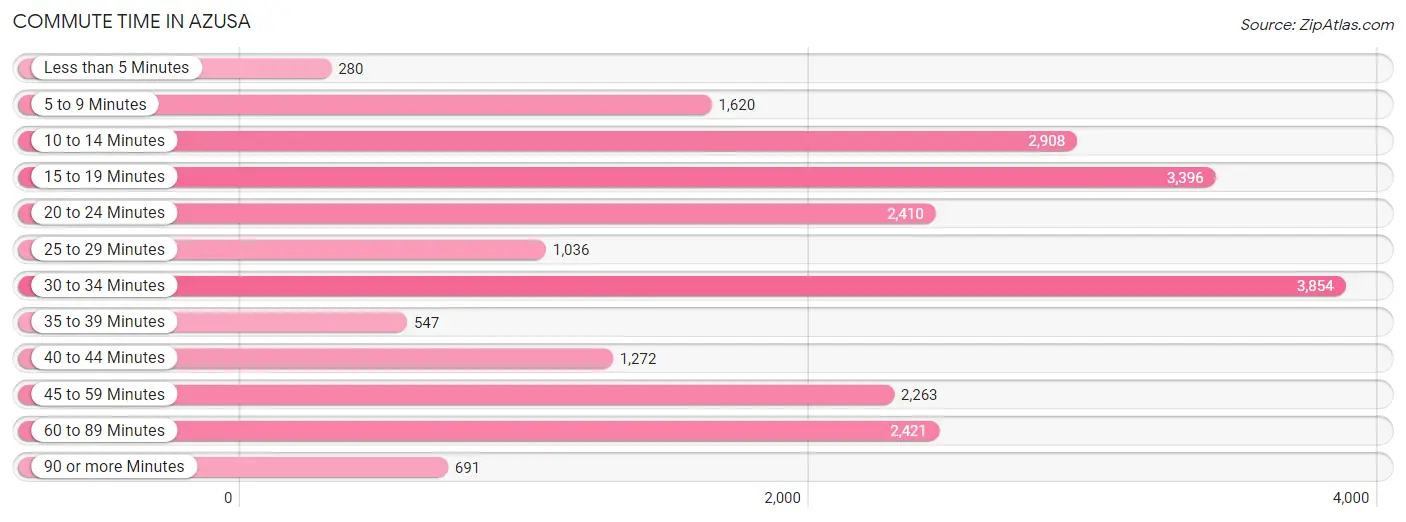
| Commute Time | # Commuters | % Commuters |
| Less than 5 Minutes | 280 | 1.2% |
| 5 to 9 Minutes | 1,620 | 7.1% |
| 10 to 14 Minutes | 2,908 | 12.8% |
| 15 to 19 Minutes | 3,396 | 15.0% |
| 20 to 24 Minutes | 2,410 | 10.6% |
| 25 to 29 Minutes | 1,036 | 4.6% |
| 30 to 34 Minutes | 3,854 | 17.0% |
| 35 to 39 Minutes | 547 | 2.4% |
| 40 to 44 Minutes | 1,272 | 5.6% |
| 45 to 59 Minutes | 2,263 | 10.0% |
| 60 to 89 Minutes | 2,421 | 10.7% |
| 90 or more Minutes | 691 | 3.0% |
Commute Time by Sex in Azusa
The most common commute times in Azusa are 30 to 34 minutes (2,297 commuters, 18.1%) for males and 10 to 14 minutes (1,666 commuters, 16.7%) for females.
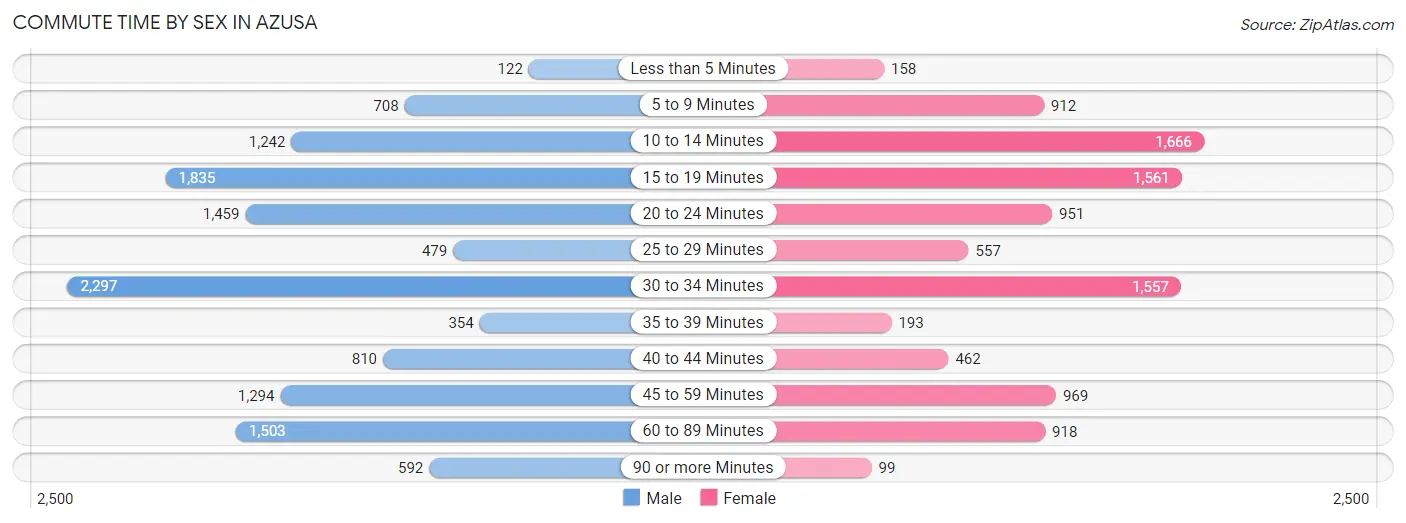
| Commute Time | Male | Female |
| Less than 5 Minutes | 122 (1.0%) | 158 (1.6%) |
| 5 to 9 Minutes | 708 (5.6%) | 912 (9.1%) |
| 10 to 14 Minutes | 1,242 (9.8%) | 1,666 (16.7%) |
| 15 to 19 Minutes | 1,835 (14.4%) | 1,561 (15.6%) |
| 20 to 24 Minutes | 1,459 (11.5%) | 951 (9.5%) |
| 25 to 29 Minutes | 479 (3.8%) | 557 (5.6%) |
| 30 to 34 Minutes | 2,297 (18.1%) | 1,557 (15.6%) |
| 35 to 39 Minutes | 354 (2.8%) | 193 (1.9%) |
| 40 to 44 Minutes | 810 (6.4%) | 462 (4.6%) |
| 45 to 59 Minutes | 1,294 (10.2%) | 969 (9.7%) |
| 60 to 89 Minutes | 1,503 (11.8%) | 918 (9.2%) |
| 90 or more Minutes | 592 (4.7%) | 99 (1.0%) |
Time of Departure to Work by Sex in Azusa
The most frequent times of departure to work in Azusa are 7:00 AM to 7:29 AM (1,737, 13.7%) for males and 7:00 AM to 7:29 AM (1,508, 15.1%) for females.
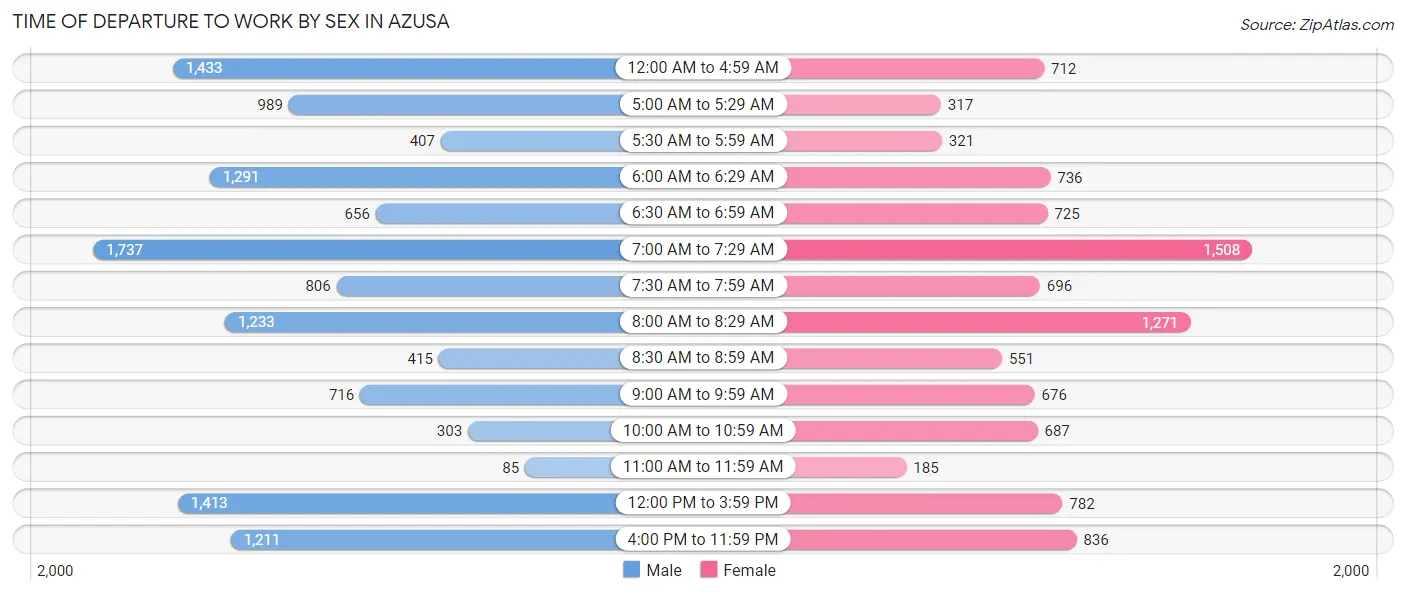
| Time of Departure | Male | Female |
| 12:00 AM to 4:59 AM | 1,433 (11.3%) | 712 (7.1%) |
| 5:00 AM to 5:29 AM | 989 (7.8%) | 317 (3.2%) |
| 5:30 AM to 5:59 AM | 407 (3.2%) | 321 (3.2%) |
| 6:00 AM to 6:29 AM | 1,291 (10.2%) | 736 (7.4%) |
| 6:30 AM to 6:59 AM | 656 (5.2%) | 725 (7.2%) |
| 7:00 AM to 7:29 AM | 1,737 (13.7%) | 1,508 (15.1%) |
| 7:30 AM to 7:59 AM | 806 (6.4%) | 696 (7.0%) |
| 8:00 AM to 8:29 AM | 1,233 (9.7%) | 1,271 (12.7%) |
| 8:30 AM to 8:59 AM | 415 (3.3%) | 551 (5.5%) |
| 9:00 AM to 9:59 AM | 716 (5.6%) | 676 (6.8%) |
| 10:00 AM to 10:59 AM | 303 (2.4%) | 687 (6.9%) |
| 11:00 AM to 11:59 AM | 85 (0.7%) | 185 (1.8%) |
| 12:00 PM to 3:59 PM | 1,413 (11.1%) | 782 (7.8%) |
| 4:00 PM to 11:59 PM | 1,211 (9.5%) | 836 (8.4%) |
| Total | 12,695 (100.0%) | 10,003 (100.0%) |
Housing Occupancy in Azusa
Occupancy by Ownership in Azusa
Of the total 14,102 dwellings in Azusa, owner-occupied units account for 7,683 (54.5%), while renter-occupied units make up 6,419 (45.5%).
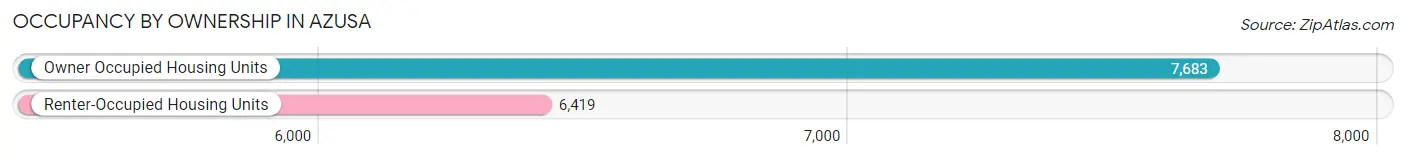
| Occupancy | # Housing Units | % Housing Units |
| Owner Occupied Housing Units | 7,683 | 54.5% |
| Renter-Occupied Housing Units | 6,419 | 45.5% |
| Total Occupied Housing Units | 14,102 | 100.0% |
Occupancy by Household Size in Azusa
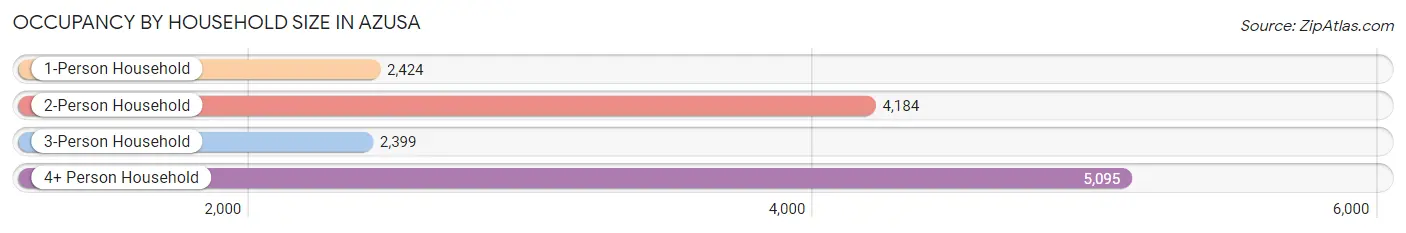
| Household Size | # Housing Units | % Housing Units |
| 1-Person Household | 2,424 | 17.2% |
| 2-Person Household | 4,184 | 29.7% |
| 3-Person Household | 2,399 | 17.0% |
| 4+ Person Household | 5,095 | 36.1% |
| Total Housing Units | 14,102 | 100.0% |
Occupancy by Ownership by Household Size in Azusa
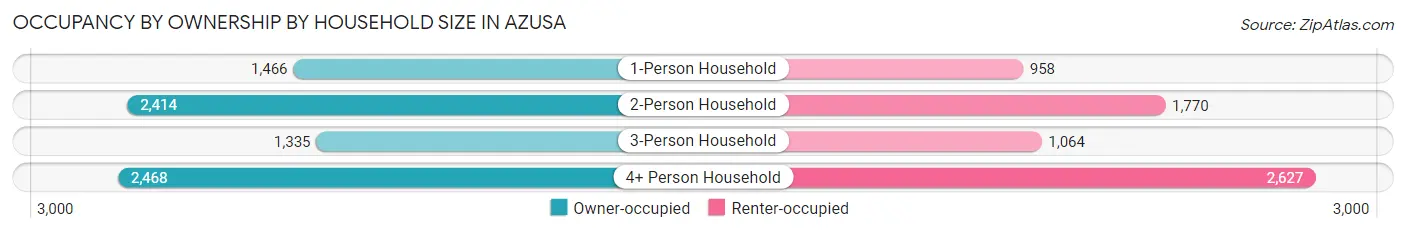
| Household Size | Owner-occupied | Renter-occupied |
| 1-Person Household | 1,466 (60.5%) | 958 (39.5%) |
| 2-Person Household | 2,414 (57.7%) | 1,770 (42.3%) |
| 3-Person Household | 1,335 (55.6%) | 1,064 (44.4%) |
| 4+ Person Household | 2,468 (48.4%) | 2,627 (51.6%) |
| Total Housing Units | 7,683 (54.5%) | 6,419 (45.5%) |
Occupancy by Educational Attainment in Azusa
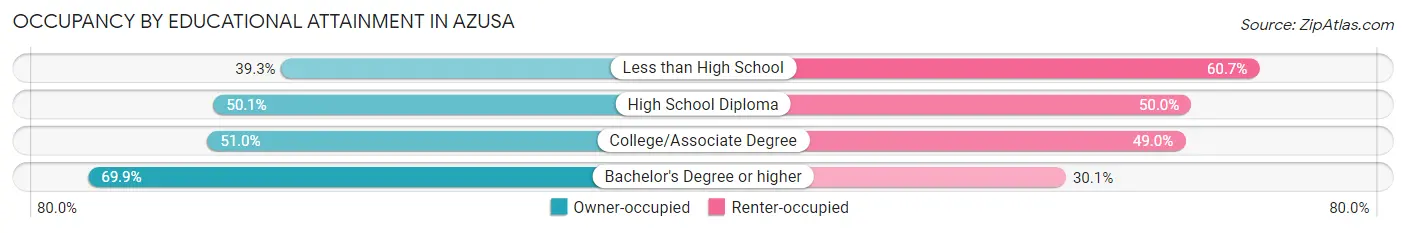
| Household Size | Owner-occupied | Renter-occupied |
| Less than High School | 957 (39.3%) | 1,480 (60.7%) |
| High School Diploma | 1,568 (50.0%) | 1,565 (49.9%) |
| College/Associate Degree | 2,175 (51.0%) | 2,089 (49.0%) |
| Bachelor's Degree or higher | 2,983 (69.9%) | 1,285 (30.1%) |
Occupancy by Age of Householder in Azusa
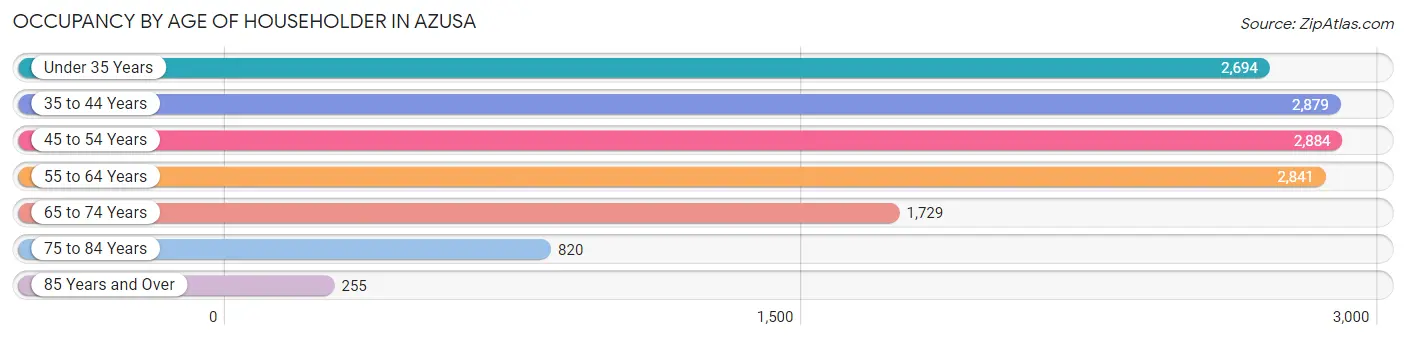
| Age Bracket | # Households | % Households |
| Under 35 Years | 2,694 | 19.1% |
| 35 to 44 Years | 2,879 | 20.4% |
| 45 to 54 Years | 2,884 | 20.4% |
| 55 to 64 Years | 2,841 | 20.2% |
| 65 to 74 Years | 1,729 | 12.3% |
| 75 to 84 Years | 820 | 5.8% |
| 85 Years and Over | 255 | 1.8% |
| Total | 14,102 | 100.0% |
Housing Finances in Azusa
Median Income by Occupancy in Azusa
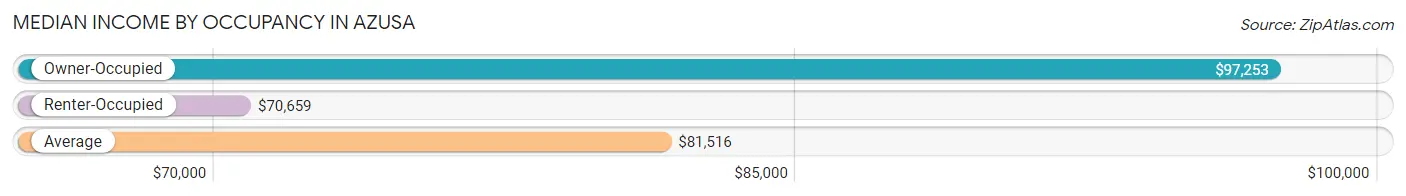
| Occupancy Type | # Households | Median Income |
| Owner-Occupied | 7,683 (54.5%) | $97,253 |
| Renter-Occupied | 6,419 (45.5%) | $70,659 |
| Average | 14,102 (100.0%) | $81,516 |
Occupancy by Householder Income Bracket in Azusa
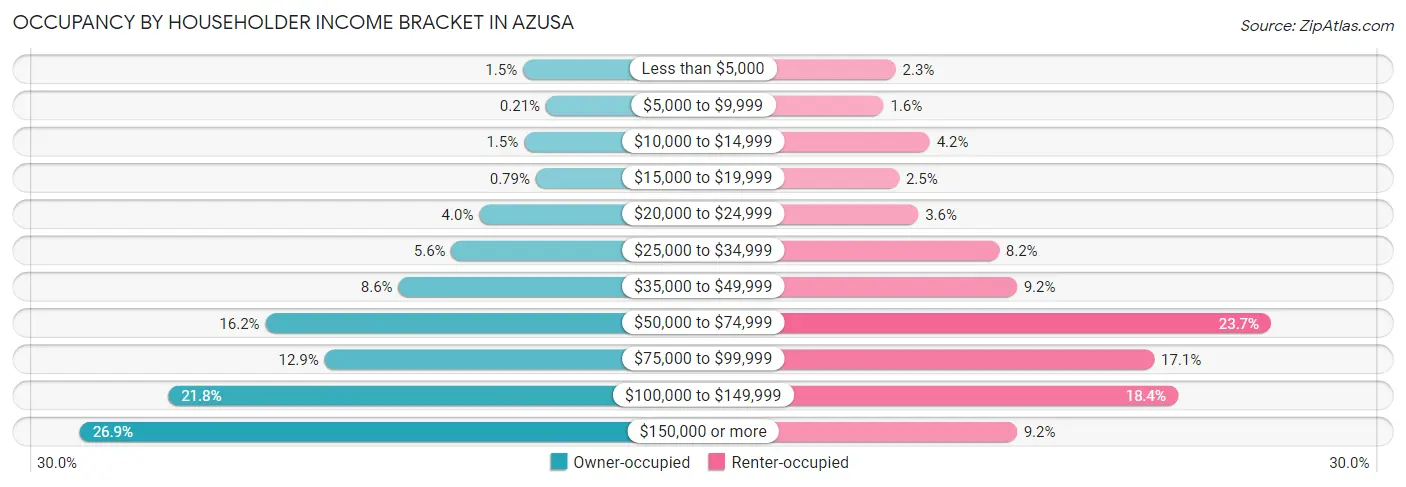
| Income Bracket | Owner-occupied | Renter-occupied |
| Less than $5,000 | 117 (1.5%) | 147 (2.3%) |
| $5,000 to $9,999 | 16 (0.2%) | 103 (1.6%) |
| $10,000 to $14,999 | 112 (1.5%) | 272 (4.2%) |
| $15,000 to $19,999 | 61 (0.8%) | 159 (2.5%) |
| $20,000 to $24,999 | 309 (4.0%) | 230 (3.6%) |
| $25,000 to $34,999 | 431 (5.6%) | 526 (8.2%) |
| $35,000 to $49,999 | 664 (8.6%) | 591 (9.2%) |
| $50,000 to $74,999 | 1,248 (16.2%) | 1,523 (23.7%) |
| $75,000 to $99,999 | 988 (12.9%) | 1,095 (17.1%) |
| $100,000 to $149,999 | 1,674 (21.8%) | 1,182 (18.4%) |
| $150,000 or more | 2,063 (26.9%) | 591 (9.2%) |
| Total | 7,683 (100.0%) | 6,419 (100.0%) |
Monthly Housing Cost Tiers in Azusa
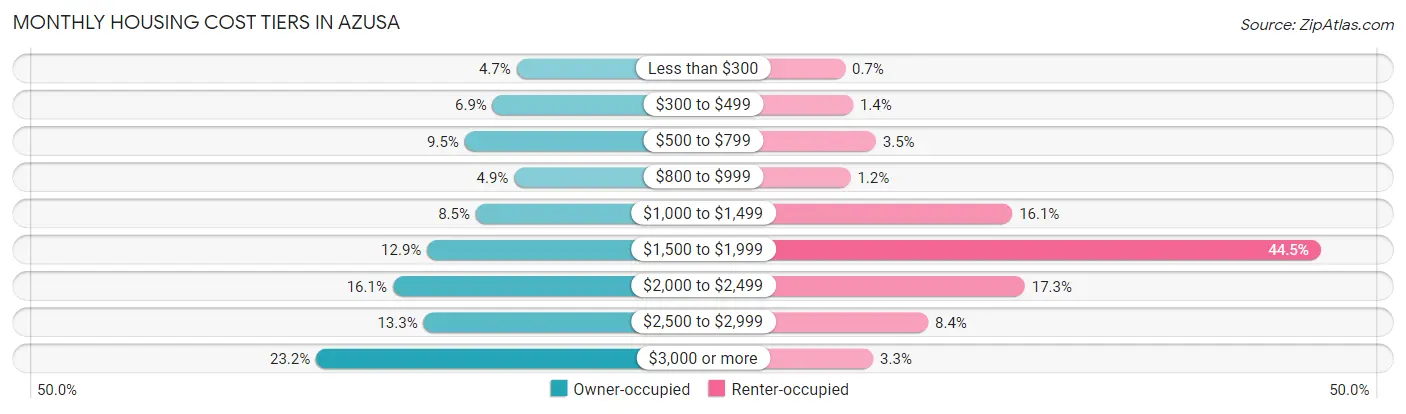
| Monthly Cost | Owner-occupied | Renter-occupied |
| Less than $300 | 362 (4.7%) | 45 (0.7%) |
| $300 to $499 | 531 (6.9%) | 92 (1.4%) |
| $500 to $799 | 729 (9.5%) | 227 (3.5%) |
| $800 to $999 | 379 (4.9%) | 77 (1.2%) |
| $1,000 to $1,499 | 650 (8.5%) | 1,033 (16.1%) |
| $1,500 to $1,999 | 994 (12.9%) | 2,855 (44.5%) |
| $2,000 to $2,499 | 1,238 (16.1%) | 1,107 (17.2%) |
| $2,500 to $2,999 | 1,020 (13.3%) | 536 (8.4%) |
| $3,000 or more | 1,780 (23.2%) | 211 (3.3%) |
| Total | 7,683 (100.0%) | 6,419 (100.0%) |
Physical Housing Characteristics in Azusa
Housing Structures in Azusa
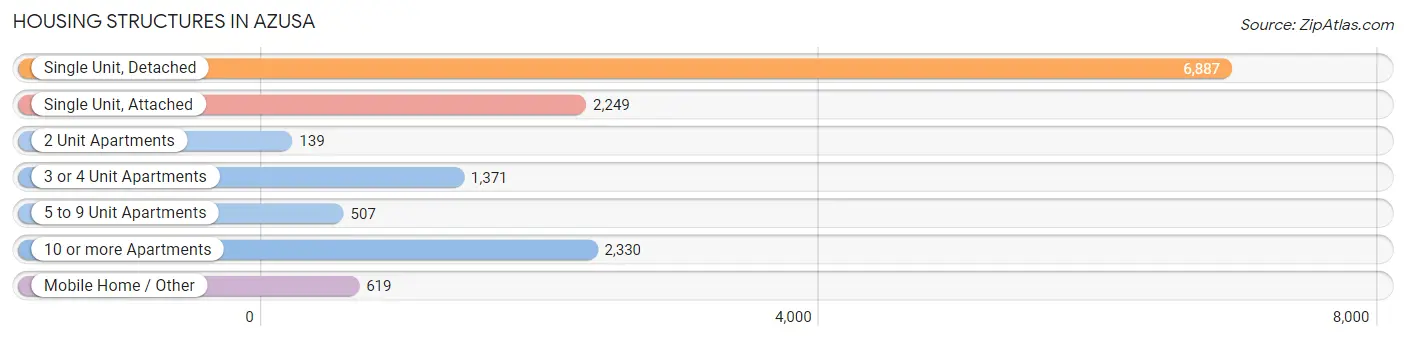
| Structure Type | # Housing Units | % Housing Units |
| Single Unit, Detached | 6,887 | 48.8% |
| Single Unit, Attached | 2,249 | 16.0% |
| 2 Unit Apartments | 139 | 1.0% |
| 3 or 4 Unit Apartments | 1,371 | 9.7% |
| 5 to 9 Unit Apartments | 507 | 3.6% |
| 10 or more Apartments | 2,330 | 16.5% |
| Mobile Home / Other | 619 | 4.4% |
| Total | 14,102 | 100.0% |
Housing Structures by Occupancy in Azusa
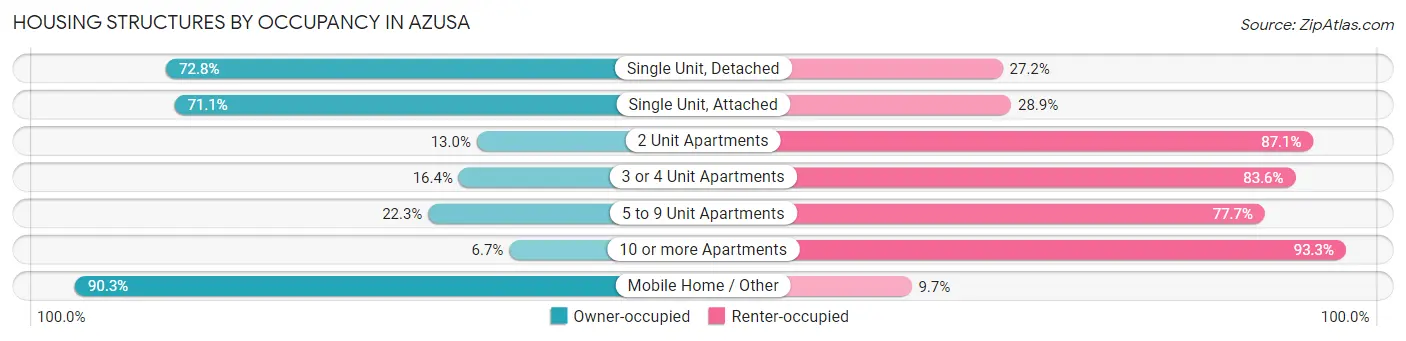
| Structure Type | Owner-occupied | Renter-occupied |
| Single Unit, Detached | 5,012 (72.8%) | 1,875 (27.2%) |
| Single Unit, Attached | 1,600 (71.1%) | 649 (28.9%) |
| 2 Unit Apartments | 18 (13.0%) | 121 (87.1%) |
| 3 or 4 Unit Apartments | 225 (16.4%) | 1,146 (83.6%) |
| 5 to 9 Unit Apartments | 113 (22.3%) | 394 (77.7%) |
| 10 or more Apartments | 156 (6.7%) | 2,174 (93.3%) |
| Mobile Home / Other | 559 (90.3%) | 60 (9.7%) |
| Total | 7,683 (54.5%) | 6,419 (45.5%) |
Housing Structures by Number of Rooms in Azusa
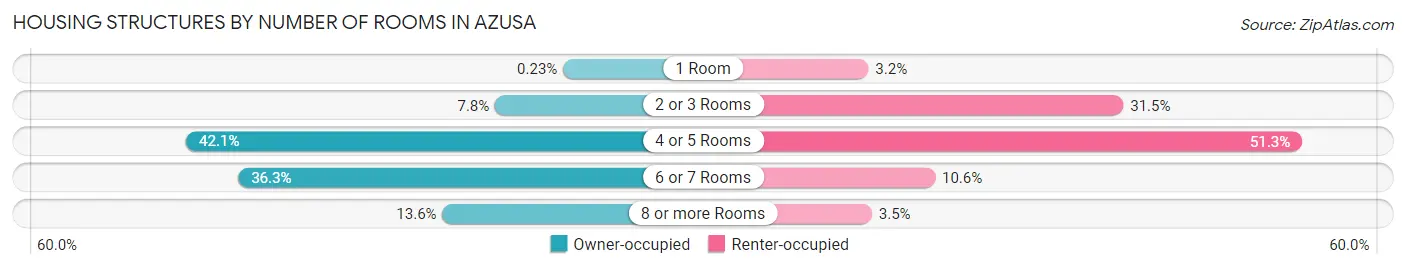
| Number of Rooms | Owner-occupied | Renter-occupied |
| 1 Room | 18 (0.2%) | 203 (3.2%) |
| 2 or 3 Rooms | 598 (7.8%) | 2,019 (31.5%) |
| 4 or 5 Rooms | 3,232 (42.1%) | 3,292 (51.3%) |
| 6 or 7 Rooms | 2,788 (36.3%) | 678 (10.6%) |
| 8 or more Rooms | 1,047 (13.6%) | 227 (3.5%) |
| Total | 7,683 (100.0%) | 6,419 (100.0%) |
Housing Structure by Heating Type in Azusa
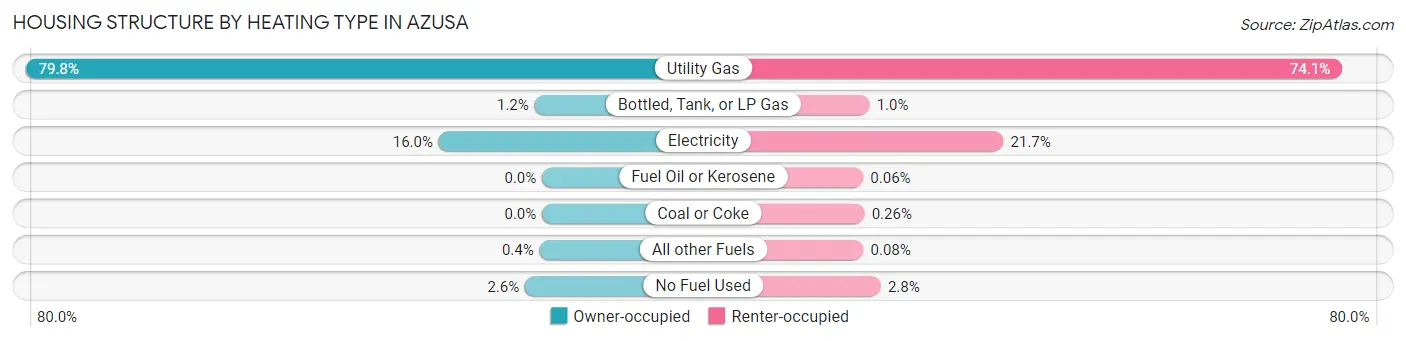
| Heating Type | Owner-occupied | Renter-occupied |
| Utility Gas | 6,134 (79.8%) | 4,754 (74.1%) |
| Bottled, Tank, or LP Gas | 89 (1.2%) | 66 (1.0%) |
| Electricity | 1,227 (16.0%) | 1,395 (21.7%) |
| Fuel Oil or Kerosene | 0 (0.0%) | 4 (0.1%) |
| Coal or Coke | 0 (0.0%) | 17 (0.3%) |
| All other Fuels | 31 (0.4%) | 5 (0.1%) |
| No Fuel Used | 202 (2.6%) | 178 (2.8%) |
| Total | 7,683 (100.0%) | 6,419 (100.0%) |
Household Vehicle Usage in Azusa
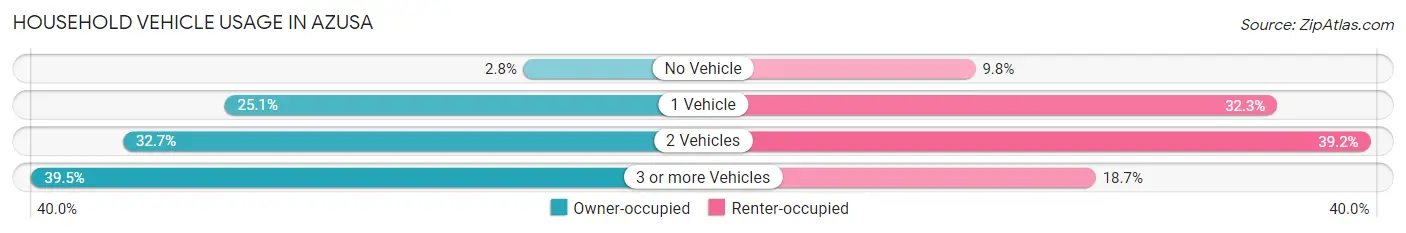
| Vehicles per Household | Owner-occupied | Renter-occupied |
| No Vehicle | 215 (2.8%) | 626 (9.8%) |
| 1 Vehicle | 1,925 (25.1%) | 2,072 (32.3%) |
| 2 Vehicles | 2,509 (32.7%) | 2,519 (39.2%) |
| 3 or more Vehicles | 3,034 (39.5%) | 1,202 (18.7%) |
| Total | 7,683 (100.0%) | 6,419 (100.0%) |
Real Estate & Mortgages in Azusa
Real Estate and Mortgage Overview in Azusa
| Characteristic | Without Mortgage | With Mortgage |
| Housing Units | 2,346 | 5,337 |
| Median Property Value | $514,900 | $598,900 |
| Median Household Income | $64,757 | $1,714 |
| Monthly Housing Costs | $628 | $1,780 |
| Real Estate Taxes | $2,392 | $69 |
Property Value by Mortgage Status in Azusa
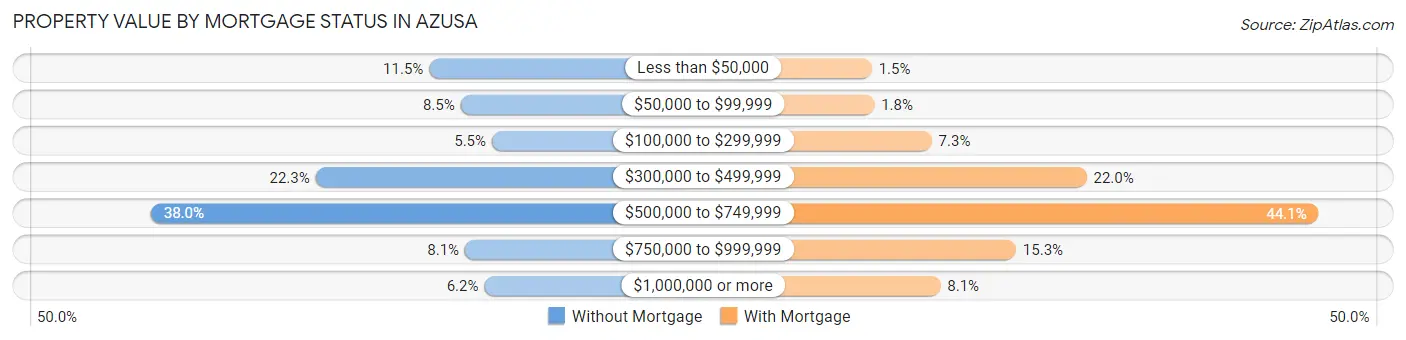
| Property Value | Without Mortgage | With Mortgage |
| Less than $50,000 | 269 (11.5%) | 82 (1.5%) |
| $50,000 to $99,999 | 199 (8.5%) | 95 (1.8%) |
| $100,000 to $299,999 | 129 (5.5%) | 387 (7.2%) |
| $300,000 to $499,999 | 523 (22.3%) | 1,174 (22.0%) |
| $500,000 to $749,999 | 891 (38.0%) | 2,353 (44.1%) |
| $750,000 to $999,999 | 189 (8.1%) | 815 (15.3%) |
| $1,000,000 or more | 146 (6.2%) | 431 (8.1%) |
| Total | 2,346 (100.0%) | 5,337 (100.0%) |
Household Income by Mortgage Status in Azusa
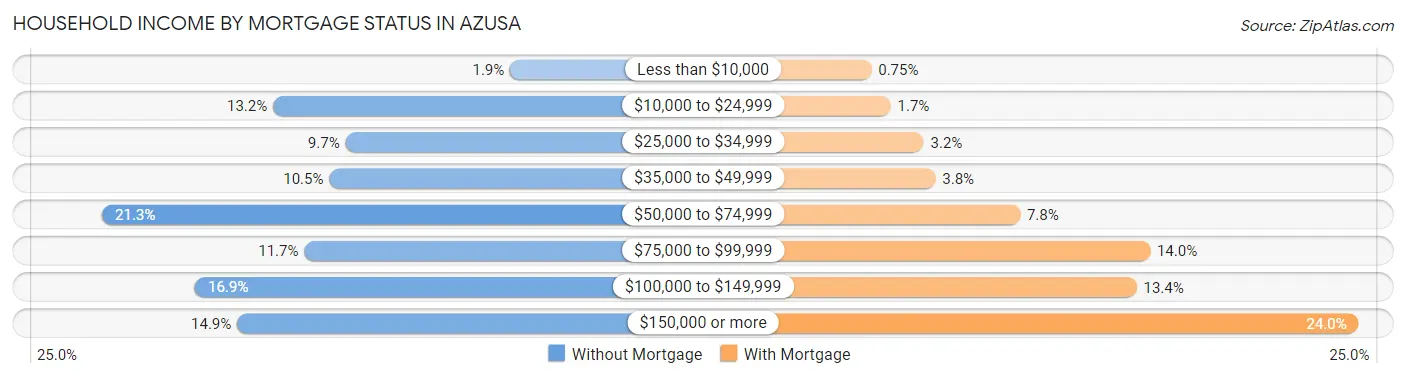
| Household Income | Without Mortgage | With Mortgage |
| Less than $10,000 | 44 (1.9%) | 40 (0.7%) |
| $10,000 to $24,999 | 309 (13.2%) | 89 (1.7%) |
| $25,000 to $34,999 | 228 (9.7%) | 173 (3.2%) |
| $35,000 to $49,999 | 246 (10.5%) | 203 (3.8%) |
| $50,000 to $74,999 | 500 (21.3%) | 418 (7.8%) |
| $75,000 to $99,999 | 274 (11.7%) | 748 (14.0%) |
| $100,000 to $149,999 | 396 (16.9%) | 714 (13.4%) |
| $150,000 or more | 349 (14.9%) | 1,278 (23.9%) |
| Total | 2,346 (100.0%) | 5,337 (100.0%) |
Property Value to Household Income Ratio in Azusa
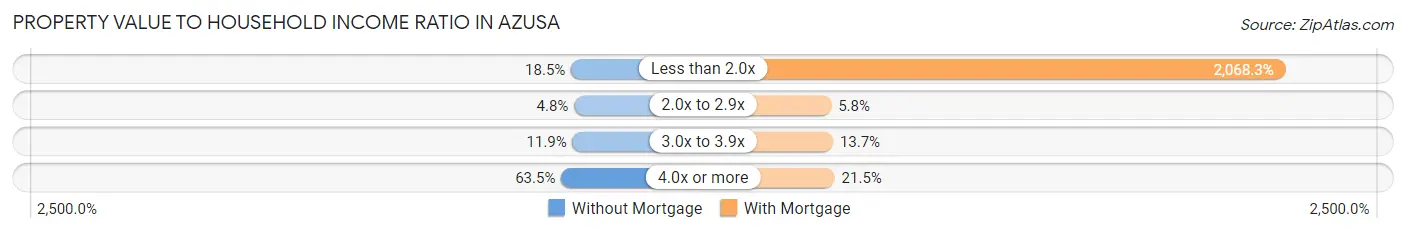
| Value-to-Income Ratio | Without Mortgage | With Mortgage |
| Less than 2.0x | 433 (18.5%) | 110,387 (2,068.3%) |
| 2.0x to 2.9x | 112 (4.8%) | 307 (5.8%) |
| 3.0x to 3.9x | 278 (11.8%) | 732 (13.7%) |
| 4.0x or more | 1,490 (63.5%) | 1,149 (21.5%) |
| Total | 2,346 (100.0%) | 5,337 (100.0%) |
Real Estate Taxes by Mortgage Status in Azusa
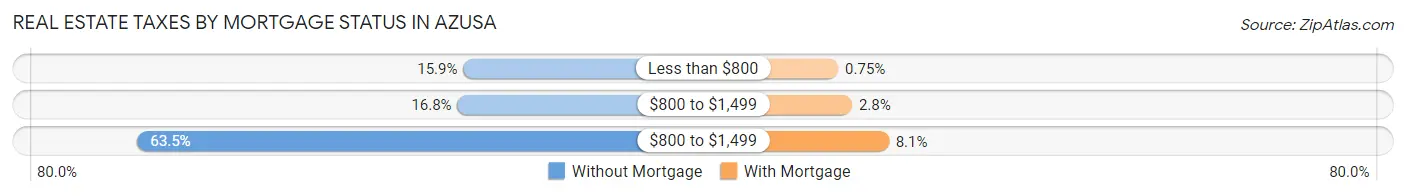
| Property Taxes | Without Mortgage | With Mortgage |
| Less than $800 | 373 (15.9%) | 40 (0.7%) |
| $800 to $1,499 | 393 (16.8%) | 148 (2.8%) |
| $800 to $1,499 | 1,490 (63.5%) | 434 (8.1%) |
| Total | 2,346 (100.0%) | 5,337 (100.0%) |
Health & Disability in Azusa
Health Insurance Coverage by Age in Azusa
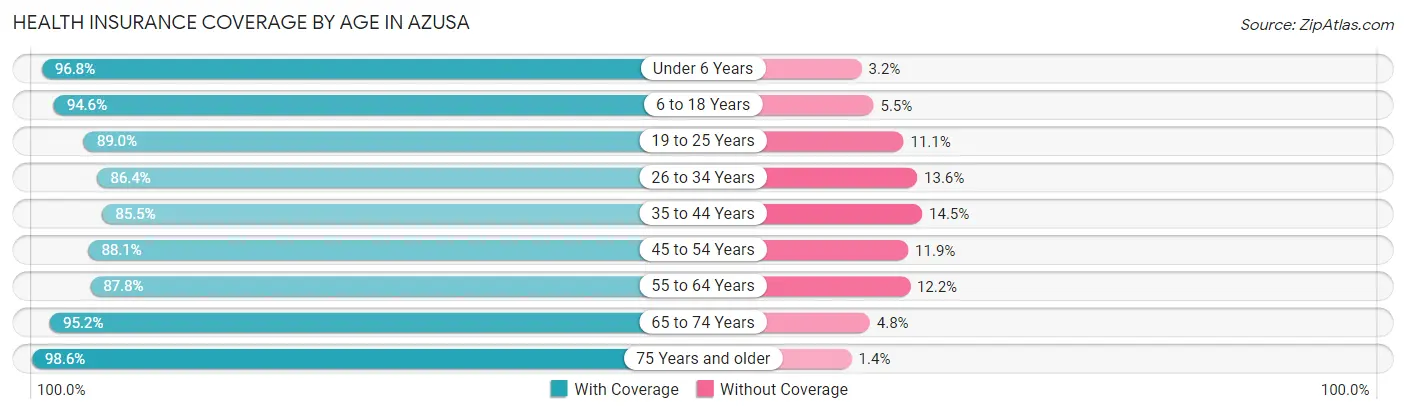
| Age Bracket | With Coverage | Without Coverage |
| Under 6 Years | 3,388 (96.8%) | 113 (3.2%) |
| 6 to 18 Years | 7,406 (94.6%) | 427 (5.4%) |
| 19 to 25 Years | 6,878 (88.9%) | 854 (11.1%) |
| 26 to 34 Years | 6,236 (86.4%) | 980 (13.6%) |
| 35 to 44 Years | 5,780 (85.5%) | 981 (14.5%) |
| 45 to 54 Years | 5,044 (88.1%) | 682 (11.9%) |
| 55 to 64 Years | 4,690 (87.8%) | 654 (12.2%) |
| 65 to 74 Years | 3,219 (95.2%) | 161 (4.8%) |
| 75 Years and older | 2,009 (98.6%) | 28 (1.4%) |
| Total | 44,650 (90.1%) | 4,880 (9.9%) |
Health Insurance Coverage by Citizenship Status in Azusa
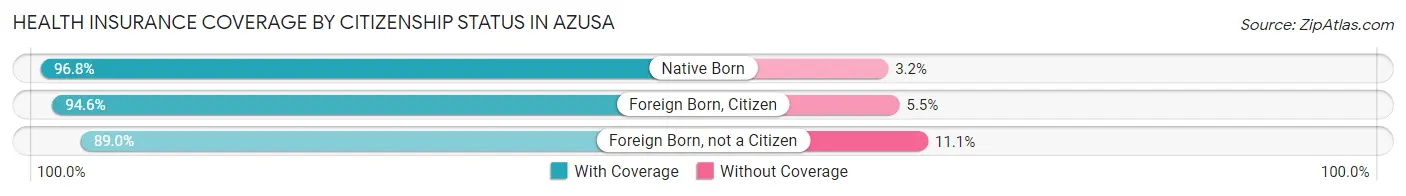
| Citizenship Status | With Coverage | Without Coverage |
| Native Born | 3,388 (96.8%) | 113 (3.2%) |
| Foreign Born, Citizen | 7,406 (94.6%) | 427 (5.4%) |
| Foreign Born, not a Citizen | 6,878 (88.9%) | 854 (11.1%) |
Health Insurance Coverage by Household Income in Azusa
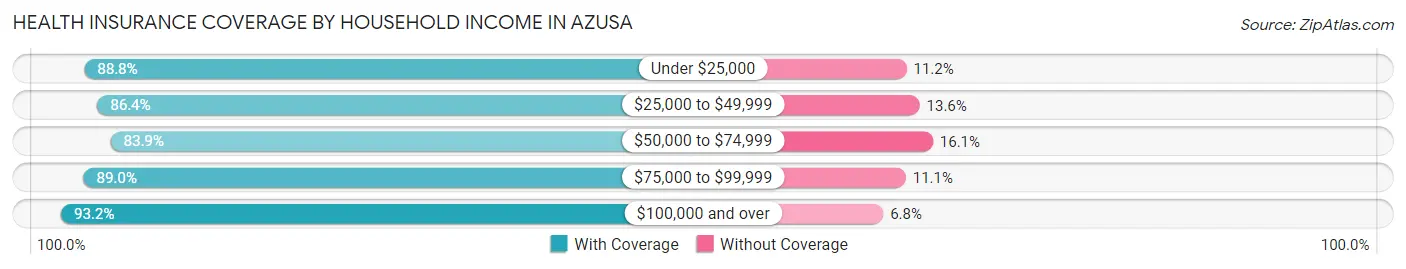
| Household Income | With Coverage | Without Coverage |
| Under $25,000 | 3,162 (88.8%) | 399 (11.2%) |
| $25,000 to $49,999 | 5,155 (86.4%) | 814 (13.6%) |
| $50,000 to $74,999 | 6,959 (83.9%) | 1,337 (16.1%) |
| $75,000 to $99,999 | 6,639 (88.9%) | 825 (11.1%) |
| $100,000 and over | 19,121 (93.2%) | 1,402 (6.8%) |
Public vs Private Health Insurance Coverage by Age in Azusa
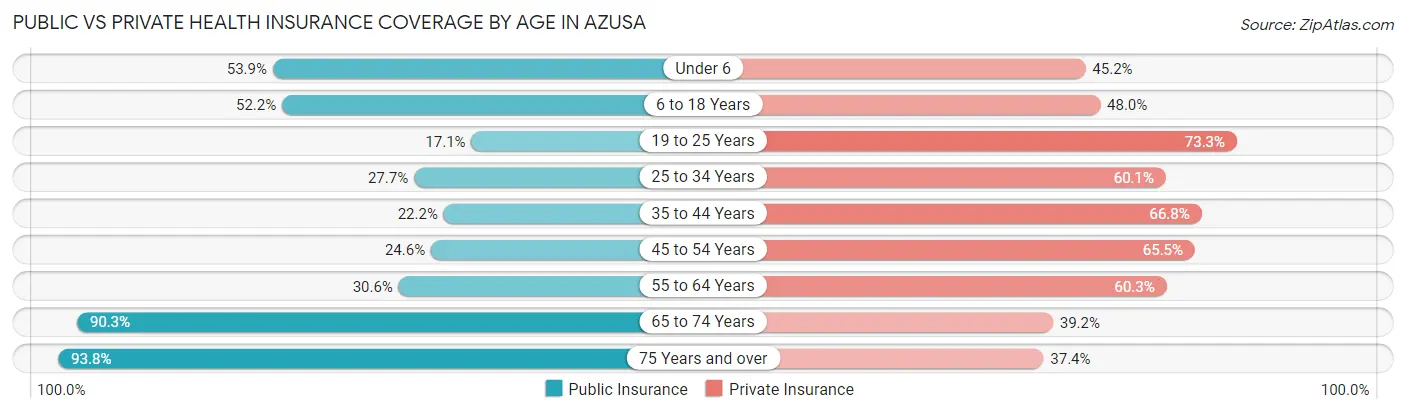
| Age Bracket | Public Insurance | Private Insurance |
| Under 6 | 1,888 (53.9%) | 1,583 (45.2%) |
| 6 to 18 Years | 4,090 (52.2%) | 3,756 (47.9%) |
| 19 to 25 Years | 1,320 (17.1%) | 5,669 (73.3%) |
| 25 to 34 Years | 2,000 (27.7%) | 4,339 (60.1%) |
| 35 to 44 Years | 1,501 (22.2%) | 4,514 (66.8%) |
| 45 to 54 Years | 1,407 (24.6%) | 3,752 (65.5%) |
| 55 to 64 Years | 1,633 (30.6%) | 3,221 (60.3%) |
| 65 to 74 Years | 3,052 (90.3%) | 1,324 (39.2%) |
| 75 Years and over | 1,910 (93.8%) | 762 (37.4%) |
| Total | 18,801 (38.0%) | 28,920 (58.4%) |
Disability Status by Sex by Age in Azusa
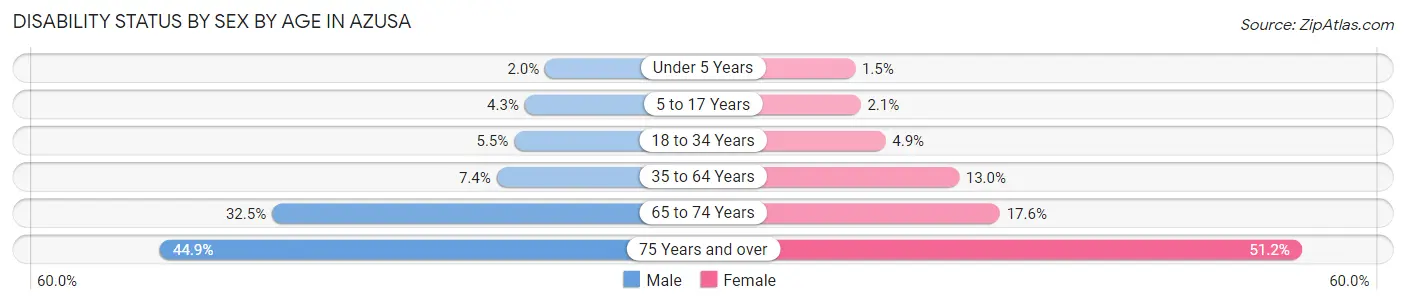
| Age Bracket | Male | Female |
| Under 5 Years | 29 (2.0%) | 20 (1.5%) |
| 5 to 17 Years | 177 (4.3%) | 73 (2.1%) |
| 18 to 34 Years | 437 (5.5%) | 383 (4.9%) |
| 35 to 64 Years | 663 (7.4%) | 1,163 (13.0%) |
| 65 to 74 Years | 490 (32.5%) | 329 (17.6%) |
| 75 Years and over | 357 (44.9%) | 636 (51.2%) |
Disability Class by Sex by Age in Azusa
Disability Class: Hearing Difficulty
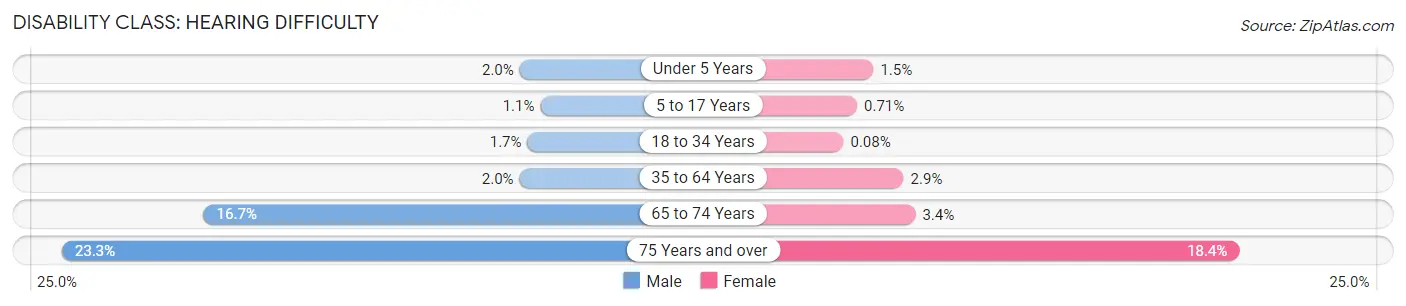
| Age Bracket | Male | Female |
| Under 5 Years | 29 (2.0%) | 20 (1.5%) |
| 5 to 17 Years | 44 (1.1%) | 25 (0.7%) |
| 18 to 34 Years | 133 (1.7%) | 6 (0.1%) |
| 35 to 64 Years | 182 (2.0%) | 256 (2.9%) |
| 65 to 74 Years | 252 (16.7%) | 64 (3.4%) |
| 75 Years and over | 185 (23.3%) | 229 (18.4%) |
Disability Class: Vision Difficulty
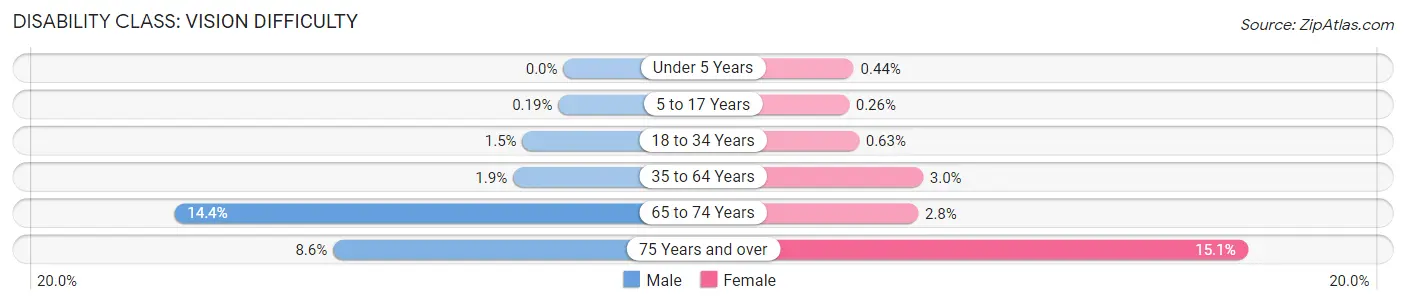
| Age Bracket | Male | Female |
| Under 5 Years | 0 (0.0%) | 6 (0.4%) |
| 5 to 17 Years | 8 (0.2%) | 9 (0.3%) |
| 18 to 34 Years | 121 (1.5%) | 50 (0.6%) |
| 35 to 64 Years | 167 (1.9%) | 269 (3.0%) |
| 65 to 74 Years | 218 (14.4%) | 53 (2.8%) |
| 75 Years and over | 68 (8.6%) | 187 (15.1%) |
Disability Class: Cognitive Difficulty
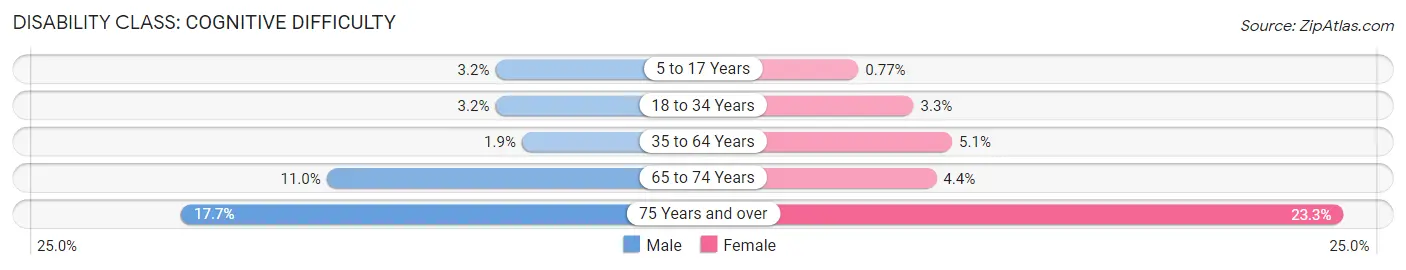
| Age Bracket | Male | Female |
| 5 to 17 Years | 130 (3.2%) | 27 (0.8%) |
| 18 to 34 Years | 252 (3.2%) | 263 (3.3%) |
| 35 to 64 Years | 172 (1.9%) | 457 (5.1%) |
| 65 to 74 Years | 166 (11.0%) | 82 (4.4%) |
| 75 Years and over | 141 (17.7%) | 289 (23.3%) |
Disability Class: Ambulatory Difficulty
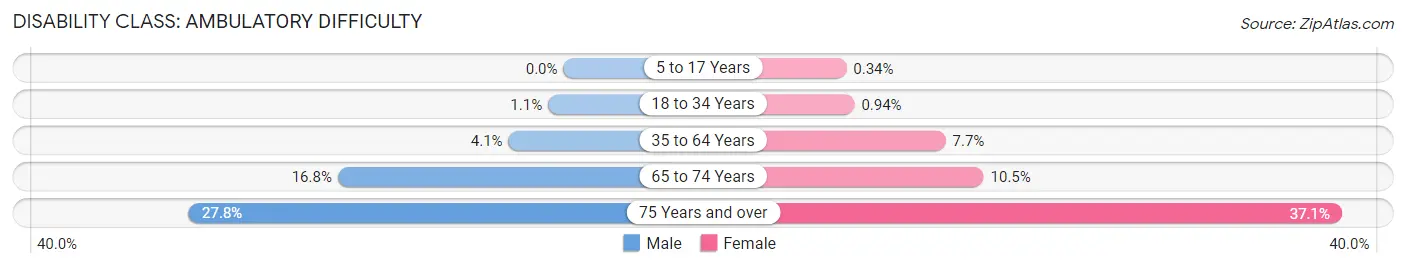
| Age Bracket | Male | Female |
| 5 to 17 Years | 0 (0.0%) | 12 (0.3%) |
| 18 to 34 Years | 91 (1.1%) | 74 (0.9%) |
| 35 to 64 Years | 363 (4.1%) | 688 (7.7%) |
| 65 to 74 Years | 253 (16.8%) | 197 (10.5%) |
| 75 Years and over | 221 (27.8%) | 461 (37.1%) |
Disability Class: Self-Care Difficulty
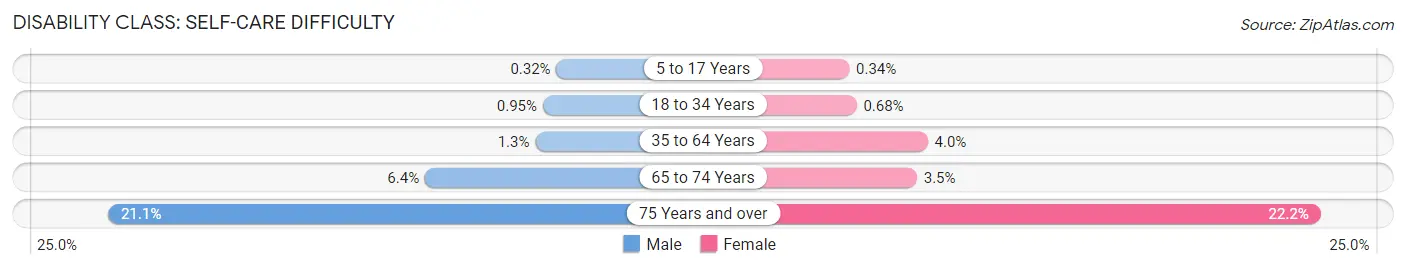
| Age Bracket | Male | Female |
| 5 to 17 Years | 13 (0.3%) | 12 (0.3%) |
| 18 to 34 Years | 76 (0.9%) | 54 (0.7%) |
| 35 to 64 Years | 116 (1.3%) | 355 (4.0%) |
| 65 to 74 Years | 97 (6.4%) | 65 (3.5%) |
| 75 Years and over | 168 (21.1%) | 276 (22.2%) |
Technology Access in Azusa
Computing Device Access in Azusa
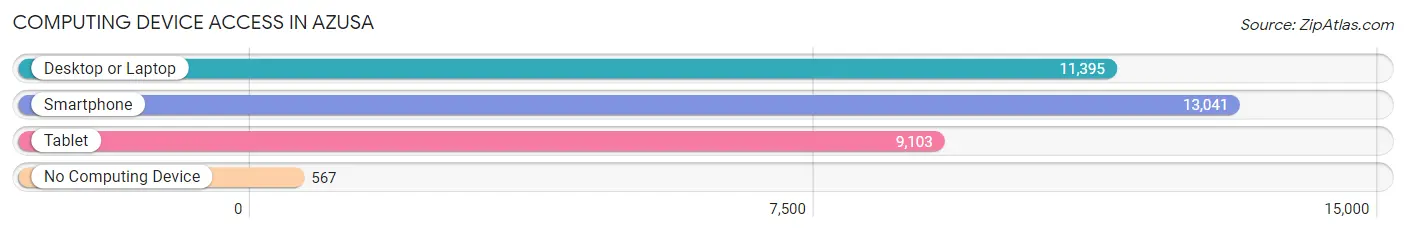
| Device Type | # Households | % Households |
| Desktop or Laptop | 11,395 | 80.8% |
| Smartphone | 13,041 | 92.5% |
| Tablet | 9,103 | 64.5% |
| No Computing Device | 567 | 4.0% |
| Total | 14,102 | 100.0% |
Internet Access in Azusa
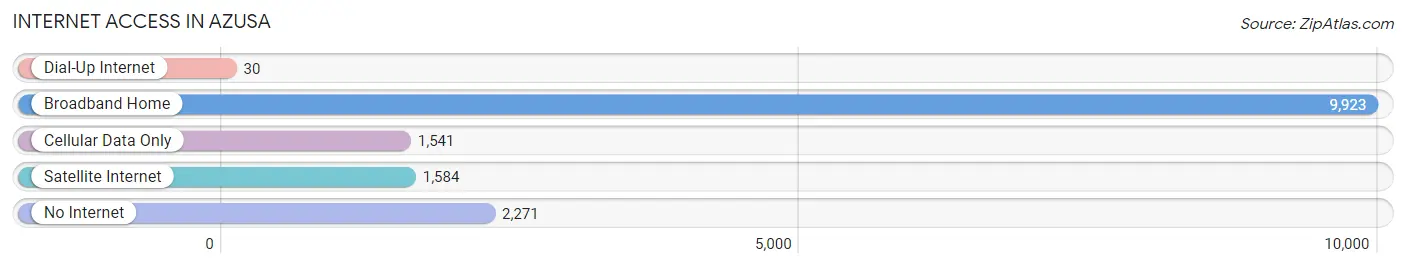
| Internet Type | # Households | % Households |
| Dial-Up Internet | 30 | 0.2% |
| Broadband Home | 9,923 | 70.4% |
| Cellular Data Only | 1,541 | 10.9% |
| Satellite Internet | 1,584 | 11.2% |
| No Internet | 2,271 | 16.1% |
| Total | 14,102 | 100.0% |
Azusa Summary
Azusa, California is a city located in Los Angeles County, California, United States. It is situated at the base of the San Gabriel Mountains in the San Gabriel Valley, about 26 miles (42 km) northeast of downtown Los Angeles. The population was 46,361 at the 2010 census, up from 44,712 at the 2000 census.
History
Azusa was founded in 1887 by the Azusa Land and Water Company, which was formed by a group of investors from Los Angeles. The company purchased the land from the San Gabriel Mission and developed it into a small agricultural community. The city was named after the Azusa River, which was named by the Spanish after the Tongva village of Asuksagna.
The city grew rapidly in the early 20th century, and by the 1920s it had become a major center for citrus production. The city was incorporated in 1910, and by the 1950s it had become a major center for manufacturing and light industry.
Geography
Azusa is located at 34°7′50″N 117°54′25″W (34.130556, -117.906889). According to the United States Census Bureau, the city has a total area of 9.7 square miles (25.1 km2), all of it land.
Economy
Azusa is home to a variety of businesses, including manufacturing, retail, and service industries. The city is also home to several major employers, including Azusa Pacific University, Foothill Transit, and the Azusa Unified School District.
The city is also home to several major shopping centers, including the Azusa Towne Center, the Azusa Plaza Shopping Center, and the Azusa Gateway Shopping Center.
Demographics
As of the 2010 census, there were 46,361 people, 14,842 households, and 10,945 families residing in the city. The population density was 4,742.3 people per square mile (1,831.7/km2). There were 15,845 housing units at an average density of 1,624.2 per square mile (625.7/km2). The racial makeup of the city was 57.2% White, 4.2% African American, 1.2% Native American, 11.2% Asian, 0.2% Pacific Islander, 22.7% from other races, and 3.5% from two or more races. Hispanic or Latino of any race were 44.3% of the population.
The median income for a household in the city was $45,906, and the median income for a family was $51,824. Males had a median income of $37,813 versus $31,919 for females. The per capita income for the city was $19,890. About 11.2% of families and 14.3% of the population were below the poverty line, including 19.2% of those under age 18 and 8.2% of those age 65 or over.
Common Questions
What is Per Capita Income in Azusa?
Per Capita income in Azusa is $30,180.
What is the Median Family Income in Azusa?
Median Family Income in Azusa is $84,556.
What is the Median Household income in Azusa?
Median Household Income in Azusa is $81,516.
What is Income or Wage Gap in Azusa?
Income or Wage Gap in Azusa is 22.0%.
Women in Azusa earn 78.0 cents for every dollar earned by a man.
What is Family Income Deficit in Azusa?
Family Income Deficit in Azusa is $11,582.
Families that are below poverty line in Azusa earn $11,582 less on average than the poverty threshold level.
What is Inequality or Gini Index in Azusa?
Inequality or Gini Index in Azusa is 0.40.
What is the Total Population of Azusa?
Total Population of Azusa is 49,704.
What is the Total Male Population of Azusa?
Total Male Population of Azusa is 24,845.
What is the Total Female Population of Azusa?
Total Female Population of Azusa is 24,859.
What is the Ratio of Males per 100 Females in Azusa?
There are 99.94 Males per 100 Females in Azusa.
What is the Ratio of Females per 100 Males in Azusa?
There are 100.06 Females per 100 Males in Azusa.
What is the Median Population Age in Azusa?
Median Population Age in Azusa is 32.8 Years.
What is the Average Family Size in Azusa
Average Family Size in Azusa is 3.7 People.
What is the Average Household Size in Azusa
Average Household Size in Azusa is 3.2 People.
How Large is the Labor Force in Azusa?
There are 26,618 People in the Labor Forcein in Azusa.
What is the Percentage of People in the Labor Force in Azusa?
66.1% of People are in the Labor Force in Azusa.
What is the Unemployment Rate in Azusa?
Unemployment Rate in Azusa is 6.1%.