Solvang, CA Map & Demographics
Solvang Map
Solvang Overview
$65,211
PER CAPITA INCOME
$130,595
AVG FAMILY INCOME
$108,074
AVG HOUSEHOLD INCOME
28.7%
WAGE / INCOME GAP [ % ]
71.3¢/ $1
WAGE / INCOME GAP [ $ ]
0.45
INEQUALITY / GINI INDEX
6,035
TOTAL POPULATION
2,708
MALE POPULATION
3,327
FEMALE POPULATION
81.39
MALES / 100 FEMALES
122.86
FEMALES / 100 MALES
50.6
MEDIAN AGE
2.9
AVG FAMILY SIZE
2.4
AVG HOUSEHOLD SIZE
3,139
LABOR FORCE [ PEOPLE ]
61.5%
PERCENT IN LABOR FORCE
4.2%
UNEMPLOYMENT RATE
Solvang Zip Codes
Solvang Area Codes
Income in Solvang
Income Overview in Solvang
Per Capita Income in Solvang is $65,211, while median incomes of families and households are $130,595 and $108,074 respectively.
| Characteristic | Number | Measure |
| Per Capita Income | 6,035 | $65,211 |
| Median Family Income | 1,550 | $130,595 |
| Mean Family Income | 1,550 | $180,376 |
| Median Household Income | 2,459 | $108,074 |
| Mean Household Income | 2,459 | $152,856 |
| Income Deficit | 1,550 | $0 |
| Wage / Income Gap (%) | 6,035 | 28.69% |
| Wage / Income Gap ($) | 6,035 | 71.31¢ per $1 |
| Gini / Inequality Index | 6,035 | 0.45 |
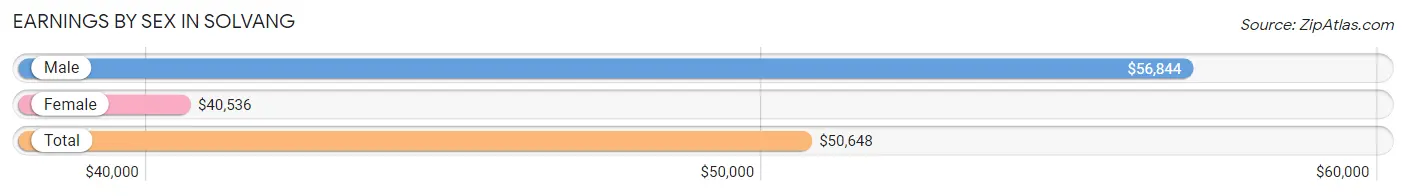
Earnings by Sex in Solvang
Average Earnings in Solvang are $50,648, $56,844 for men and $40,536 for women, a difference of 28.7%.
| Sex | Number | Average Earnings |
| Male | 1,631 (48.5%) | $56,844 |
| Female | 1,734 (51.5%) | $40,536 |
| Total | 3,365 (100.0%) | $50,648 |
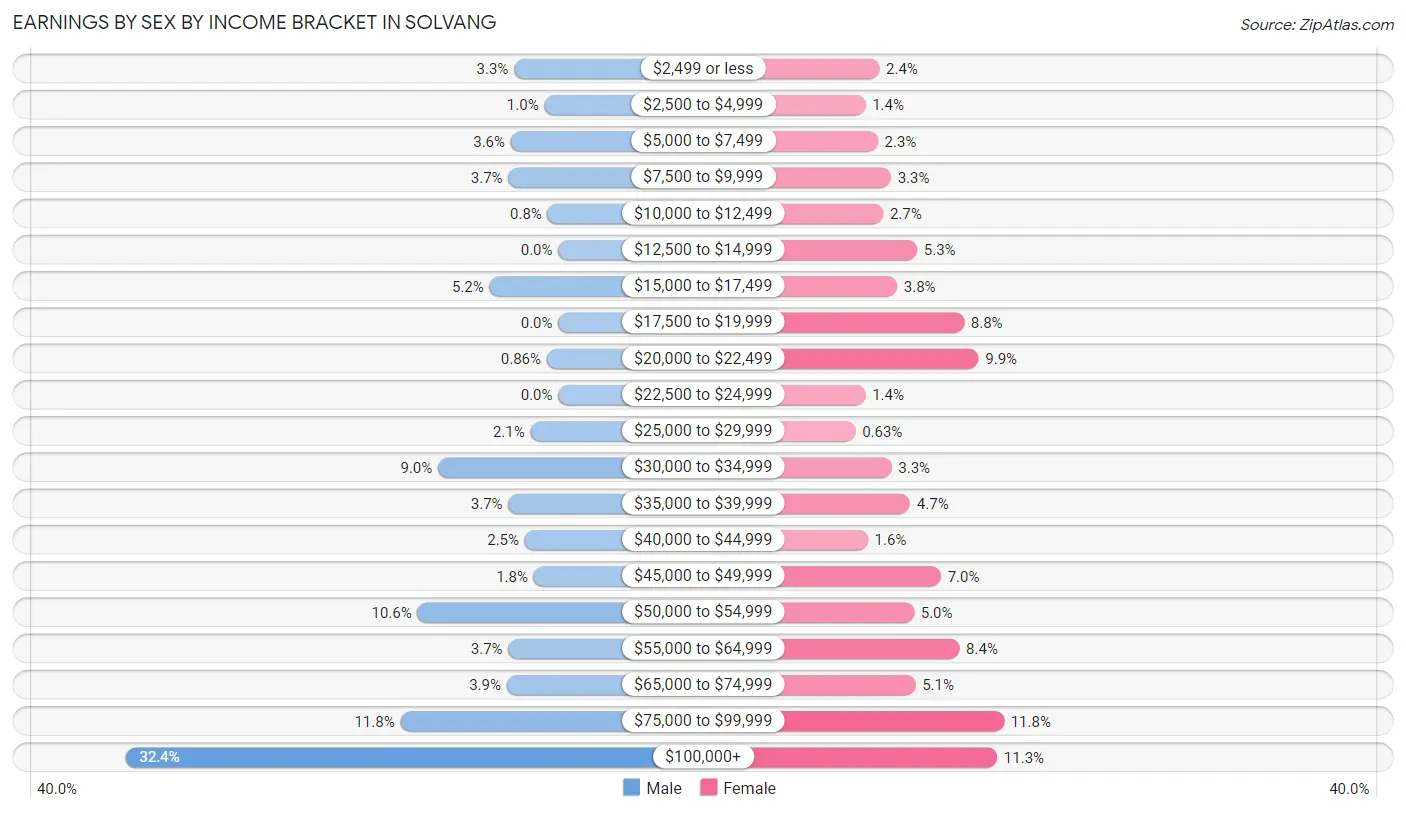
Earnings by Sex by Income Bracket in Solvang
The most common earnings brackets in Solvang are $100,000+ for men (528 | 32.4%) and $75,000 to $99,999 for women (204 | 11.8%).
| Income | Male | Female |
| $2,499 or less | 54 (3.3%) | 42 (2.4%) |
| $2,500 to $4,999 | 17 (1.0%) | 24 (1.4%) |
| $5,000 to $7,499 | 58 (3.6%) | 40 (2.3%) |
| $7,500 to $9,999 | 61 (3.7%) | 57 (3.3%) |
| $10,000 to $12,499 | 13 (0.8%) | 47 (2.7%) |
| $12,500 to $14,999 | 0 (0.0%) | 91 (5.2%) |
| $15,000 to $17,499 | 84 (5.1%) | 65 (3.7%) |
| $17,500 to $19,999 | 0 (0.0%) | 152 (8.8%) |
| $20,000 to $22,499 | 14 (0.9%) | 171 (9.9%) |
| $22,500 to $24,999 | 0 (0.0%) | 24 (1.4%) |
| $25,000 to $29,999 | 34 (2.1%) | 11 (0.6%) |
| $30,000 to $34,999 | 147 (9.0%) | 58 (3.3%) |
| $35,000 to $39,999 | 61 (3.7%) | 82 (4.7%) |
| $40,000 to $44,999 | 41 (2.5%) | 27 (1.6%) |
| $45,000 to $49,999 | 30 (1.8%) | 122 (7.0%) |
| $50,000 to $54,999 | 172 (10.5%) | 87 (5.0%) |
| $55,000 to $64,999 | 61 (3.7%) | 146 (8.4%) |
| $65,000 to $74,999 | 63 (3.9%) | 89 (5.1%) |
| $75,000 to $99,999 | 193 (11.8%) | 204 (11.8%) |
| $100,000+ | 528 (32.4%) | 195 (11.3%) |
| Total | 1,631 (100.0%) | 1,734 (100.0%) |
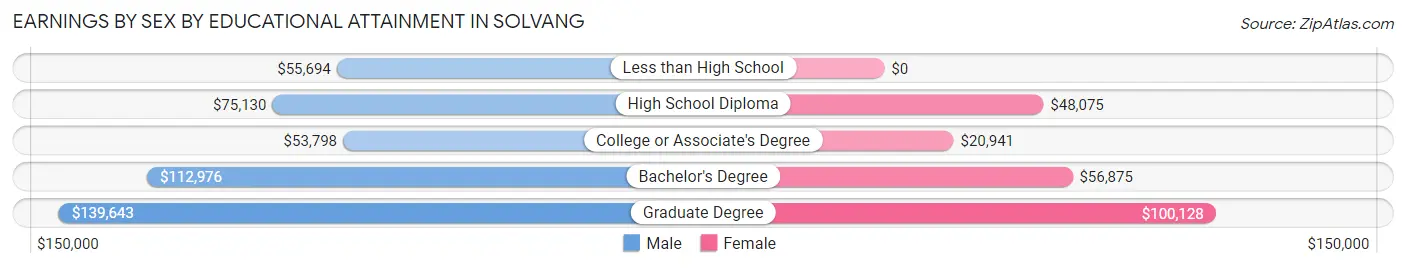
Earnings by Sex by Educational Attainment in Solvang
Average earnings in Solvang are $75,634 for men and $48,570 for women, a difference of 35.8%. Men with an educational attainment of graduate degree enjoy the highest average annual earnings of $139,643, while those with college or associate's degree education earn the least with $53,798. Women with an educational attainment of graduate degree earn the most with the average annual earnings of $100,128, while those with college or associate's degree education have the smallest earnings of $20,941.
| Educational Attainment | Male Income | Female Income |
| Less than High School | $55,694 | $0 |
| High School Diploma | $75,130 | $48,075 |
| College or Associate's Degree | $53,798 | $20,941 |
| Bachelor's Degree | $112,976 | $56,875 |
| Graduate Degree | $139,643 | $100,128 |
| Total | $75,634 | $48,570 |
Family Income in Solvang
Family Income Brackets in Solvang
According to the Solvang family income data, there are 468 families falling into the $200,000+ income range, which is the most common income bracket and makes up 30.2% of all families. Conversely, the less than $10,000 income bracket is the least frequent group with only 16 families (1.0%) belonging to this category.
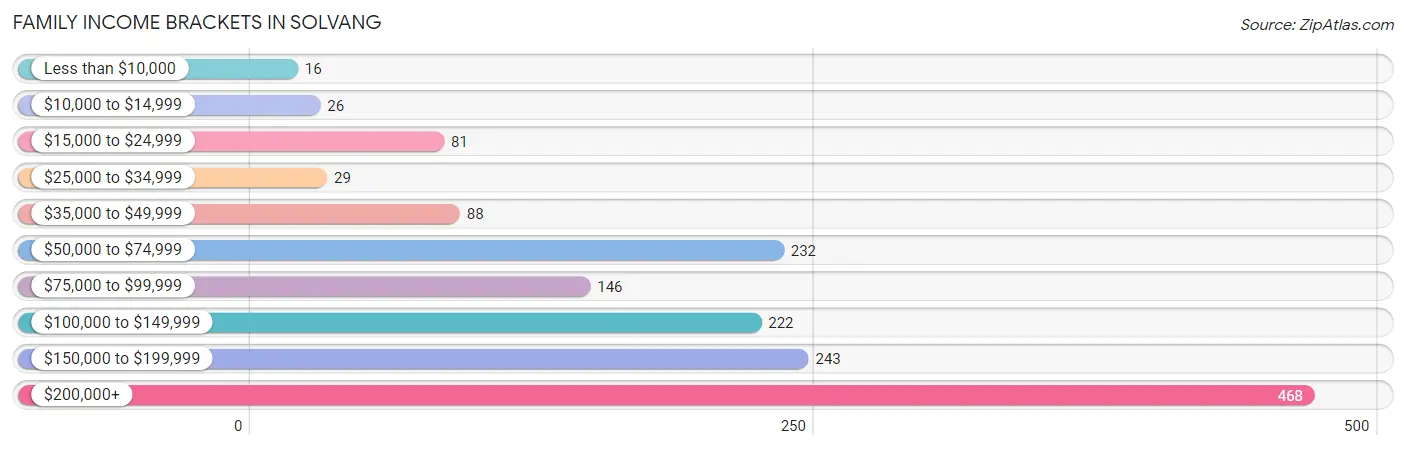
| Income Bracket | # Families | % Families |
| Less than $10,000 | 16 | 1.0% |
| $10,000 to $14,999 | 26 | 1.7% |
| $15,000 to $24,999 | 81 | 5.2% |
| $25,000 to $34,999 | 29 | 1.9% |
| $35,000 to $49,999 | 88 | 5.7% |
| $50,000 to $74,999 | 232 | 15.0% |
| $75,000 to $99,999 | 146 | 9.4% |
| $100,000 to $149,999 | 222 | 14.3% |
| $150,000 to $199,999 | 243 | 15.7% |
| $200,000+ | 468 | 30.2% |
Family Income by Famaliy Size in Solvang
4-person families (235 | 15.2%) account for the highest median family income in Solvang with $212,566 per family, while 3-person families (238 | 15.3%) have the highest median income of $62,333 per family member.

| Income Bracket | # Families | Median Income |
| 2-Person Families | 969 (62.5%) | $108,672 |
| 3-Person Families | 238 (15.3%) | $187,000 |
| 4-Person Families | 235 (15.2%) | $212,566 |
| 5-Person Families | 65 (4.2%) | $121,473 |
| 6-Person Families | 43 (2.8%) | $0 |
| 7+ Person Families | 0 (0.0%) | $0 |
| Total | 1,550 (100.0%) | $130,595 |
Family Income by Number of Earners in Solvang
The median family income in Solvang is $130,595, with families comprising 3+ earners (151) having the highest median family income of $214,539, while families with no earners (389) have the lowest median family income of $65,347, accounting for 9.7% and 25.1% of families, respectively.
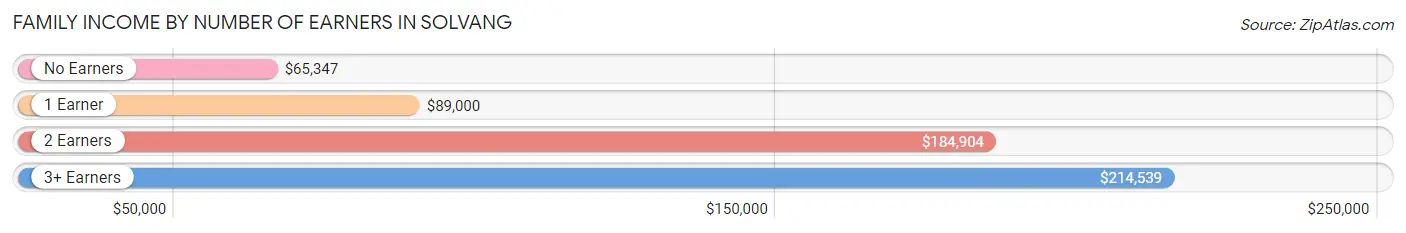
| Number of Earners | # Families | Median Income |
| No Earners | 389 (25.1%) | $65,347 |
| 1 Earner | 512 (33.0%) | $89,000 |
| 2 Earners | 498 (32.1%) | $184,904 |
| 3+ Earners | 151 (9.7%) | $214,539 |
| Total | 1,550 (100.0%) | $130,595 |
Household Income in Solvang
Household Income Brackets in Solvang
With 605 households falling in the category, the $200,000+ income range is the most frequent in Solvang, accounting for 24.6% of all households. In contrast, only 47 households (1.9%) fall into the less than $10,000 income bracket, making it the least populous group.
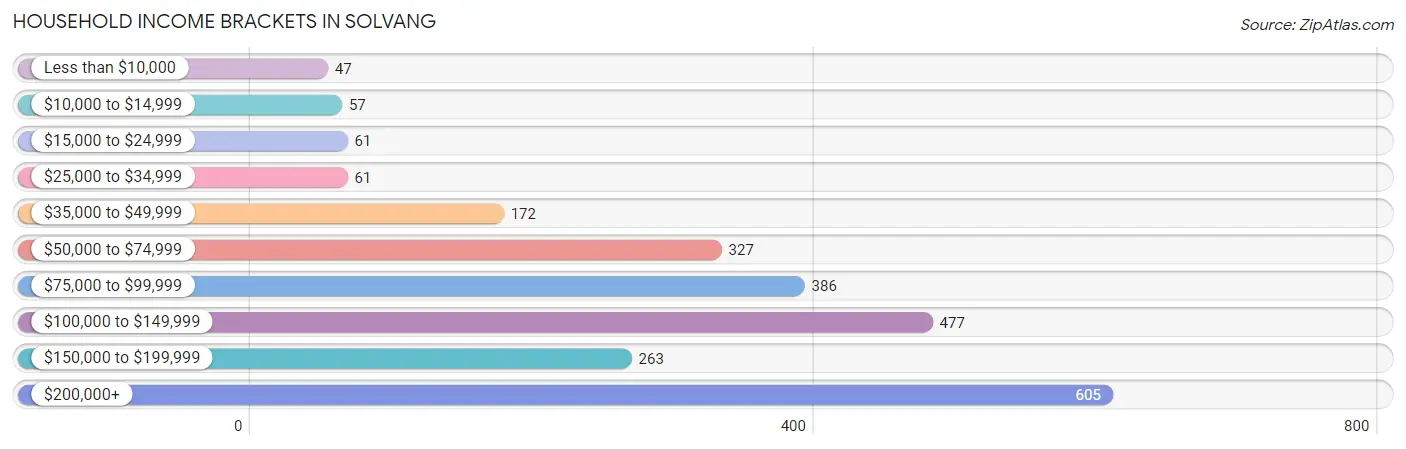
| Income Bracket | # Households | % Households |
| Less than $10,000 | 47 | 1.9% |
| $10,000 to $14,999 | 57 | 2.3% |
| $15,000 to $24,999 | 61 | 2.5% |
| $25,000 to $34,999 | 61 | 2.5% |
| $35,000 to $49,999 | 172 | 7.0% |
| $50,000 to $74,999 | 327 | 13.3% |
| $75,000 to $99,999 | 386 | 15.7% |
| $100,000 to $149,999 | 477 | 19.4% |
| $150,000 to $199,999 | 263 | 10.7% |
| $200,000+ | 605 | 24.6% |
Household Income by Householder Age in Solvang
The median household income in Solvang is $108,074, with the highest median household income of $183,654 found in the 45 to 64 years age bracket for the primary householder. A total of 814 households (33.1%) fall into this category. Meanwhile, the 15 to 24 years age bracket for the primary householder has the lowest median household income of $0, with 14 households (0.6%) in this group.
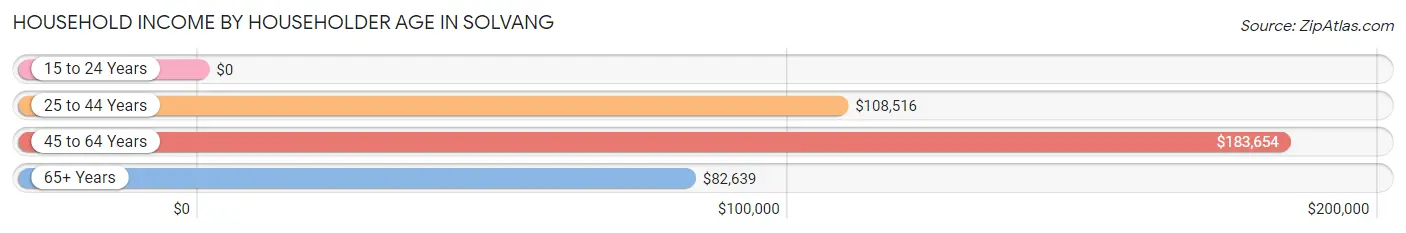
| Income Bracket | # Households | Median Income |
| 15 to 24 Years | 14 (0.6%) | $0 |
| 25 to 44 Years | 469 (19.1%) | $108,516 |
| 45 to 64 Years | 814 (33.1%) | $183,654 |
| 65+ Years | 1,162 (47.2%) | $82,639 |
| Total | 2,459 (100.0%) | $108,074 |
Poverty in Solvang
Income Below Poverty by Sex and Age in Solvang
With 7.9% poverty level for males and 6.7% for females among the residents of Solvang, under 5 year old males and 18 to 24 year old females are the most vulnerable to poverty, with 45 males (51.1%) and 27 females (17.9%) in their respective age groups living below the poverty level.
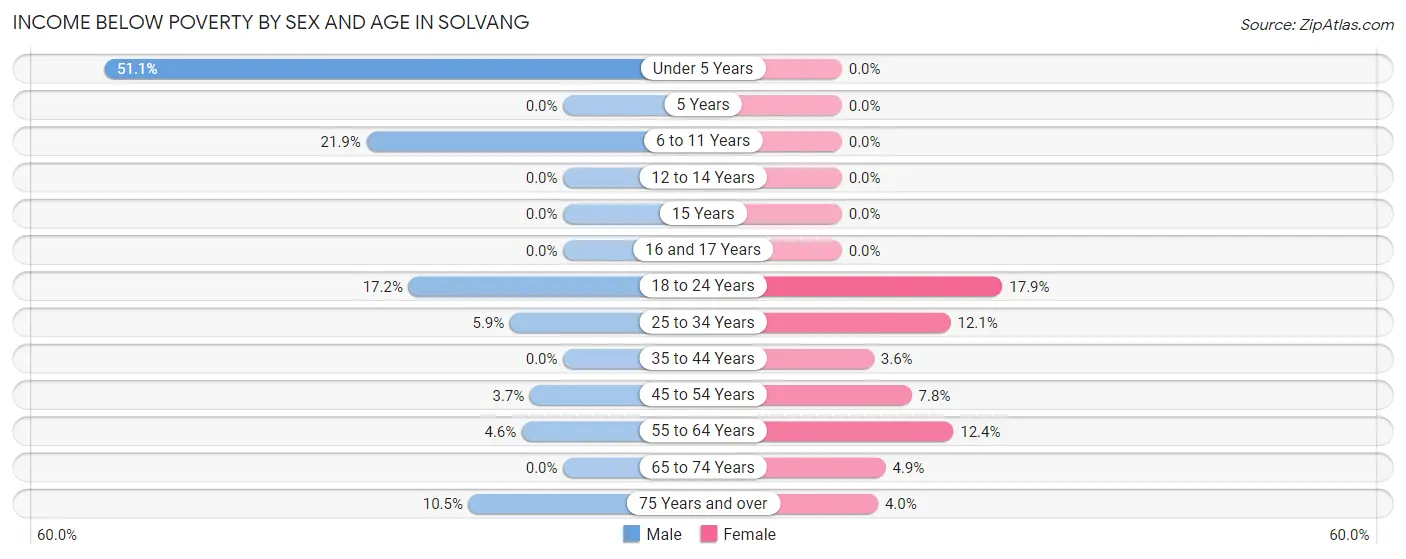
| Age Bracket | Male | Female |
| Under 5 Years | 45 (51.1%) | 0 (0.0%) |
| 5 Years | 0 (0.0%) | 0 (0.0%) |
| 6 to 11 Years | 39 (21.9%) | 0 (0.0%) |
| 12 to 14 Years | 0 (0.0%) | 0 (0.0%) |
| 15 Years | 0 (0.0%) | 0 (0.0%) |
| 16 and 17 Years | 0 (0.0%) | 0 (0.0%) |
| 18 to 24 Years | 52 (17.2%) | 27 (17.9%) |
| 25 to 34 Years | 15 (5.9%) | 35 (12.1%) |
| 35 to 44 Years | 0 (0.0%) | 12 (3.6%) |
| 45 to 54 Years | 12 (3.7%) | 34 (7.8%) |
| 55 to 64 Years | 18 (4.6%) | 58 (12.4%) |
| 65 to 74 Years | 0 (0.0%) | 31 (4.9%) |
| 75 Years and over | 30 (10.5%) | 18 (4.0%) |
| Total | 211 (7.9%) | 215 (6.7%) |
Income Above Poverty by Sex and Age in Solvang
According to the poverty statistics in Solvang, males aged 12 to 14 years and females aged under 5 years are the age groups that are most secure financially, with 100.0% of males and 100.0% of females in these age groups living above the poverty line.
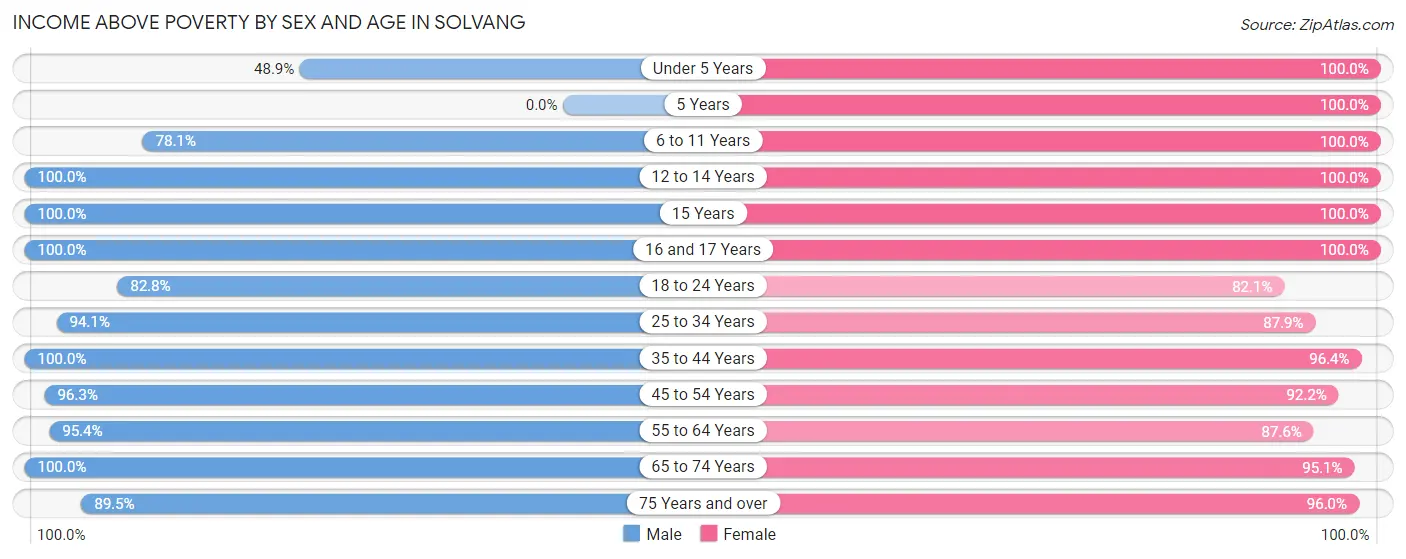
| Age Bracket | Male | Female |
| Under 5 Years | 43 (48.9%) | 32 (100.0%) |
| 5 Years | 0 (0.0%) | 20 (100.0%) |
| 6 to 11 Years | 139 (78.1%) | 274 (100.0%) |
| 12 to 14 Years | 60 (100.0%) | 87 (100.0%) |
| 15 Years | 105 (100.0%) | 27 (100.0%) |
| 16 and 17 Years | 54 (100.0%) | 30 (100.0%) |
| 18 to 24 Years | 250 (82.8%) | 124 (82.1%) |
| 25 to 34 Years | 238 (94.1%) | 254 (87.9%) |
| 35 to 44 Years | 244 (100.0%) | 324 (96.4%) |
| 45 to 54 Years | 312 (96.3%) | 403 (92.2%) |
| 55 to 64 Years | 374 (95.4%) | 409 (87.6%) |
| 65 to 74 Years | 397 (100.0%) | 605 (95.1%) |
| 75 Years and over | 255 (89.5%) | 429 (96.0%) |
| Total | 2,471 (92.1%) | 3,018 (93.3%) |
Income Below Poverty Among Married-Couple Families in Solvang
The poverty statistics for married-couple families in Solvang show that 3.5% or 42 of the total 1,196 families live below the poverty line. Families with no children have the highest poverty rate of 4.4%, comprising of 42 families. On the other hand, families with 1 or 2 children have the lowest poverty rate of 0.0%, which includes 0 families.
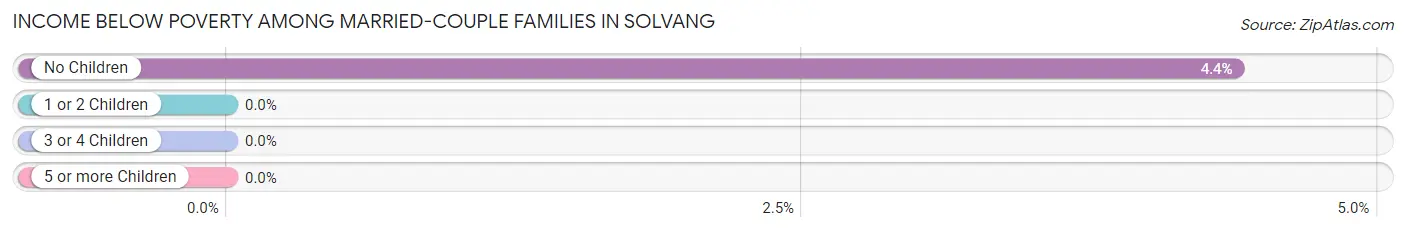
| Children | Above Poverty | Below Poverty |
| No Children | 917 (95.6%) | 42 (4.4%) |
| 1 or 2 Children | 197 (100.0%) | 0 (0.0%) |
| 3 or 4 Children | 40 (100.0%) | 0 (0.0%) |
| 5 or more Children | 0 (0.0%) | 0 (0.0%) |
| Total | 1,154 (96.5%) | 42 (3.5%) |
Income Below Poverty Among Single-Parent Households in Solvang
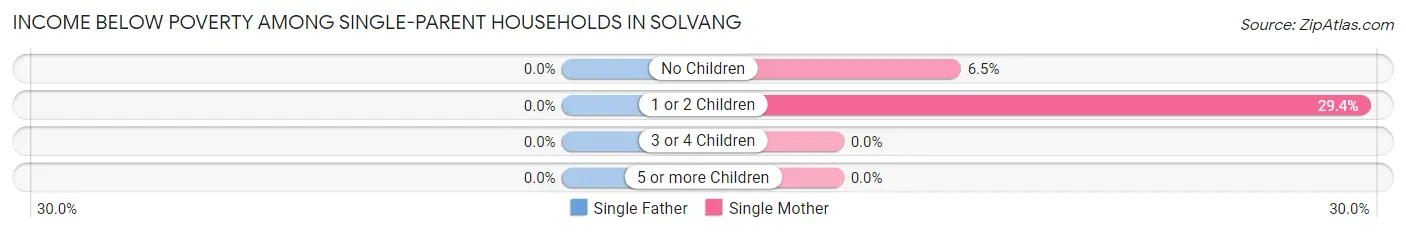
| Children | Single Father | Single Mother |
| No Children | 0 (0.0%) | 10 (6.5%) |
| 1 or 2 Children | 0 (0.0%) | 35 (29.4%) |
| 3 or 4 Children | 0 (0.0%) | 0 (0.0%) |
| 5 or more Children | 0 (0.0%) | 0 (0.0%) |
| Total | 0 (0.0%) | 45 (15.9%) |
Income Below Poverty Among Married-Couple vs Single-Parent Households in Solvang
The poverty data for Solvang shows that 42 of the married-couple family households (3.5%) and 45 of the single-parent households (12.7%) are living below the poverty level. Within the married-couple family households, those with no children have the highest poverty rate, with 42 households (4.4%) falling below the poverty line. Among the single-parent households, those with 1 or 2 children have the highest poverty rate, with 35 household (20.1%) living below poverty.
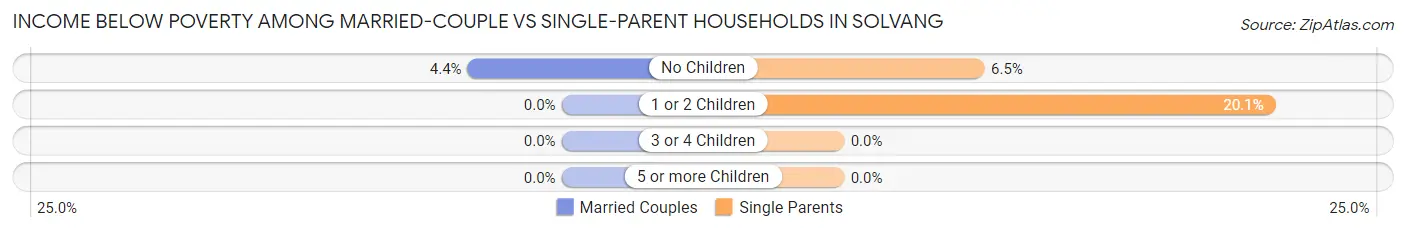
| Children | Married-Couple Families | Single-Parent Households |
| No Children | 42 (4.4%) | 10 (6.5%) |
| 1 or 2 Children | 0 (0.0%) | 35 (20.1%) |
| 3 or 4 Children | 0 (0.0%) | 0 (0.0%) |
| 5 or more Children | 0 (0.0%) | 0 (0.0%) |
| Total | 42 (3.5%) | 45 (12.7%) |
Race in Solvang
The most populous races in Solvang are White / Caucasian (4,404 | 73.0%), Hispanic or Latino (1,621 | 26.9%), and Two or more Races (798 | 13.2%).
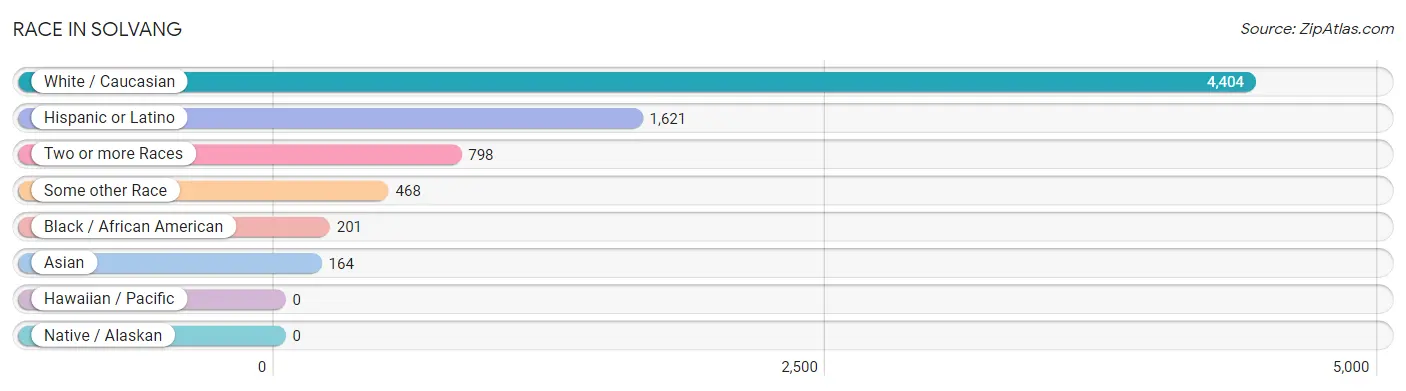
| Race | # Population | % Population |
| Asian | 164 | 2.7% |
| Black / African American | 201 | 3.3% |
| Hawaiian / Pacific | 0 | 0.0% |
| Hispanic or Latino | 1,621 | 26.9% |
| Native / Alaskan | 0 | 0.0% |
| White / Caucasian | 4,404 | 73.0% |
| Two or more Races | 798 | 13.2% |
| Some other Race | 468 | 7.7% |
| Total | 6,035 | 100.0% |
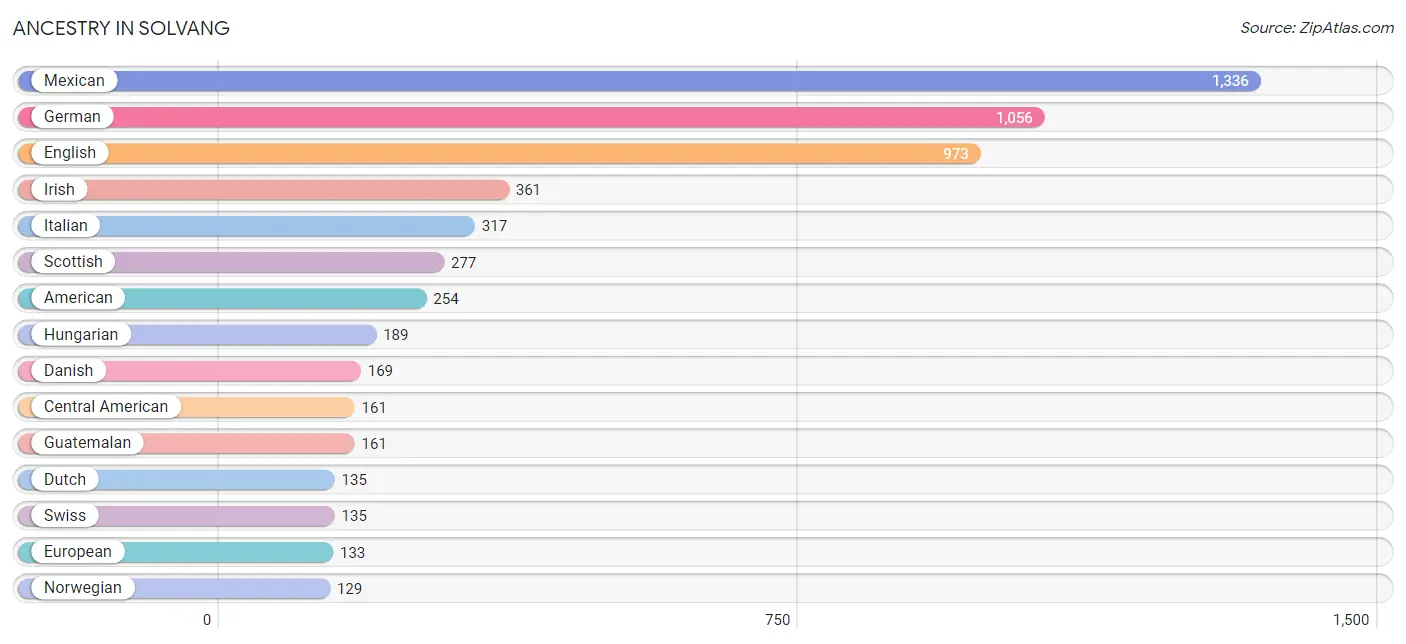
Ancestry in Solvang
The most populous ancestries reported in Solvang are Mexican (1,336 | 22.1%), German (1,056 | 17.5%), English (973 | 16.1%), Irish (361 | 6.0%), and Italian (317 | 5.2%), together accounting for 67.0% of all Solvang residents.
| Ancestry | # Population | % Population |
| American | 254 | 4.2% |
| Arab | 119 | 2.0% |
| Argentinean | 21 | 0.4% |
| Australian | 9 | 0.2% |
| Austrian | 62 | 1.0% |
| Belgian | 16 | 0.3% |
| Bhutanese | 33 | 0.5% |
| British | 66 | 1.1% |
| Canadian | 99 | 1.6% |
| Central American | 161 | 2.7% |
| Chippewa | 16 | 0.3% |
| Croatian | 4 | 0.1% |
| Danish | 169 | 2.8% |
| Dutch | 135 | 2.2% |
| Eastern European | 65 | 1.1% |
| English | 973 | 16.1% |
| European | 133 | 2.2% |
| French | 117 | 1.9% |
| French Canadian | 10 | 0.2% |
| German | 1,056 | 17.5% |
| Greek | 4 | 0.1% |
| Guatemalan | 161 | 2.7% |
| Hungarian | 189 | 3.1% |
| Indian (Asian) | 69 | 1.1% |
| Irish | 361 | 6.0% |
| Italian | 317 | 5.2% |
| Korean | 127 | 2.1% |
| Lithuanian | 3 | 0.1% |
| Malaysian | 12 | 0.2% |
| Mexican | 1,336 | 22.1% |
| Native Hawaiian | 43 | 0.7% |
| Northern European | 97 | 1.6% |
| Norwegian | 129 | 2.1% |
| Pakistani | 12 | 0.2% |
| Polish | 122 | 2.0% |
| Portuguese | 55 | 0.9% |
| Puerto Rican | 25 | 0.4% |
| Russian | 2 | 0.0% |
| Scandinavian | 9 | 0.2% |
| Scotch-Irish | 52 | 0.9% |
| Scottish | 277 | 4.6% |
| Slavic | 12 | 0.2% |
| South American | 50 | 0.8% |
| Spaniard | 23 | 0.4% |
| Spanish | 7 | 0.1% |
| Sri Lankan | 53 | 0.9% |
| Swedish | 29 | 0.5% |
| Swiss | 135 | 2.2% |
| Syrian | 98 | 1.6% |
| Thai | 13 | 0.2% |
| Turkish | 17 | 0.3% |
| Ukrainian | 26 | 0.4% |
| Venezuelan | 29 | 0.5% |
| Yugoslavian | 19 | 0.3% | View All 54 Rows |
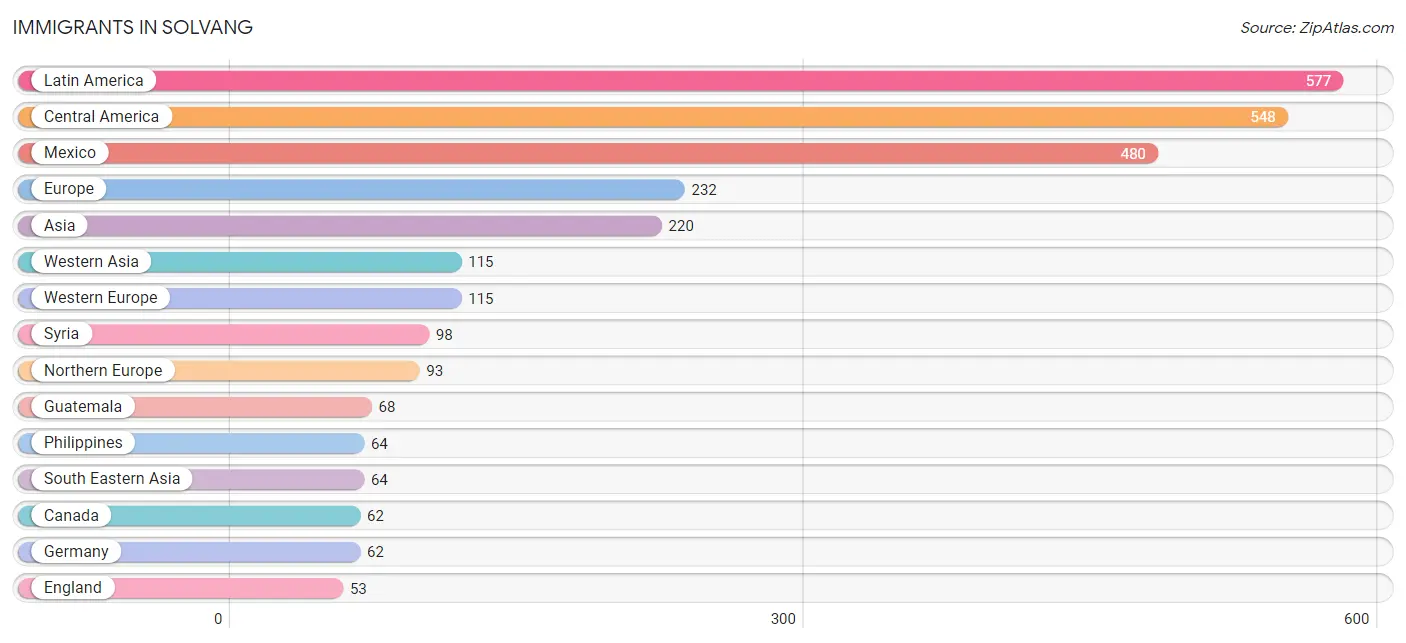
Immigrants in Solvang
The most numerous immigrant groups reported in Solvang came from Latin America (577 | 9.6%), Central America (548 | 9.1%), Mexico (480 | 8.0%), Europe (232 | 3.8%), and Asia (220 | 3.6%), together accounting for 34.1% of all Solvang residents.
| Immigration Origin | # Population | % Population |
| Africa | 16 | 0.3% |
| Asia | 220 | 3.6% |
| Australia | 5 | 0.1% |
| Austria | 25 | 0.4% |
| Belgium | 16 | 0.3% |
| Canada | 62 | 1.0% |
| Central America | 548 | 9.1% |
| China | 31 | 0.5% |
| Denmark | 14 | 0.2% |
| Eastern Asia | 31 | 0.5% |
| Eastern Europe | 24 | 0.4% |
| England | 53 | 0.9% |
| Europe | 232 | 3.8% |
| Germany | 62 | 1.0% |
| Guatemala | 68 | 1.1% |
| Latin America | 577 | 9.6% |
| Mexico | 480 | 8.0% |
| Morocco | 15 | 0.3% |
| Northern Africa | 16 | 0.3% |
| Northern Europe | 93 | 1.5% |
| Oceania | 5 | 0.1% |
| Pakistan | 10 | 0.2% |
| Philippines | 64 | 1.1% |
| South America | 29 | 0.5% |
| South Central Asia | 10 | 0.2% |
| South Eastern Asia | 64 | 1.1% |
| Switzerland | 12 | 0.2% |
| Syria | 98 | 1.6% |
| Turkey | 17 | 0.3% |
| Ukraine | 12 | 0.2% |
| Venezuela | 29 | 0.5% |
| Western Asia | 115 | 1.9% |
| Western Europe | 115 | 1.9% | View All 33 Rows |
Sex and Age in Solvang
Sex and Age in Solvang
The most populous age groups in Solvang are 20 to 24 Years (237 | 8.7%) for men and 70 to 74 Years (412 | 12.4%) for women.
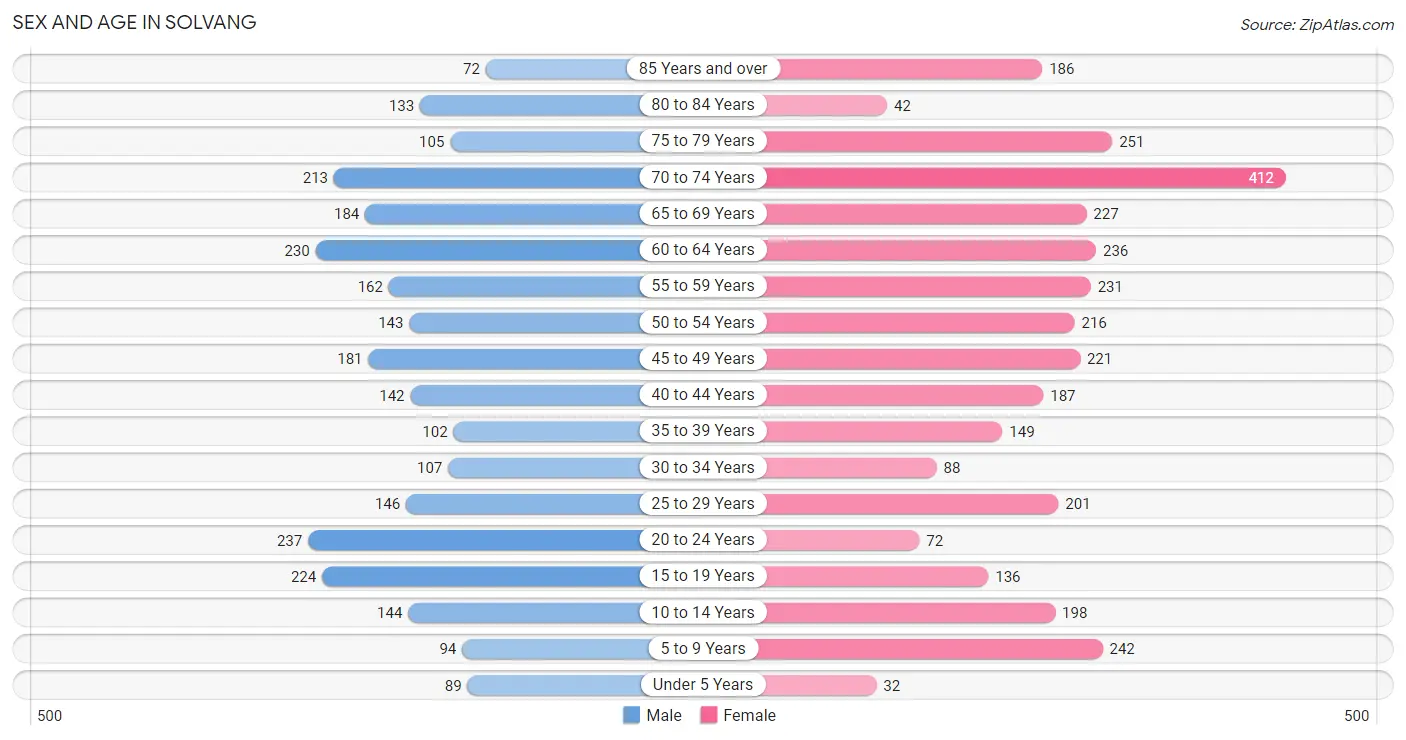
| Age Bracket | Male | Female |
| Under 5 Years | 89 (3.3%) | 32 (1.0%) |
| 5 to 9 Years | 94 (3.5%) | 242 (7.3%) |
| 10 to 14 Years | 144 (5.3%) | 198 (5.9%) |
| 15 to 19 Years | 224 (8.3%) | 136 (4.1%) |
| 20 to 24 Years | 237 (8.7%) | 72 (2.2%) |
| 25 to 29 Years | 146 (5.4%) | 201 (6.0%) |
| 30 to 34 Years | 107 (4.0%) | 88 (2.6%) |
| 35 to 39 Years | 102 (3.8%) | 149 (4.5%) |
| 40 to 44 Years | 142 (5.2%) | 187 (5.6%) |
| 45 to 49 Years | 181 (6.7%) | 221 (6.6%) |
| 50 to 54 Years | 143 (5.3%) | 216 (6.5%) |
| 55 to 59 Years | 162 (6.0%) | 231 (6.9%) |
| 60 to 64 Years | 230 (8.5%) | 236 (7.1%) |
| 65 to 69 Years | 184 (6.8%) | 227 (6.8%) |
| 70 to 74 Years | 213 (7.9%) | 412 (12.4%) |
| 75 to 79 Years | 105 (3.9%) | 251 (7.5%) |
| 80 to 84 Years | 133 (4.9%) | 42 (1.3%) |
| 85 Years and over | 72 (2.7%) | 186 (5.6%) |
| Total | 2,708 (100.0%) | 3,327 (100.0%) |
Families and Households in Solvang
Median Family Size in Solvang
The median family size in Solvang is 2.88 persons per family, with single male/father families (70 | 4.5%) accounting for the largest median family size of 4.86 persons per family. On the other hand, married-couple families (1,196 | 77.2%) represent the smallest median family size with 2.76 persons per family.
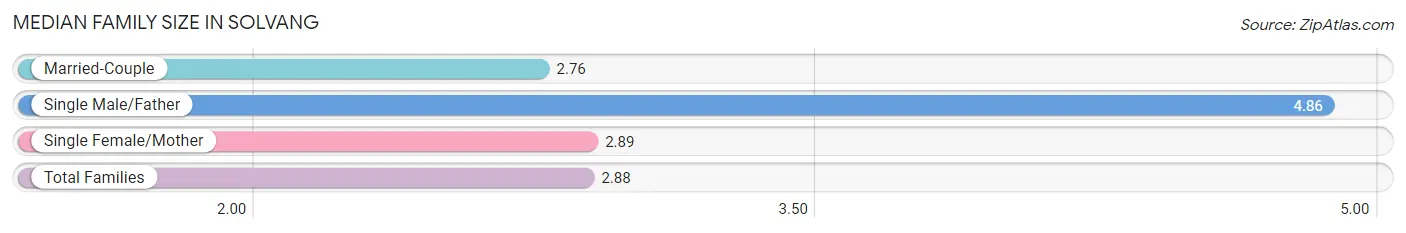
| Family Type | # Families | Family Size |
| Married-Couple | 1,196 (77.2%) | 2.76 |
| Single Male/Father | 70 (4.5%) | 4.86 |
| Single Female/Mother | 284 (18.3%) | 2.89 |
| Total Families | 1,550 (100.0%) | 2.88 |
Median Household Size in Solvang
The median household size in Solvang is 2.43 persons per household, with single male/father households (70 | 2.9%) accounting for the largest median household size of 5.64 persons per household. non-family households (909 | 37.0%) represent the smallest median household size with 1.41 persons per household.
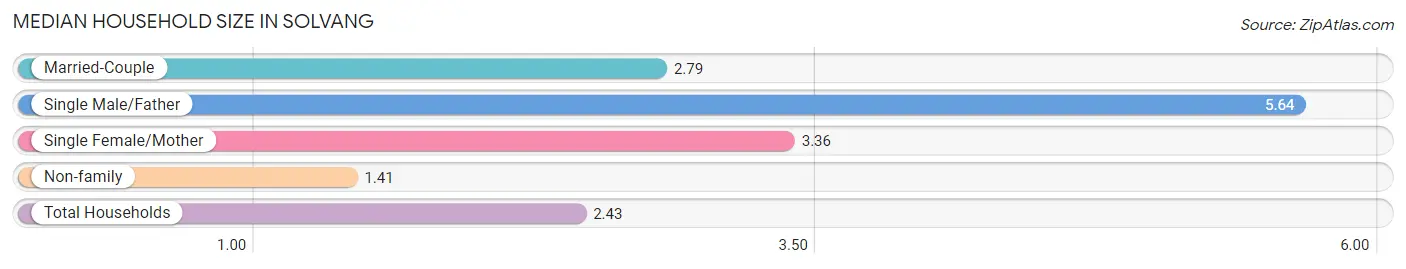
| Household Type | # Households | Household Size |
| Married-Couple | 1,196 (48.6%) | 2.79 |
| Single Male/Father | 70 (2.9%) | 5.64 |
| Single Female/Mother | 284 (11.6%) | 3.36 |
| Non-family | 909 (37.0%) | 1.41 |
| Total Households | 2,459 (100.0%) | 2.43 |
Household Size by Marriage Status in Solvang
Out of a total of 2,459 households in Solvang, 1,550 (63.0%) are family households, while 909 (37.0%) are nonfamily households. The most numerous type of family households are 2-person households, comprising 920, and the most common type of nonfamily households are 1-person households, comprising 622.
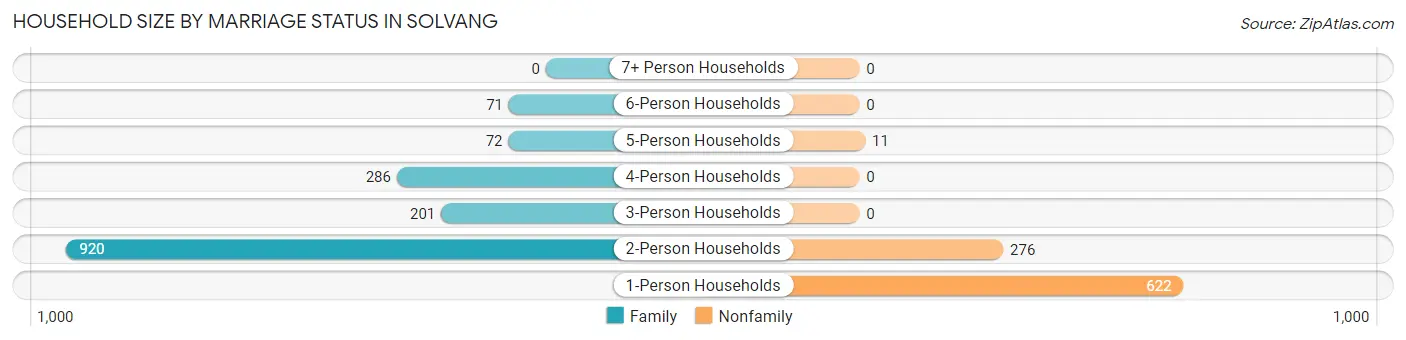
| Household Size | Family Households | Nonfamily Households |
| 1-Person Households | - | 622 (25.3%) |
| 2-Person Households | 920 (37.4%) | 276 (11.2%) |
| 3-Person Households | 201 (8.2%) | 0 (0.0%) |
| 4-Person Households | 286 (11.6%) | 0 (0.0%) |
| 5-Person Households | 72 (2.9%) | 11 (0.4%) |
| 6-Person Households | 71 (2.9%) | 0 (0.0%) |
| 7+ Person Households | 0 (0.0%) | 0 (0.0%) |
| Total | 1,550 (63.0%) | 909 (37.0%) |
Female Fertility in Solvang
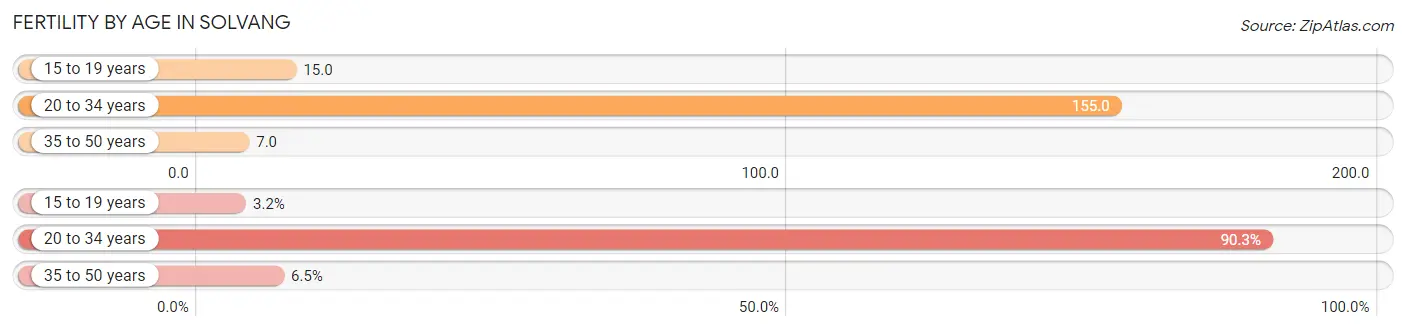
Fertility by Age in Solvang
Average fertility rate in Solvang is 58.0 births per 1,000 women. Women in the age bracket of 20 to 34 years have the highest fertility rate with 155.0 births per 1,000 women. Women in the age bracket of 20 to 34 years acount for 90.3% of all women with births.
| Age Bracket | Women with Births | Births / 1,000 Women |
| 15 to 19 years | 2 (3.2%) | 15.0 |
| 20 to 34 years | 56 (90.3%) | 155.0 |
| 35 to 50 years | 4 (6.5%) | 7.0 |
| Total | 62 (100.0%) | 58.0 |
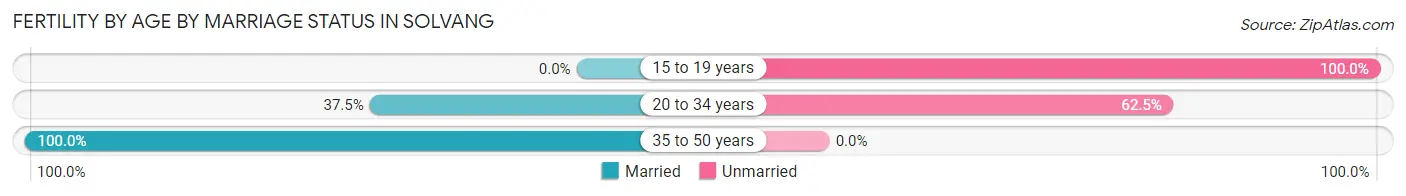
Fertility by Age by Marriage Status in Solvang
40.3% of women with births (62) in Solvang are married. The highest percentage of unmarried women with births falls into 15 to 19 years age bracket with 100.0% of them unmarried at the time of birth, while the lowest percentage of unmarried women with births belong to 35 to 50 years age bracket with 0.0% of them unmarried.
| Age Bracket | Married | Unmarried |
| 15 to 19 years | 0 (0.0%) | 2 (100.0%) |
| 20 to 34 years | 21 (37.5%) | 35 (62.5%) |
| 35 to 50 years | 4 (100.0%) | 0 (0.0%) |
| Total | 25 (40.3%) | 37 (59.7%) |
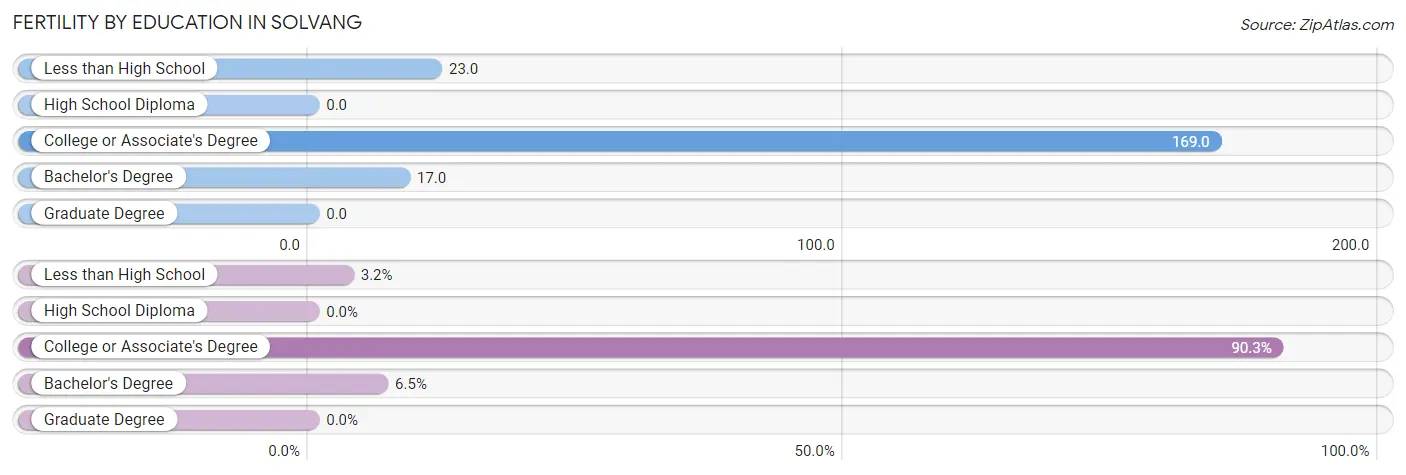
Fertility by Education in Solvang
| Educational Attainment | Women with Births | Births / 1,000 Women |
| Less than High School | 2 (3.2%) | 23.0 |
| High School Diploma | 0 (0.0%) | 0.0 |
| College or Associate's Degree | 56 (90.3%) | 169.0 |
| Bachelor's Degree | 4 (6.5%) | 17.0 |
| Graduate Degree | 0 (0.0%) | 0.0 |
| Total | 62 (100.0%) | 58.0 |
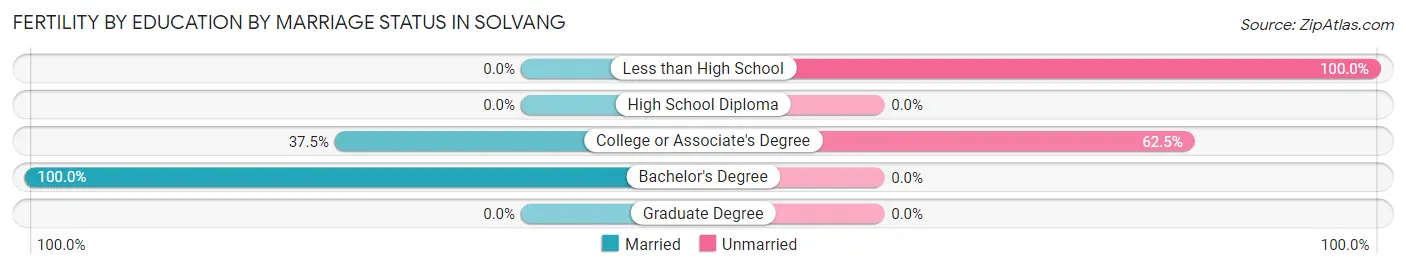
Fertility by Education by Marriage Status in Solvang
59.7% of women with births in Solvang are unmarried. Women with the educational attainment of bachelor's degree are most likely to be married with 100.0% of them married at childbirth, while women with the educational attainment of less than high school are least likely to be married with 100.0% of them unmarried at childbirth.
| Educational Attainment | Married | Unmarried |
| Less than High School | 0 (0.0%) | 2 (100.0%) |
| High School Diploma | 0 (0.0%) | 0 (0.0%) |
| College or Associate's Degree | 21 (37.5%) | 35 (62.5%) |
| Bachelor's Degree | 4 (100.0%) | 0 (0.0%) |
| Graduate Degree | 0 (0.0%) | 0 (0.0%) |
| Total | 25 (40.3%) | 37 (59.7%) |
Employment Characteristics in Solvang
Employment by Class of Employer in Solvang
Among the 2,966 employed individuals in Solvang, private company employees (1,715 | 57.8%), self-employed (not incorporated) (323 | 10.9%), and self-employed (incorporated) (262 | 8.8%) make up the most common classes of employment.
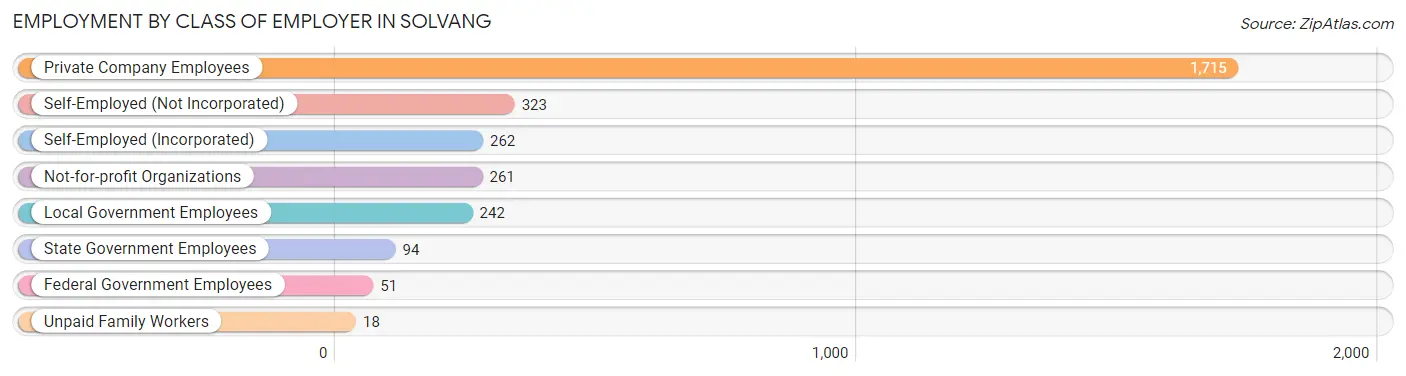
| Employer Class | # Employees | % Employees |
| Private Company Employees | 1,715 | 57.8% |
| Self-Employed (Incorporated) | 262 | 8.8% |
| Self-Employed (Not Incorporated) | 323 | 10.9% |
| Not-for-profit Organizations | 261 | 8.8% |
| Local Government Employees | 242 | 8.2% |
| State Government Employees | 94 | 3.2% |
| Federal Government Employees | 51 | 1.7% |
| Unpaid Family Workers | 18 | 0.6% |
| Total | 2,966 | 100.0% |
Employment Status by Age in Solvang
According to the labor force statistics for Solvang, out of the total population over 16 years of age (5,104), 61.5% or 3,139 individuals are in the labor force, with 4.2% or 132 of them unemployed. The age group with the highest labor force participation rate is 30 to 34 years, with 100.0% or 195 individuals in the labor force. Within the labor force, the 25 to 29 years age range has the highest percentage of unemployed individuals, with 29.7% or 85 of them being unemployed.
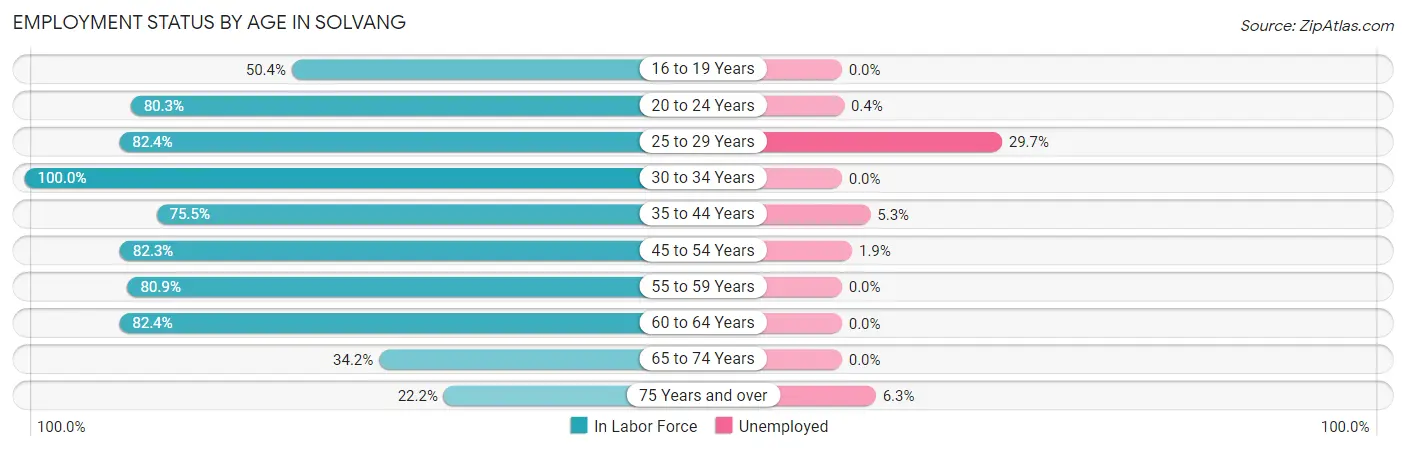
| Age Bracket | In Labor Force | Unemployed |
| 16 to 19 Years | 115 (50.4%) | 0 (0.0%) |
| 20 to 24 Years | 248 (80.3%) | 1 (0.4%) |
| 25 to 29 Years | 286 (82.4%) | 85 (29.7%) |
| 30 to 34 Years | 195 (100.0%) | 0 (0.0%) |
| 35 to 44 Years | 438 (75.5%) | 23 (5.3%) |
| 45 to 54 Years | 626 (82.3%) | 12 (1.9%) |
| 55 to 59 Years | 318 (80.9%) | 0 (0.0%) |
| 60 to 64 Years | 384 (82.4%) | 0 (0.0%) |
| 65 to 74 Years | 354 (34.2%) | 0 (0.0%) |
| 75 Years and over | 175 (22.2%) | 11 (6.3%) |
| Total | 3,139 (61.5%) | 132 (4.2%) |
Employment Status by Educational Attainment in Solvang
According to labor force statistics for Solvang, 81.9% of individuals (2,246) out of the total population between 25 and 64 years of age (2,742) are in the labor force, with 5.3% or 119 of them being unemployed. The group with the highest labor force participation rate are those with the educational attainment of bachelor's degree or higher, with 87.2% or 937 individuals in the labor force. Within the labor force, individuals with college / associate degree education have the highest percentage of unemployment, with 8.5% or 67 of them being unemployed.
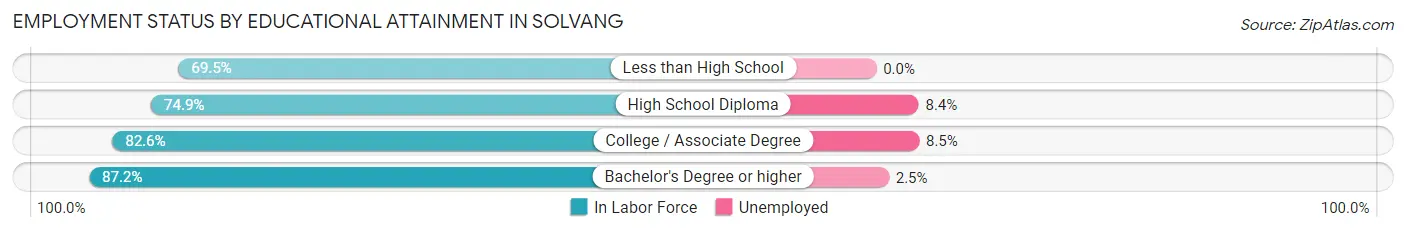
| Educational Attainment | In Labor Force | Unemployed |
| Less than High School | 169 (69.5%) | 0 (0.0%) |
| High School Diploma | 356 (74.9%) | 40 (8.4%) |
| College / Associate Degree | 785 (82.6%) | 81 (8.5%) |
| Bachelor's Degree or higher | 937 (87.2%) | 27 (2.5%) |
| Total | 2,246 (81.9%) | 145 (5.3%) |
Employment Occupations by Sex in Solvang
Management, Business, Science and Arts Occupations
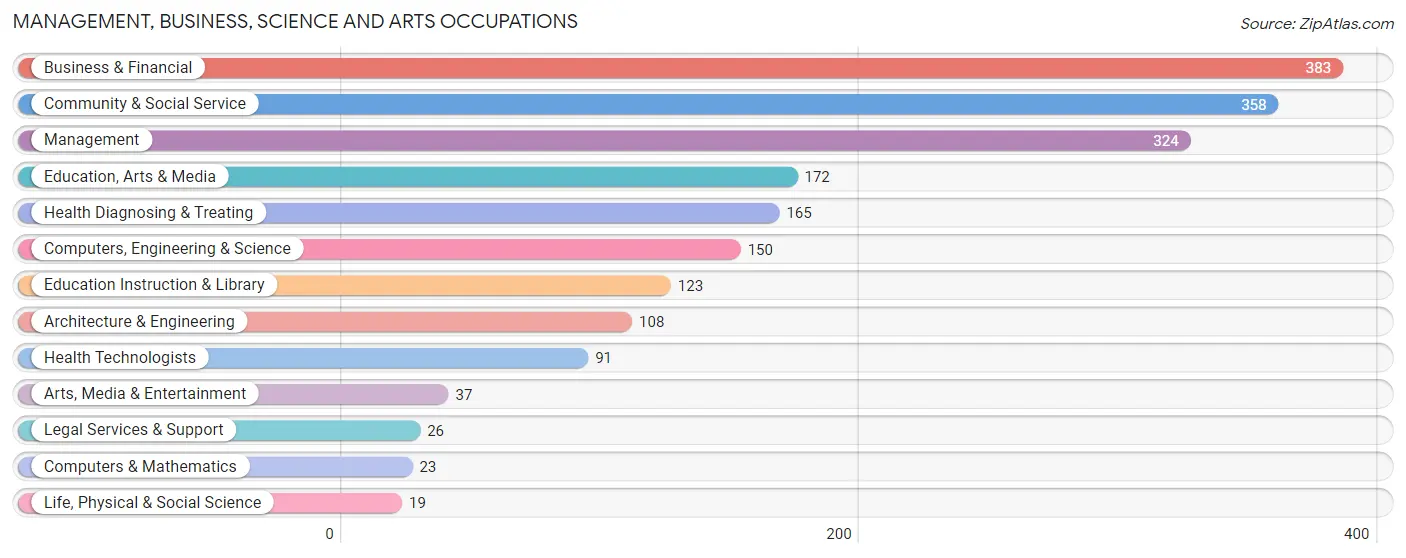
The most common Management, Business, Science and Arts occupations in Solvang are Business & Financial (383 | 12.7%), Community & Social Service (358 | 11.9%), Management (324 | 10.8%), Education, Arts & Media (172 | 5.7%), and Health Diagnosing & Treating (165 | 5.5%).
Management, Business, Science and Arts Occupations by Sex
Within the Management, Business, Science and Arts occupations in Solvang, the most male-oriented occupations are Computers & Mathematics (100.0%), Architecture & Engineering (100.0%), and Computers, Engineering & Science (87.3%), while the most female-oriented occupations are Life, Physical & Social Science (100.0%), Education, Arts & Media (91.3%), and Legal Services & Support (88.5%).
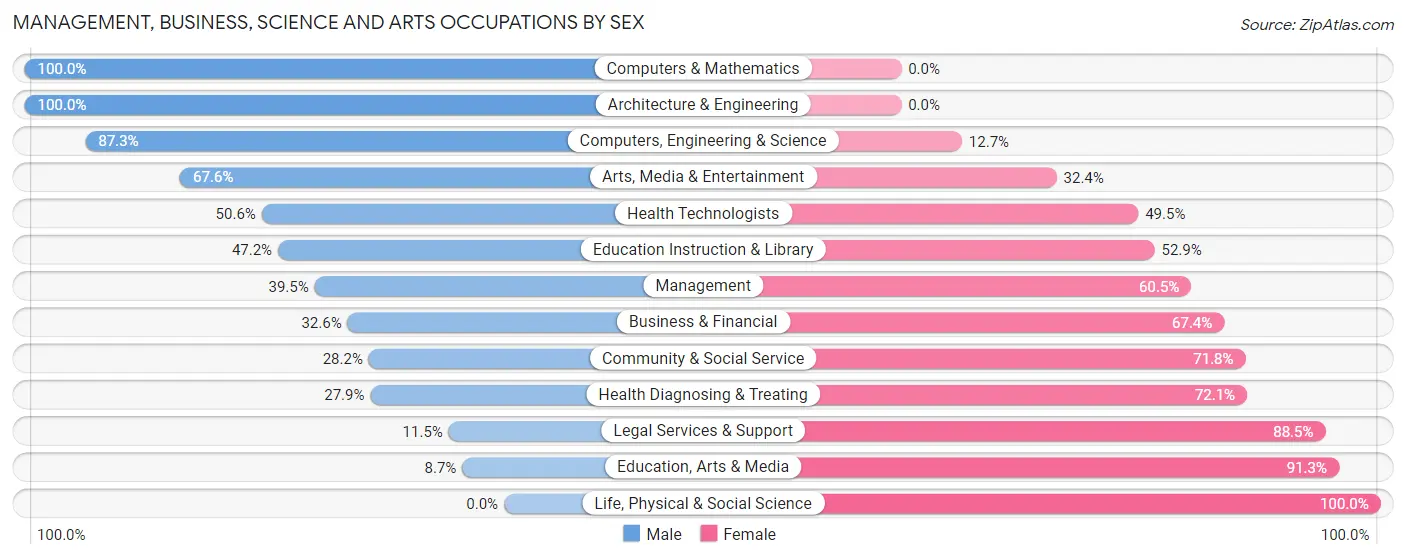
| Occupation | Male | Female |
| Management | 128 (39.5%) | 196 (60.5%) |
| Business & Financial | 125 (32.6%) | 258 (67.4%) |
| Computers, Engineering & Science | 131 (87.3%) | 19 (12.7%) |
| Computers & Mathematics | 23 (100.0%) | 0 (0.0%) |
| Architecture & Engineering | 108 (100.0%) | 0 (0.0%) |
| Life, Physical & Social Science | 0 (0.0%) | 19 (100.0%) |
| Community & Social Service | 101 (28.2%) | 257 (71.8%) |
| Education, Arts & Media | 15 (8.7%) | 157 (91.3%) |
| Legal Services & Support | 3 (11.5%) | 23 (88.5%) |
| Education Instruction & Library | 58 (47.1%) | 65 (52.8%) |
| Arts, Media & Entertainment | 25 (67.6%) | 12 (32.4%) |
| Health Diagnosing & Treating | 46 (27.9%) | 119 (72.1%) |
| Health Technologists | 46 (50.5%) | 45 (49.4%) |
| Total (Category) | 531 (38.5%) | 849 (61.5%) |
| Total (Overall) | 1,446 (48.1%) | 1,561 (51.9%) |
Services Occupations
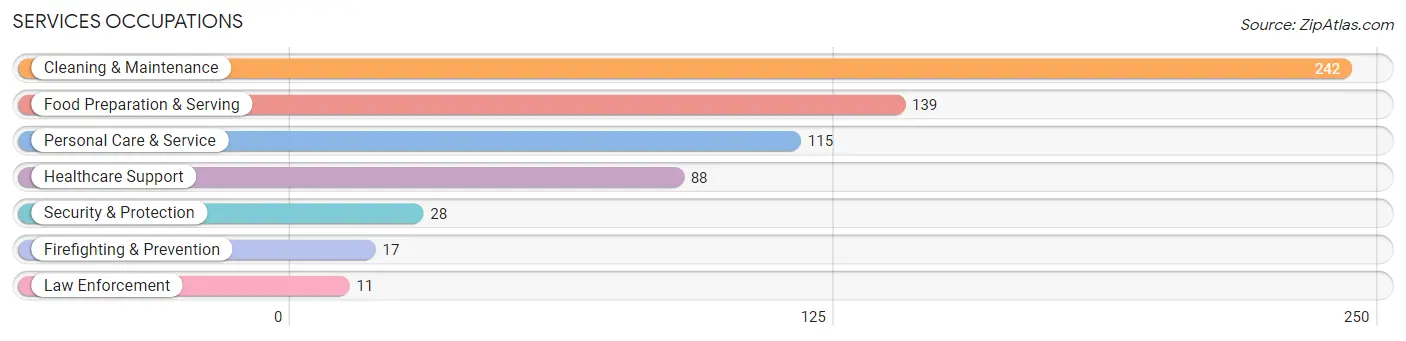
The most common Services occupations in Solvang are Cleaning & Maintenance (242 | 8.1%), Food Preparation & Serving (139 | 4.6%), Personal Care & Service (115 | 3.8%), Healthcare Support (88 | 2.9%), and Security & Protection (28 | 0.9%).
Services Occupations by Sex
Within the Services occupations in Solvang, the most male-oriented occupations are Security & Protection (100.0%), Firefighting & Prevention (100.0%), and Law Enforcement (100.0%), while the most female-oriented occupations are Healthcare Support (100.0%), Food Preparation & Serving (58.3%), and Personal Care & Service (55.6%).
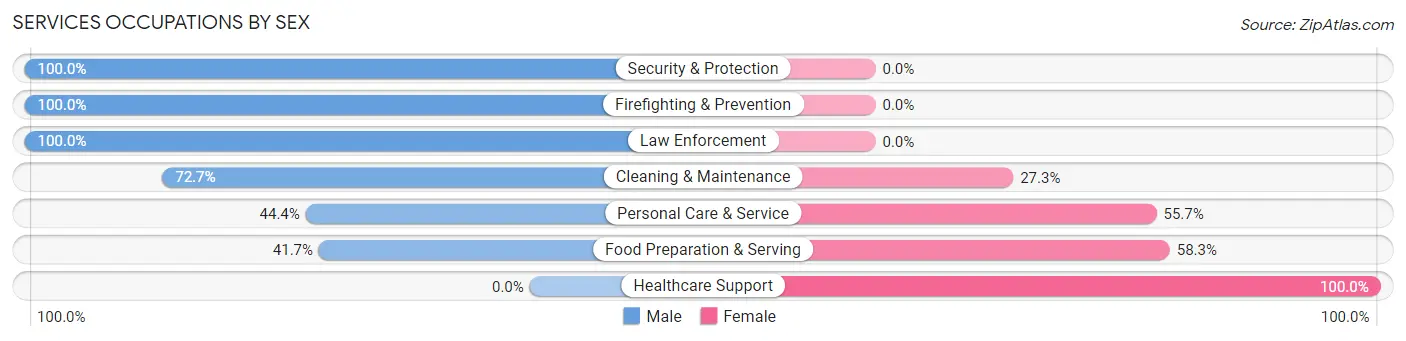
| Occupation | Male | Female |
| Healthcare Support | 0 (0.0%) | 88 (100.0%) |
| Security & Protection | 28 (100.0%) | 0 (0.0%) |
| Firefighting & Prevention | 17 (100.0%) | 0 (0.0%) |
| Law Enforcement | 11 (100.0%) | 0 (0.0%) |
| Food Preparation & Serving | 58 (41.7%) | 81 (58.3%) |
| Cleaning & Maintenance | 176 (72.7%) | 66 (27.3%) |
| Personal Care & Service | 51 (44.4%) | 64 (55.6%) |
| Total (Category) | 313 (51.1%) | 299 (48.9%) |
| Total (Overall) | 1,446 (48.1%) | 1,561 (51.9%) |
Sales and Office Occupations
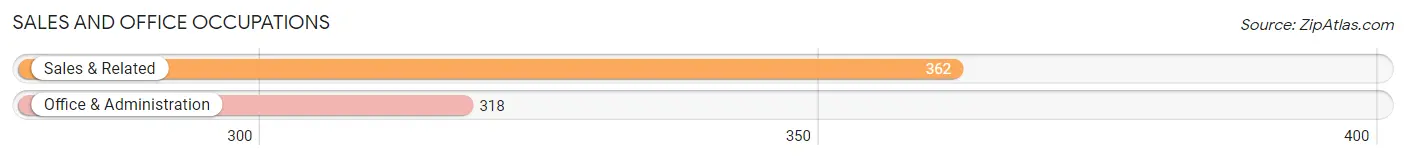
The most common Sales and Office occupations in Solvang are Sales & Related (362 | 12.0%), and Office & Administration (318 | 10.6%).
Sales and Office Occupations by Sex
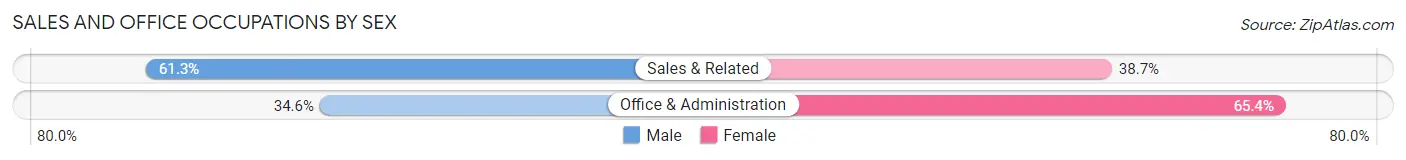
| Occupation | Male | Female |
| Sales & Related | 222 (61.3%) | 140 (38.7%) |
| Office & Administration | 110 (34.6%) | 208 (65.4%) |
| Total (Category) | 332 (48.8%) | 348 (51.2%) |
| Total (Overall) | 1,446 (48.1%) | 1,561 (51.9%) |
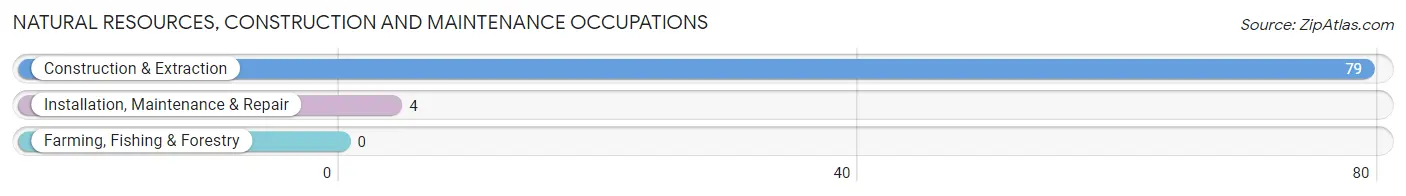
Natural Resources, Construction and Maintenance Occupations
The most common Natural Resources, Construction and Maintenance occupations in Solvang are Construction & Extraction (79 | 2.6%), and Installation, Maintenance & Repair (4 | 0.1%).
Natural Resources, Construction and Maintenance Occupations by Sex
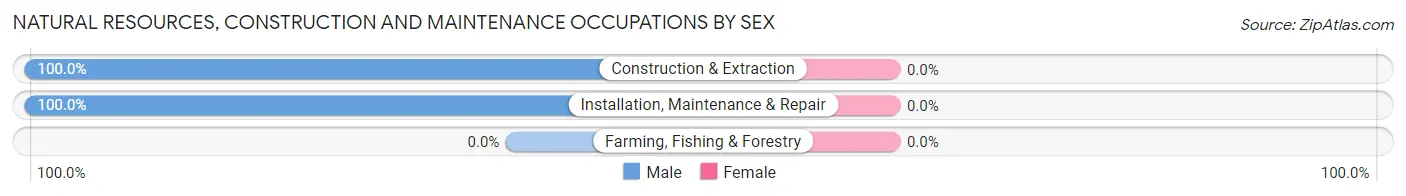
| Occupation | Male | Female |
| Farming, Fishing & Forestry | 0 (0.0%) | 0 (0.0%) |
| Construction & Extraction | 79 (100.0%) | 0 (0.0%) |
| Installation, Maintenance & Repair | 4 (100.0%) | 0 (0.0%) |
| Total (Category) | 83 (100.0%) | 0 (0.0%) |
| Total (Overall) | 1,446 (48.1%) | 1,561 (51.9%) |
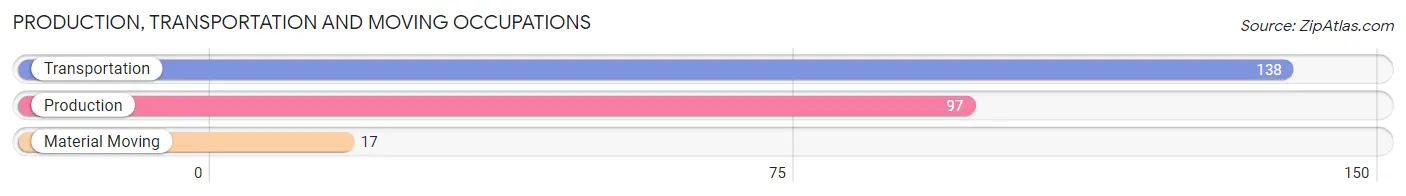
Production, Transportation and Moving Occupations
The most common Production, Transportation and Moving occupations in Solvang are Transportation (138 | 4.6%), Production (97 | 3.2%), and Material Moving (17 | 0.6%).
Production, Transportation and Moving Occupations by Sex
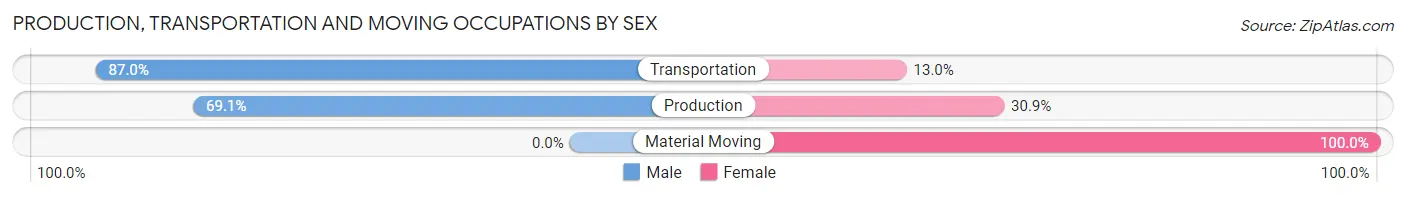
| Occupation | Male | Female |
| Production | 67 (69.1%) | 30 (30.9%) |
| Transportation | 120 (87.0%) | 18 (13.0%) |
| Material Moving | 0 (0.0%) | 17 (100.0%) |
| Total (Category) | 187 (74.2%) | 65 (25.8%) |
| Total (Overall) | 1,446 (48.1%) | 1,561 (51.9%) |
Employment Industries by Sex in Solvang
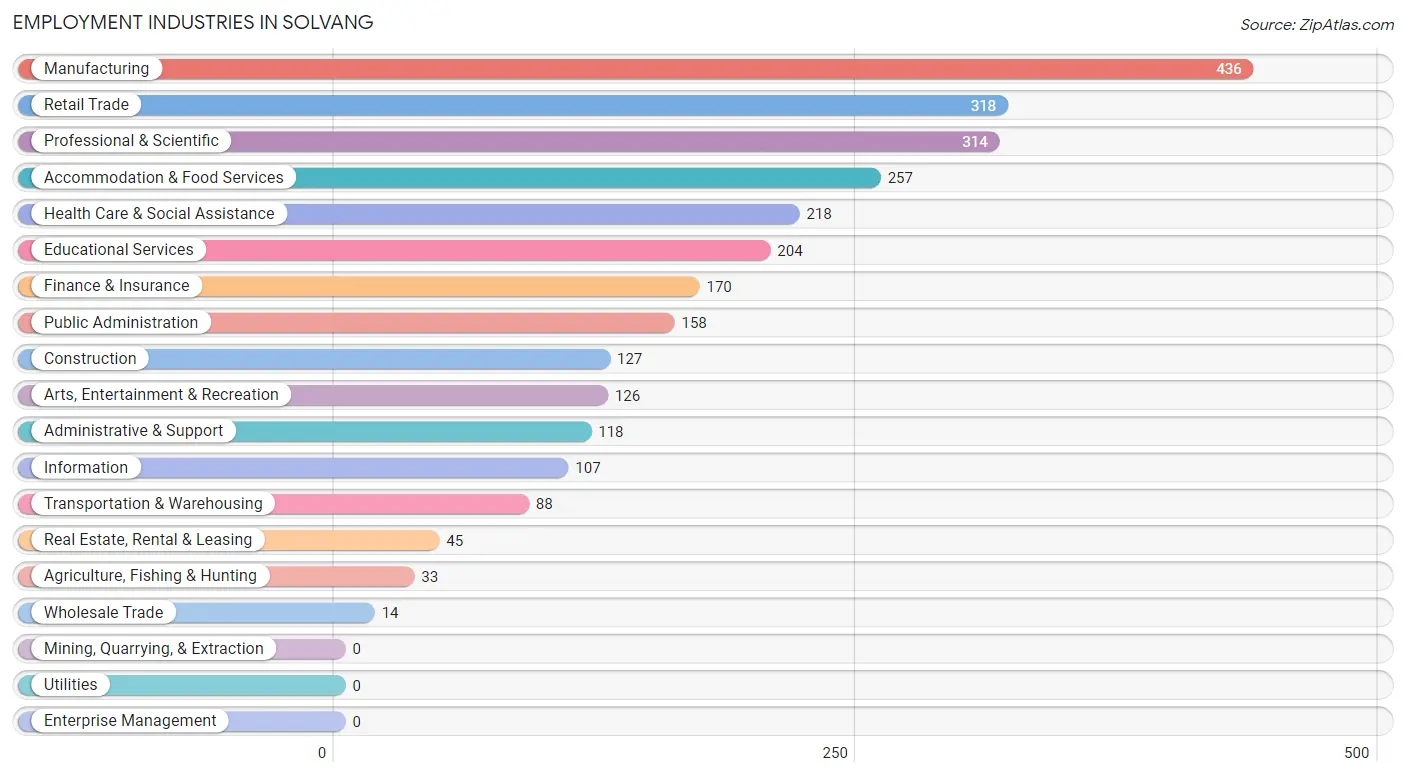
Employment Industries in Solvang
The major employment industries in Solvang include Manufacturing (436 | 14.5%), Retail Trade (318 | 10.6%), Professional & Scientific (314 | 10.4%), Accommodation & Food Services (257 | 8.6%), and Health Care & Social Assistance (218 | 7.2%).
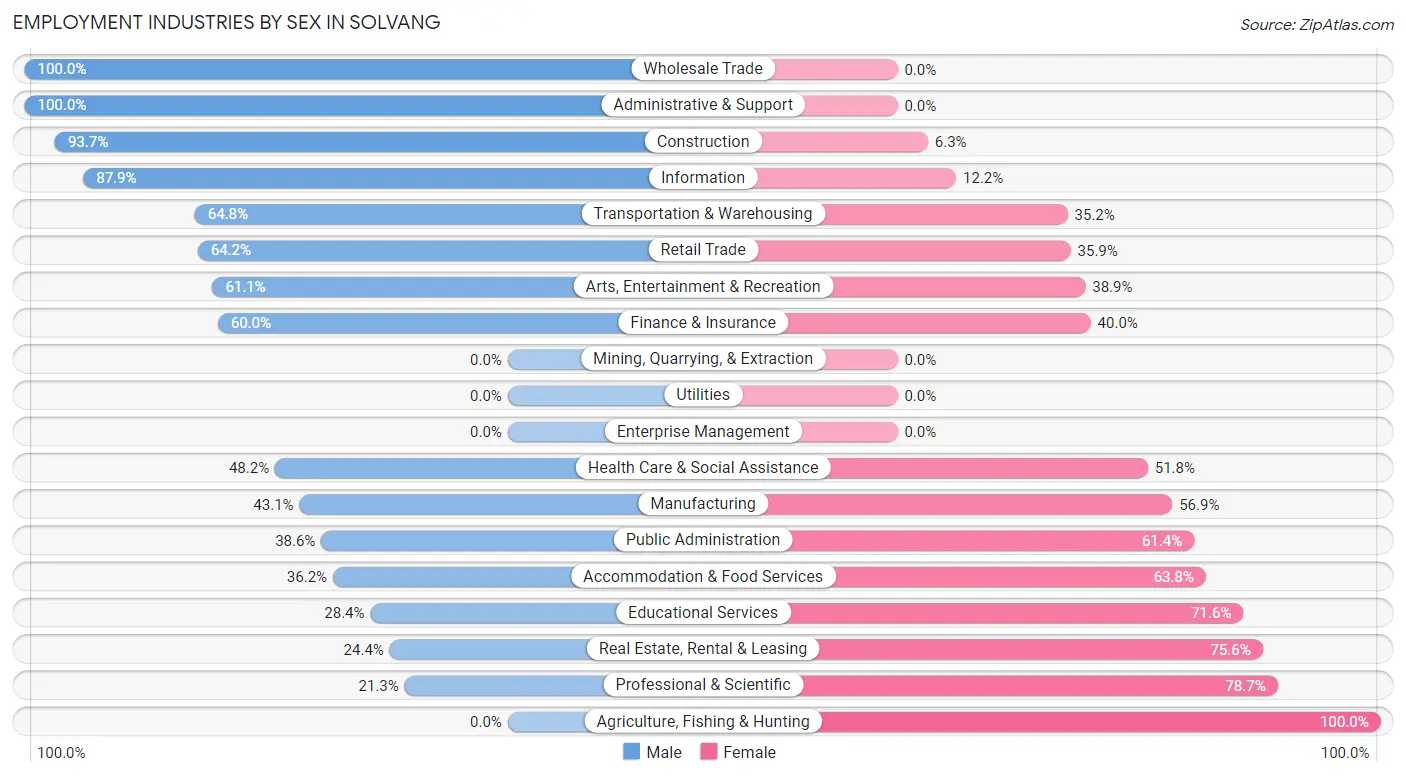
Employment Industries by Sex in Solvang
The Solvang industries that see more men than women are Wholesale Trade (100.0%), Administrative & Support (100.0%), and Construction (93.7%), whereas the industries that tend to have a higher number of women are Agriculture, Fishing & Hunting (100.0%), Professional & Scientific (78.7%), and Real Estate, Rental & Leasing (75.6%).
| Industry | Male | Female |
| Agriculture, Fishing & Hunting | 0 (0.0%) | 33 (100.0%) |
| Mining, Quarrying, & Extraction | 0 (0.0%) | 0 (0.0%) |
| Construction | 119 (93.7%) | 8 (6.3%) |
| Manufacturing | 188 (43.1%) | 248 (56.9%) |
| Wholesale Trade | 14 (100.0%) | 0 (0.0%) |
| Retail Trade | 204 (64.1%) | 114 (35.8%) |
| Transportation & Warehousing | 57 (64.8%) | 31 (35.2%) |
| Utilities | 0 (0.0%) | 0 (0.0%) |
| Information | 94 (87.8%) | 13 (12.1%) |
| Finance & Insurance | 102 (60.0%) | 68 (40.0%) |
| Real Estate, Rental & Leasing | 11 (24.4%) | 34 (75.6%) |
| Professional & Scientific | 67 (21.3%) | 247 (78.7%) |
| Enterprise Management | 0 (0.0%) | 0 (0.0%) |
| Administrative & Support | 118 (100.0%) | 0 (0.0%) |
| Educational Services | 58 (28.4%) | 146 (71.6%) |
| Health Care & Social Assistance | 105 (48.2%) | 113 (51.8%) |
| Arts, Entertainment & Recreation | 77 (61.1%) | 49 (38.9%) |
| Accommodation & Food Services | 93 (36.2%) | 164 (63.8%) |
| Public Administration | 61 (38.6%) | 97 (61.4%) |
| Total | 1,446 (48.1%) | 1,561 (51.9%) |
Education in Solvang
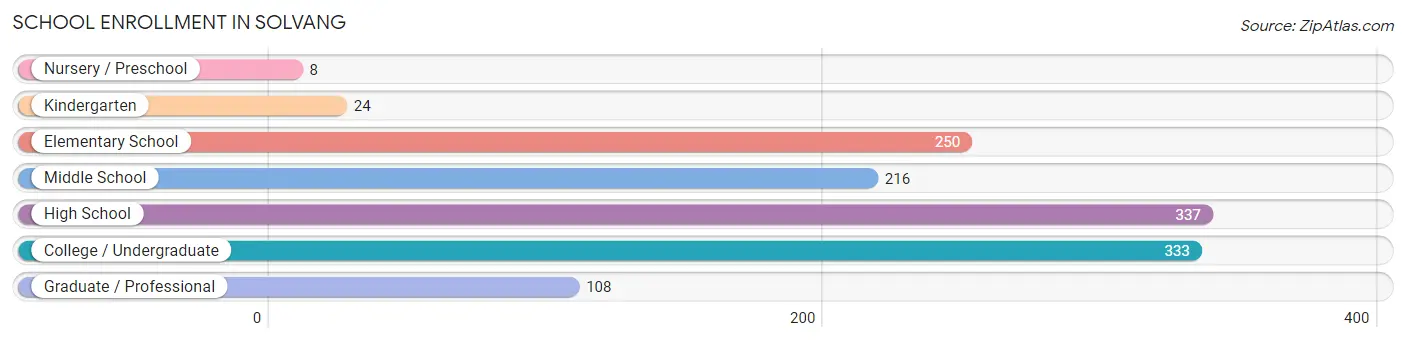
School Enrollment in Solvang
The most common levels of schooling among the 1,276 students in Solvang are high school (337 | 26.4%), college / undergraduate (333 | 26.1%), and elementary school (250 | 19.6%).
| School Level | # Students | % Students |
| Nursery / Preschool | 8 | 0.6% |
| Kindergarten | 24 | 1.9% |
| Elementary School | 250 | 19.6% |
| Middle School | 216 | 16.9% |
| High School | 337 | 26.4% |
| College / Undergraduate | 333 | 26.1% |
| Graduate / Professional | 108 | 8.5% |
| Total | 1,276 | 100.0% |
School Enrollment by Age by Funding Source in Solvang
Out of a total of 1,276 students who are enrolled in schools in Solvang, 197 (15.4%) attend a private institution, while the remaining 1,079 (84.6%) are enrolled in public schools. The age group of 3 to 4 year olds has the highest likelihood of being enrolled in private schools, with 7 (87.5% in the age bracket) enrolled. Conversely, the age group of 18 to 19 year olds has the lowest likelihood of being enrolled in a private school, with 75 (100.0% in the age bracket) attending a public institution.
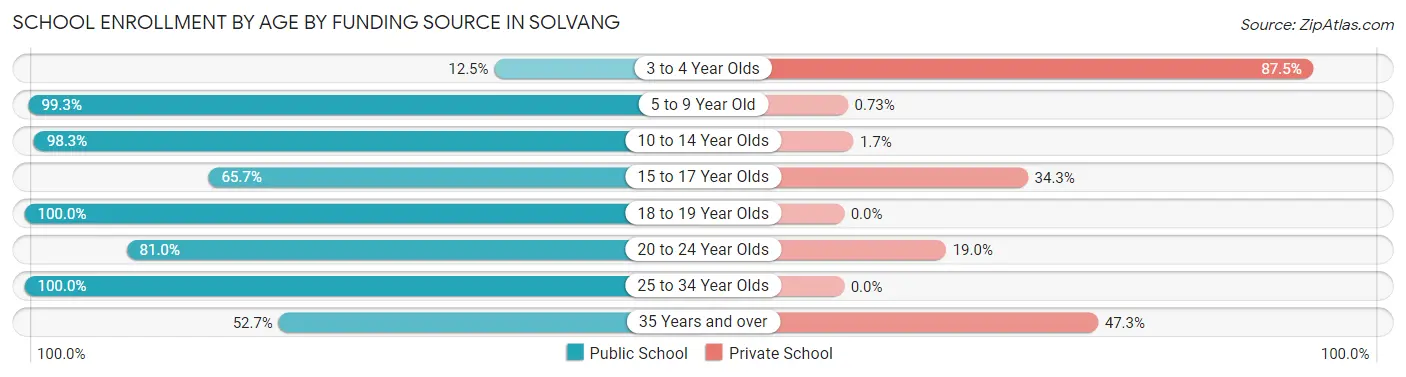
| Age Bracket | Public School | Private School |
| 3 to 4 Year Olds | 1 (12.5%) | 7 (87.5%) |
| 5 to 9 Year Old | 272 (99.3%) | 2 (0.7%) |
| 10 to 14 Year Olds | 284 (98.3%) | 5 (1.7%) |
| 15 to 17 Year Olds | 142 (65.7%) | 74 (34.3%) |
| 18 to 19 Year Olds | 75 (100.0%) | 0 (0.0%) |
| 20 to 24 Year Olds | 196 (81.0%) | 46 (19.0%) |
| 25 to 34 Year Olds | 41 (100.0%) | 0 (0.0%) |
| 35 Years and over | 69 (52.7%) | 62 (47.3%) |
| Total | 1,079 (84.6%) | 197 (15.4%) |
Educational Attainment by Field of Study in Solvang
Business (387 | 21.7%), psychology (196 | 11.0%), bio, nature & agricultural (152 | 8.5%), engineering (147 | 8.3%), and social sciences (135 | 7.6%) are the most common fields of study among 1,779 individuals in Solvang who have obtained a bachelor's degree or higher.
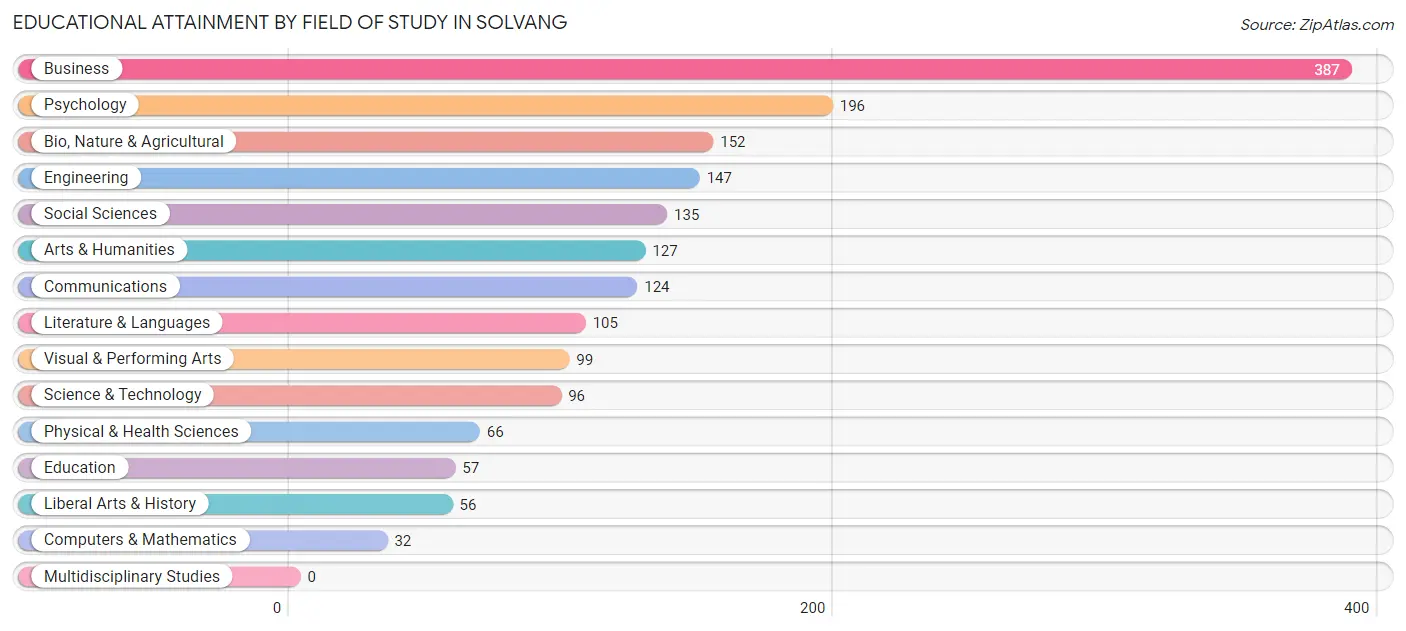
| Field of Study | # Graduates | % Graduates |
| Computers & Mathematics | 32 | 1.8% |
| Bio, Nature & Agricultural | 152 | 8.5% |
| Physical & Health Sciences | 66 | 3.7% |
| Psychology | 196 | 11.0% |
| Social Sciences | 135 | 7.6% |
| Engineering | 147 | 8.3% |
| Multidisciplinary Studies | 0 | 0.0% |
| Science & Technology | 96 | 5.4% |
| Business | 387 | 21.7% |
| Education | 57 | 3.2% |
| Literature & Languages | 105 | 5.9% |
| Liberal Arts & History | 56 | 3.2% |
| Visual & Performing Arts | 99 | 5.6% |
| Communications | 124 | 7.0% |
| Arts & Humanities | 127 | 7.1% |
| Total | 1,779 | 100.0% |
Transportation & Commute in Solvang
Vehicle Availability by Sex in Solvang
The most prevalent vehicle ownership categories in Solvang are males with 2 vehicles (631, accounting for 44.0%) and females with 2 vehicles (450, making up 41.3%).
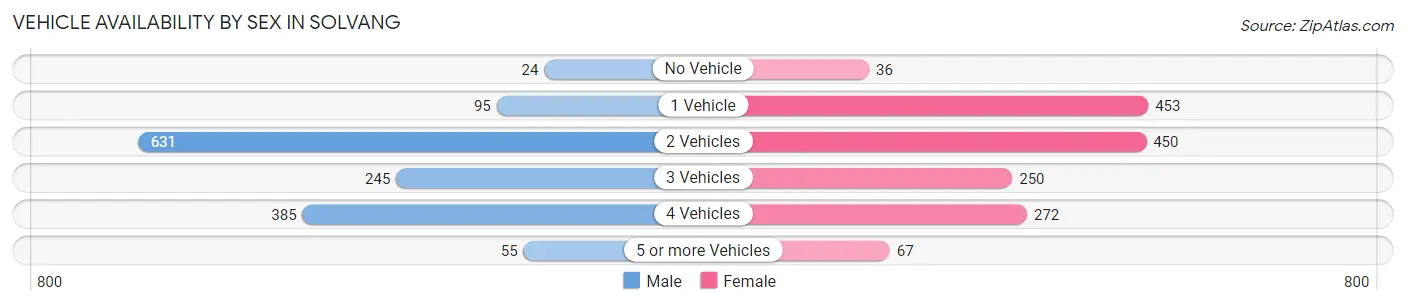
| Vehicles Available | Male | Female |
| No Vehicle | 24 (1.7%) | 36 (2.4%) |
| 1 Vehicle | 95 (6.6%) | 453 (29.6%) |
| 2 Vehicles | 631 (44.0%) | 450 (29.4%) |
| 3 Vehicles | 245 (17.1%) | 250 (16.4%) |
| 4 Vehicles | 385 (26.8%) | 272 (17.8%) |
| 5 or more Vehicles | 55 (3.8%) | 67 (4.4%) |
| Total | 1,435 (100.0%) | 1,528 (100.0%) |
Commute Time in Solvang
The most frequently occuring commute durations in Solvang are 45 to 59 minutes (492 commuters, 19.1%), 5 to 9 minutes (413 commuters, 16.1%), and 10 to 14 minutes (317 commuters, 12.3%).
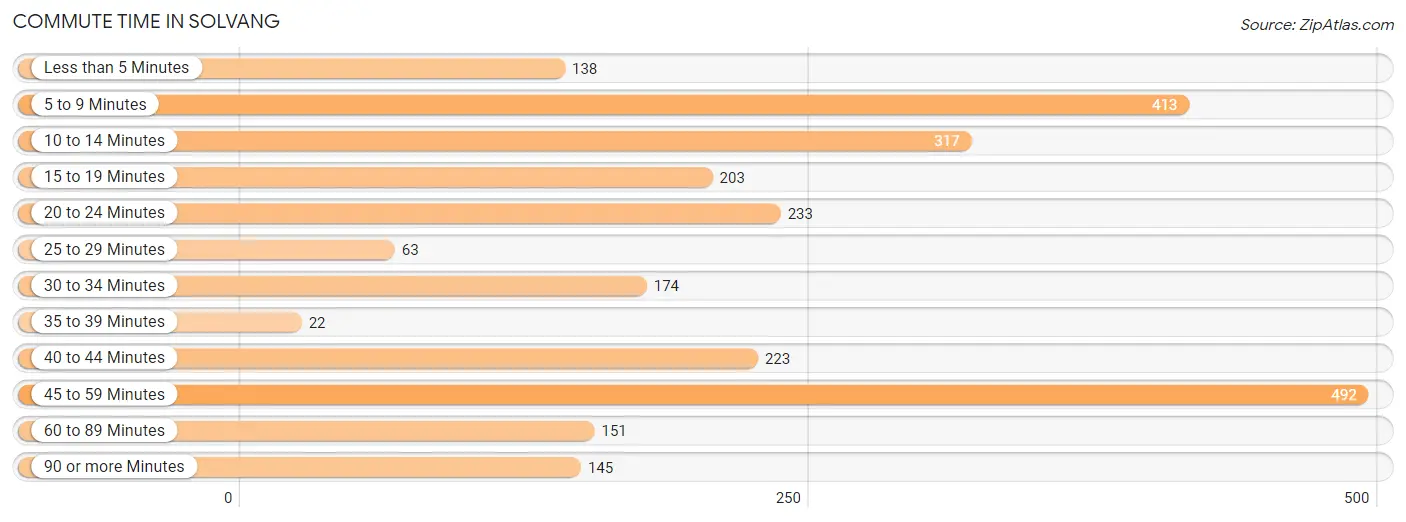
| Commute Time | # Commuters | % Commuters |
| Less than 5 Minutes | 138 | 5.4% |
| 5 to 9 Minutes | 413 | 16.1% |
| 10 to 14 Minutes | 317 | 12.3% |
| 15 to 19 Minutes | 203 | 7.9% |
| 20 to 24 Minutes | 233 | 9.0% |
| 25 to 29 Minutes | 63 | 2.5% |
| 30 to 34 Minutes | 174 | 6.8% |
| 35 to 39 Minutes | 22 | 0.9% |
| 40 to 44 Minutes | 223 | 8.7% |
| 45 to 59 Minutes | 492 | 19.1% |
| 60 to 89 Minutes | 151 | 5.9% |
| 90 or more Minutes | 145 | 5.6% |
Commute Time by Sex in Solvang
The most common commute times in Solvang are 45 to 59 minutes (418 commuters, 33.5%) for males and 5 to 9 minutes (265 commuters, 20.0%) for females.
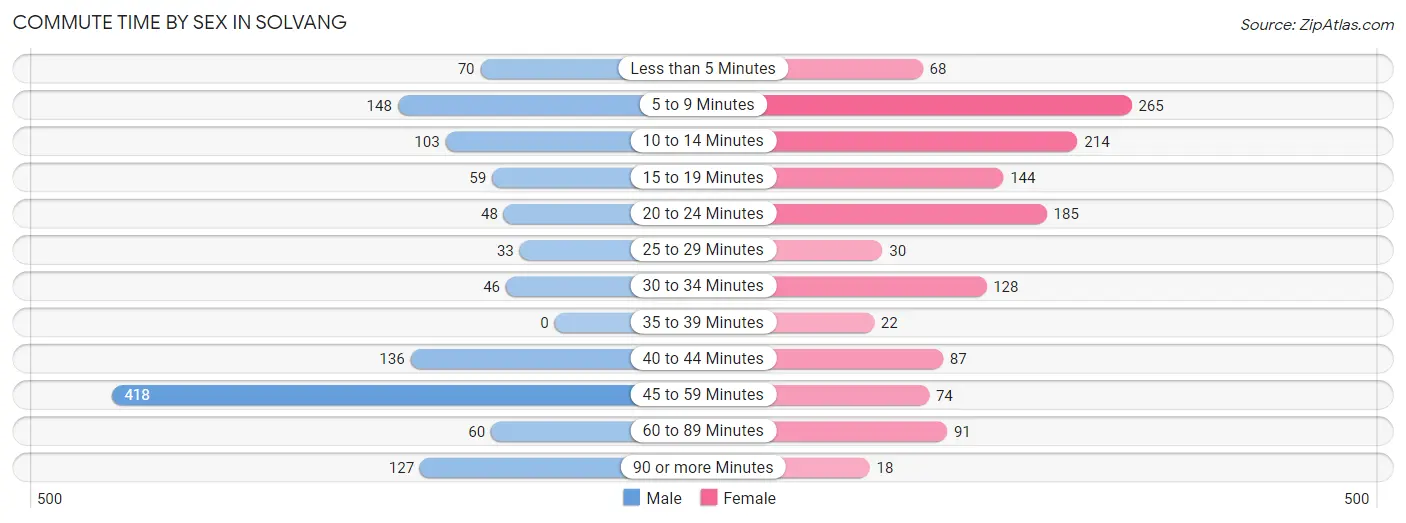
| Commute Time | Male | Female |
| Less than 5 Minutes | 70 (5.6%) | 68 (5.1%) |
| 5 to 9 Minutes | 148 (11.9%) | 265 (20.0%) |
| 10 to 14 Minutes | 103 (8.3%) | 214 (16.1%) |
| 15 to 19 Minutes | 59 (4.7%) | 144 (10.9%) |
| 20 to 24 Minutes | 48 (3.8%) | 185 (14.0%) |
| 25 to 29 Minutes | 33 (2.6%) | 30 (2.3%) |
| 30 to 34 Minutes | 46 (3.7%) | 128 (9.7%) |
| 35 to 39 Minutes | 0 (0.0%) | 22 (1.7%) |
| 40 to 44 Minutes | 136 (10.9%) | 87 (6.6%) |
| 45 to 59 Minutes | 418 (33.5%) | 74 (5.6%) |
| 60 to 89 Minutes | 60 (4.8%) | 91 (6.9%) |
| 90 or more Minutes | 127 (10.2%) | 18 (1.4%) |
Time of Departure to Work by Sex in Solvang
The most frequent times of departure to work in Solvang are 7:00 AM to 7:29 AM (251, 20.1%) for males and 8:30 AM to 8:59 AM (269, 20.3%) for females.
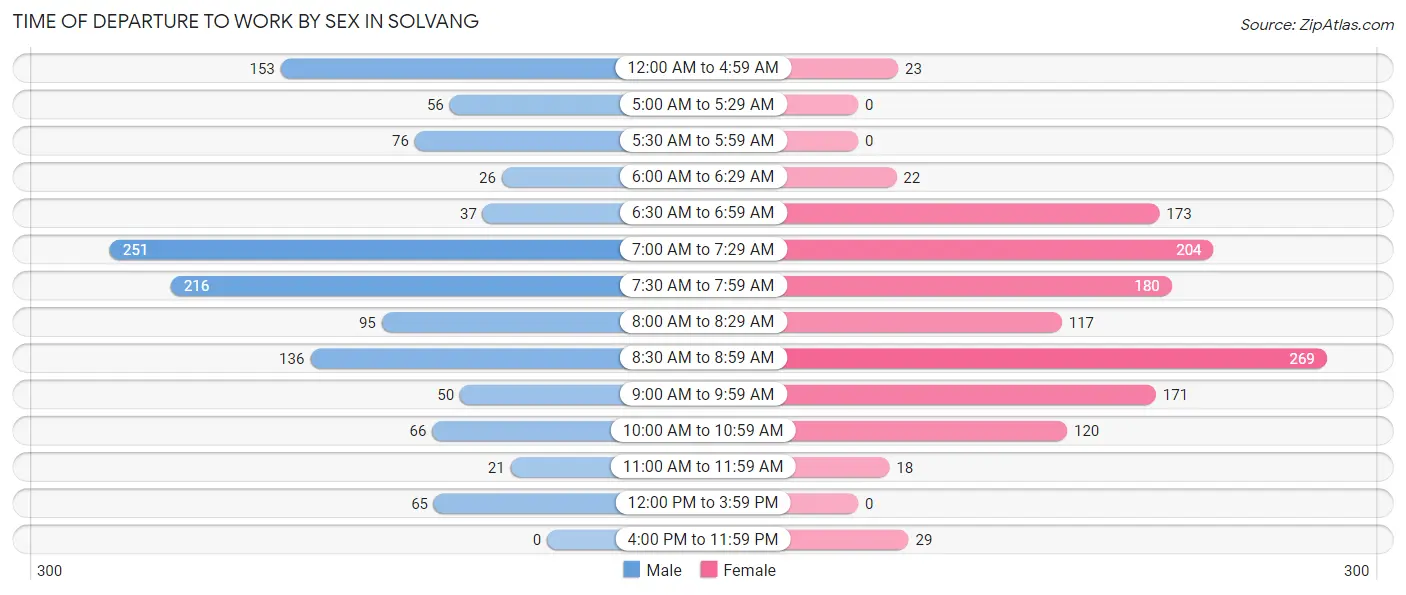
| Time of Departure | Male | Female |
| 12:00 AM to 4:59 AM | 153 (12.3%) | 23 (1.7%) |
| 5:00 AM to 5:29 AM | 56 (4.5%) | 0 (0.0%) |
| 5:30 AM to 5:59 AM | 76 (6.1%) | 0 (0.0%) |
| 6:00 AM to 6:29 AM | 26 (2.1%) | 22 (1.7%) |
| 6:30 AM to 6:59 AM | 37 (3.0%) | 173 (13.1%) |
| 7:00 AM to 7:29 AM | 251 (20.1%) | 204 (15.4%) |
| 7:30 AM to 7:59 AM | 216 (17.3%) | 180 (13.6%) |
| 8:00 AM to 8:29 AM | 95 (7.6%) | 117 (8.8%) |
| 8:30 AM to 8:59 AM | 136 (10.9%) | 269 (20.3%) |
| 9:00 AM to 9:59 AM | 50 (4.0%) | 171 (12.9%) |
| 10:00 AM to 10:59 AM | 66 (5.3%) | 120 (9.0%) |
| 11:00 AM to 11:59 AM | 21 (1.7%) | 18 (1.4%) |
| 12:00 PM to 3:59 PM | 65 (5.2%) | 0 (0.0%) |
| 4:00 PM to 11:59 PM | 0 (0.0%) | 29 (2.2%) |
| Total | 1,248 (100.0%) | 1,326 (100.0%) |
Housing Occupancy in Solvang
Occupancy by Ownership in Solvang
Of the total 2,459 dwellings in Solvang, owner-occupied units account for 1,358 (55.2%), while renter-occupied units make up 1,101 (44.8%).
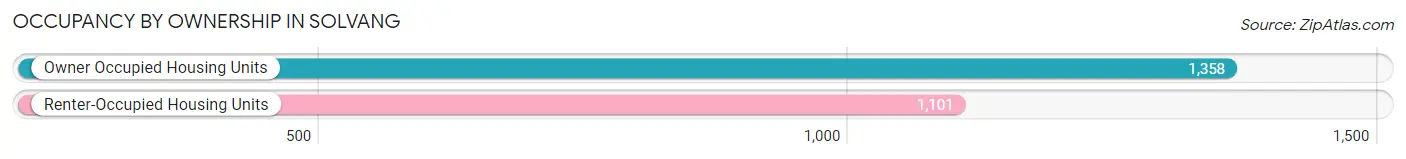
| Occupancy | # Housing Units | % Housing Units |
| Owner Occupied Housing Units | 1,358 | 55.2% |
| Renter-Occupied Housing Units | 1,101 | 44.8% |
| Total Occupied Housing Units | 2,459 | 100.0% |
Occupancy by Household Size in Solvang
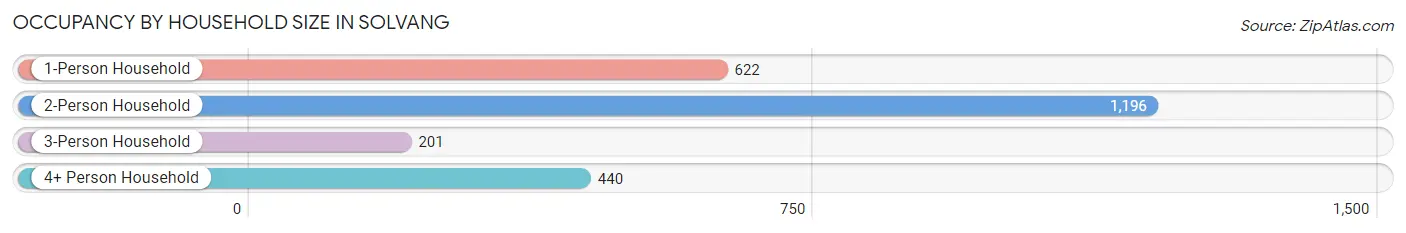
| Household Size | # Housing Units | % Housing Units |
| 1-Person Household | 622 | 25.3% |
| 2-Person Household | 1,196 | 48.6% |
| 3-Person Household | 201 | 8.2% |
| 4+ Person Household | 440 | 17.9% |
| Total Housing Units | 2,459 | 100.0% |
Occupancy by Ownership by Household Size in Solvang
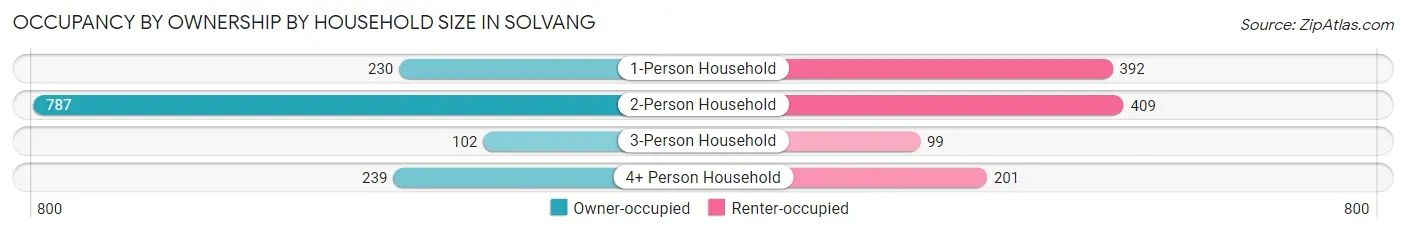
| Household Size | Owner-occupied | Renter-occupied |
| 1-Person Household | 230 (37.0%) | 392 (63.0%) |
| 2-Person Household | 787 (65.8%) | 409 (34.2%) |
| 3-Person Household | 102 (50.7%) | 99 (49.2%) |
| 4+ Person Household | 239 (54.3%) | 201 (45.7%) |
| Total Housing Units | 1,358 (55.2%) | 1,101 (44.8%) |
Occupancy by Educational Attainment in Solvang
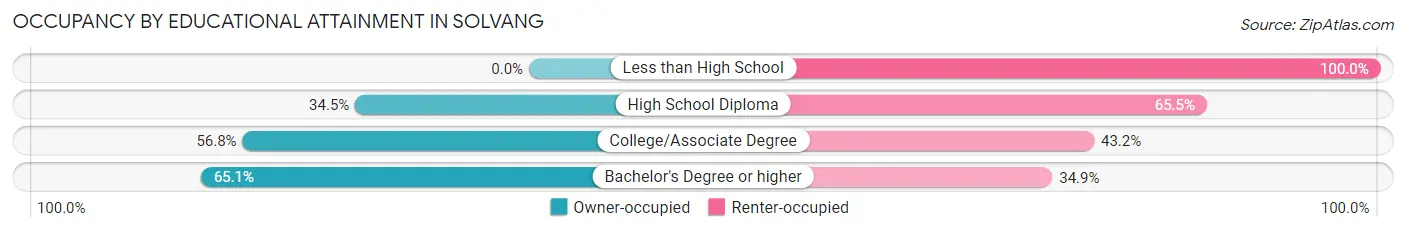
| Household Size | Owner-occupied | Renter-occupied |
| Less than High School | 0 (0.0%) | 79 (100.0%) |
| High School Diploma | 122 (34.5%) | 232 (65.5%) |
| College/Associate Degree | 567 (56.8%) | 431 (43.2%) |
| Bachelor's Degree or higher | 669 (65.1%) | 359 (34.9%) |
Occupancy by Age of Householder in Solvang
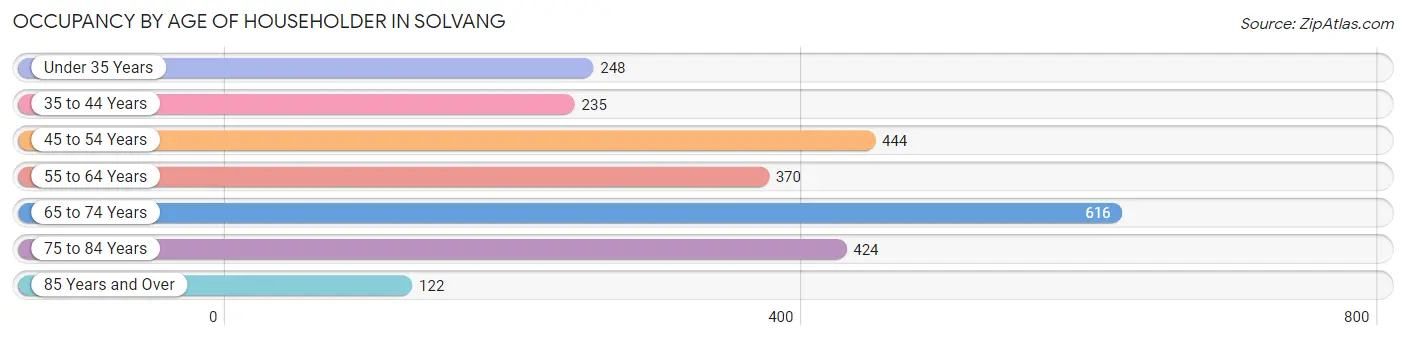
| Age Bracket | # Households | % Households |
| Under 35 Years | 248 | 10.1% |
| 35 to 44 Years | 235 | 9.6% |
| 45 to 54 Years | 444 | 18.1% |
| 55 to 64 Years | 370 | 15.0% |
| 65 to 74 Years | 616 | 25.1% |
| 75 to 84 Years | 424 | 17.2% |
| 85 Years and Over | 122 | 5.0% |
| Total | 2,459 | 100.0% |
Housing Finances in Solvang
Median Income by Occupancy in Solvang
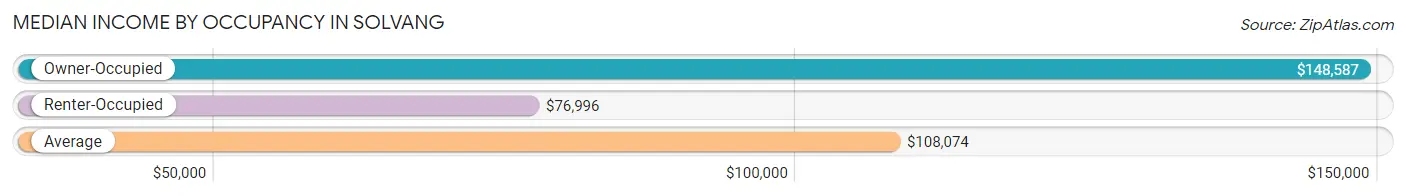
| Occupancy Type | # Households | Median Income |
| Owner-Occupied | 1,358 (55.2%) | $148,587 |
| Renter-Occupied | 1,101 (44.8%) | $76,996 |
| Average | 2,459 (100.0%) | $108,074 |
Occupancy by Householder Income Bracket in Solvang
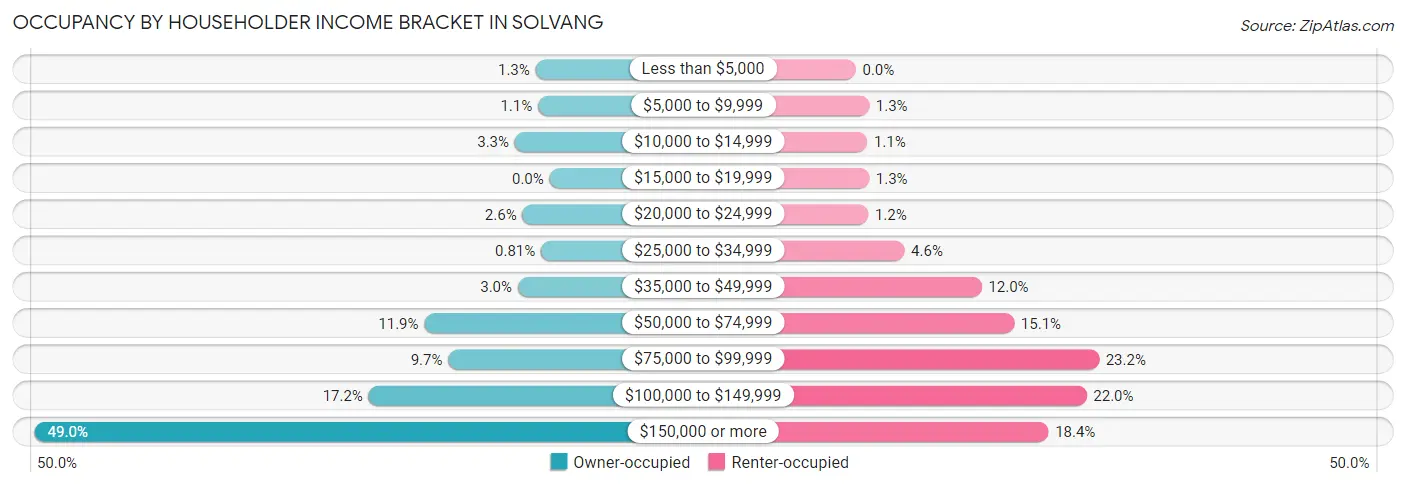
| Income Bracket | Owner-occupied | Renter-occupied |
| Less than $5,000 | 18 (1.3%) | 0 (0.0%) |
| $5,000 to $9,999 | 15 (1.1%) | 14 (1.3%) |
| $10,000 to $14,999 | 45 (3.3%) | 12 (1.1%) |
| $15,000 to $19,999 | 0 (0.0%) | 14 (1.3%) |
| $20,000 to $24,999 | 35 (2.6%) | 13 (1.2%) |
| $25,000 to $34,999 | 11 (0.8%) | 51 (4.6%) |
| $35,000 to $49,999 | 41 (3.0%) | 132 (12.0%) |
| $50,000 to $74,999 | 162 (11.9%) | 166 (15.1%) |
| $75,000 to $99,999 | 131 (9.7%) | 255 (23.2%) |
| $100,000 to $149,999 | 234 (17.2%) | 242 (22.0%) |
| $150,000 or more | 666 (49.0%) | 202 (18.3%) |
| Total | 1,358 (100.0%) | 1,101 (100.0%) |
Monthly Housing Cost Tiers in Solvang
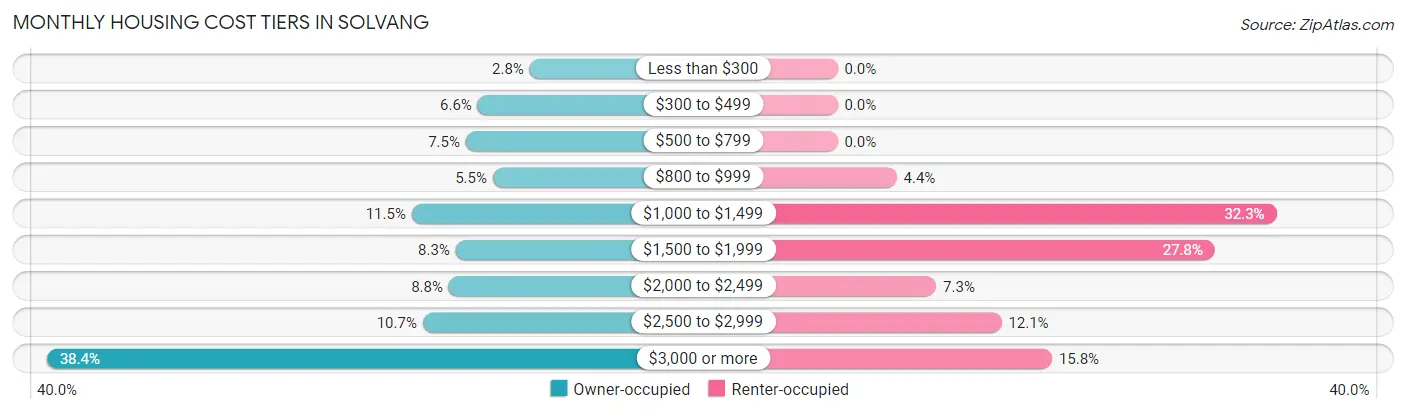
| Monthly Cost | Owner-occupied | Renter-occupied |
| Less than $300 | 38 (2.8%) | 0 (0.0%) |
| $300 to $499 | 90 (6.6%) | 0 (0.0%) |
| $500 to $799 | 102 (7.5%) | 0 (0.0%) |
| $800 to $999 | 75 (5.5%) | 48 (4.4%) |
| $1,000 to $1,499 | 156 (11.5%) | 356 (32.3%) |
| $1,500 to $1,999 | 112 (8.3%) | 306 (27.8%) |
| $2,000 to $2,499 | 119 (8.8%) | 80 (7.3%) |
| $2,500 to $2,999 | 145 (10.7%) | 133 (12.1%) |
| $3,000 or more | 521 (38.4%) | 174 (15.8%) |
| Total | 1,358 (100.0%) | 1,101 (100.0%) |
Physical Housing Characteristics in Solvang
Housing Structures in Solvang
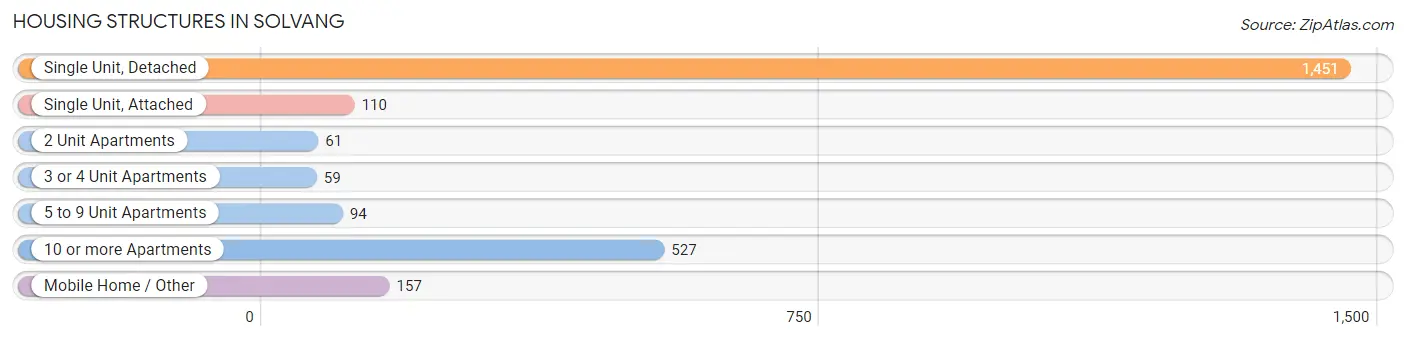
| Structure Type | # Housing Units | % Housing Units |
| Single Unit, Detached | 1,451 | 59.0% |
| Single Unit, Attached | 110 | 4.5% |
| 2 Unit Apartments | 61 | 2.5% |
| 3 or 4 Unit Apartments | 59 | 2.4% |
| 5 to 9 Unit Apartments | 94 | 3.8% |
| 10 or more Apartments | 527 | 21.4% |
| Mobile Home / Other | 157 | 6.4% |
| Total | 2,459 | 100.0% |
Housing Structures by Occupancy in Solvang
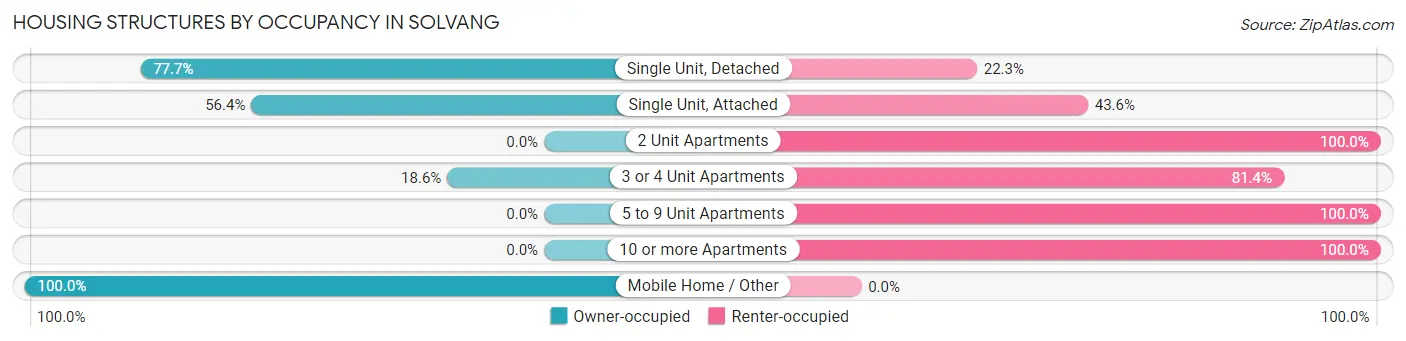
| Structure Type | Owner-occupied | Renter-occupied |
| Single Unit, Detached | 1,128 (77.7%) | 323 (22.3%) |
| Single Unit, Attached | 62 (56.4%) | 48 (43.6%) |
| 2 Unit Apartments | 0 (0.0%) | 61 (100.0%) |
| 3 or 4 Unit Apartments | 11 (18.6%) | 48 (81.4%) |
| 5 to 9 Unit Apartments | 0 (0.0%) | 94 (100.0%) |
| 10 or more Apartments | 0 (0.0%) | 527 (100.0%) |
| Mobile Home / Other | 157 (100.0%) | 0 (0.0%) |
| Total | 1,358 (55.2%) | 1,101 (44.8%) |
Housing Structures by Number of Rooms in Solvang
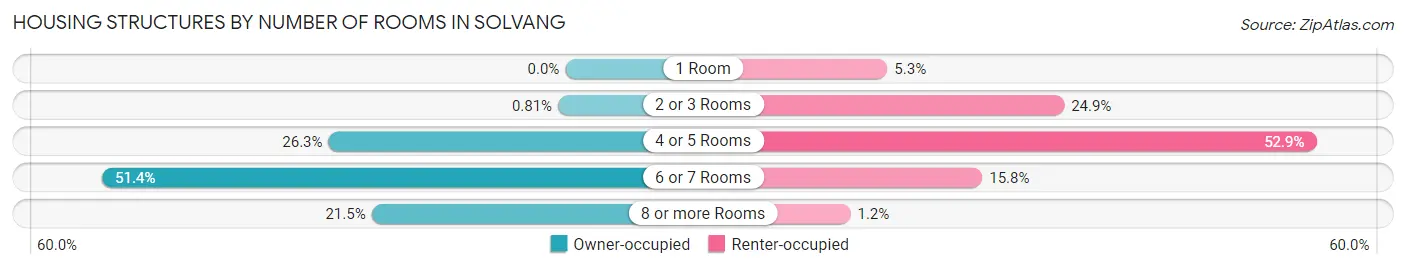
| Number of Rooms | Owner-occupied | Renter-occupied |
| 1 Room | 0 (0.0%) | 58 (5.3%) |
| 2 or 3 Rooms | 11 (0.8%) | 274 (24.9%) |
| 4 or 5 Rooms | 357 (26.3%) | 582 (52.9%) |
| 6 or 7 Rooms | 698 (51.4%) | 174 (15.8%) |
| 8 or more Rooms | 292 (21.5%) | 13 (1.2%) |
| Total | 1,358 (100.0%) | 1,101 (100.0%) |
Housing Structure by Heating Type in Solvang
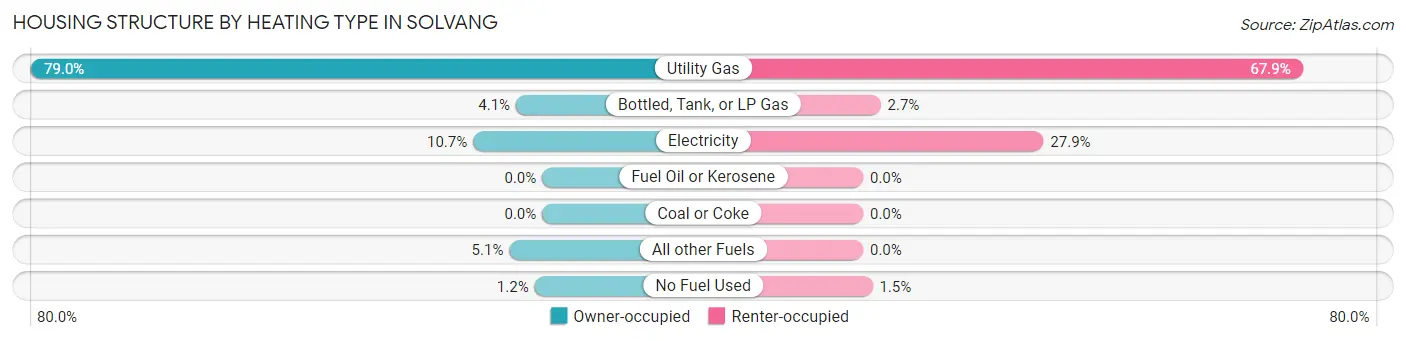
| Heating Type | Owner-occupied | Renter-occupied |
| Utility Gas | 1,073 (79.0%) | 748 (67.9%) |
| Bottled, Tank, or LP Gas | 55 (4.1%) | 30 (2.7%) |
| Electricity | 145 (10.7%) | 307 (27.9%) |
| Fuel Oil or Kerosene | 0 (0.0%) | 0 (0.0%) |
| Coal or Coke | 0 (0.0%) | 0 (0.0%) |
| All other Fuels | 69 (5.1%) | 0 (0.0%) |
| No Fuel Used | 16 (1.2%) | 16 (1.5%) |
| Total | 1,358 (100.0%) | 1,101 (100.0%) |
Household Vehicle Usage in Solvang
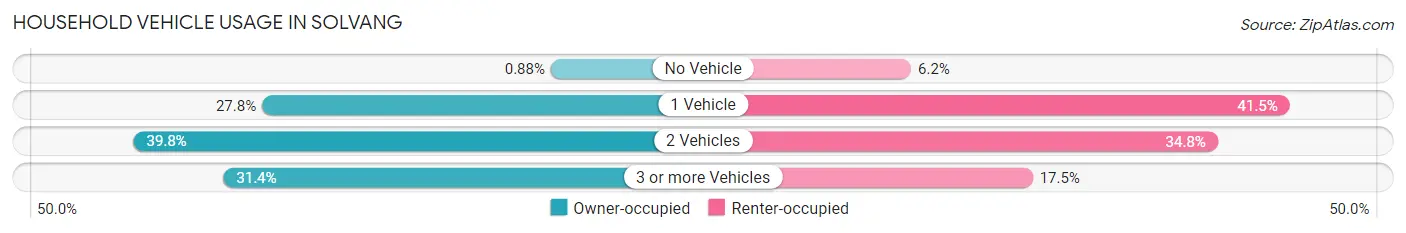
| Vehicles per Household | Owner-occupied | Renter-occupied |
| No Vehicle | 12 (0.9%) | 68 (6.2%) |
| 1 Vehicle | 378 (27.8%) | 457 (41.5%) |
| 2 Vehicles | 541 (39.8%) | 383 (34.8%) |
| 3 or more Vehicles | 427 (31.4%) | 193 (17.5%) |
| Total | 1,358 (100.0%) | 1,101 (100.0%) |
Real Estate & Mortgages in Solvang
Real Estate and Mortgage Overview in Solvang
| Characteristic | Without Mortgage | With Mortgage |
| Housing Units | 530 | 828 |
| Median Property Value | $744,000 | $936,300 |
| Median Household Income | $90,313 | $558 |
| Monthly Housing Costs | $855 | $521 |
| Real Estate Taxes | $5,547 | $0 |
Property Value by Mortgage Status in Solvang
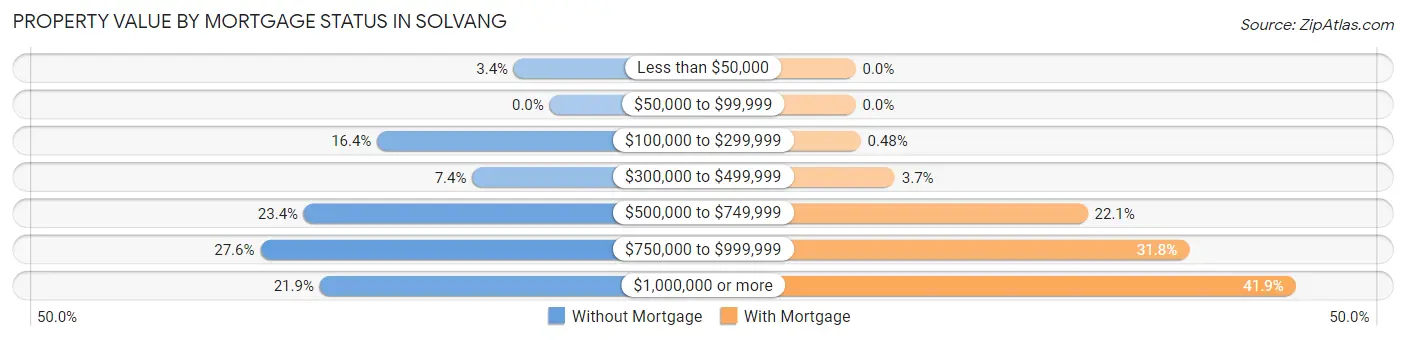
| Property Value | Without Mortgage | With Mortgage |
| Less than $50,000 | 18 (3.4%) | 0 (0.0%) |
| $50,000 to $99,999 | 0 (0.0%) | 0 (0.0%) |
| $100,000 to $299,999 | 87 (16.4%) | 4 (0.5%) |
| $300,000 to $499,999 | 39 (7.4%) | 31 (3.7%) |
| $500,000 to $749,999 | 124 (23.4%) | 183 (22.1%) |
| $750,000 to $999,999 | 146 (27.6%) | 263 (31.8%) |
| $1,000,000 or more | 116 (21.9%) | 347 (41.9%) |
| Total | 530 (100.0%) | 828 (100.0%) |
Household Income by Mortgage Status in Solvang
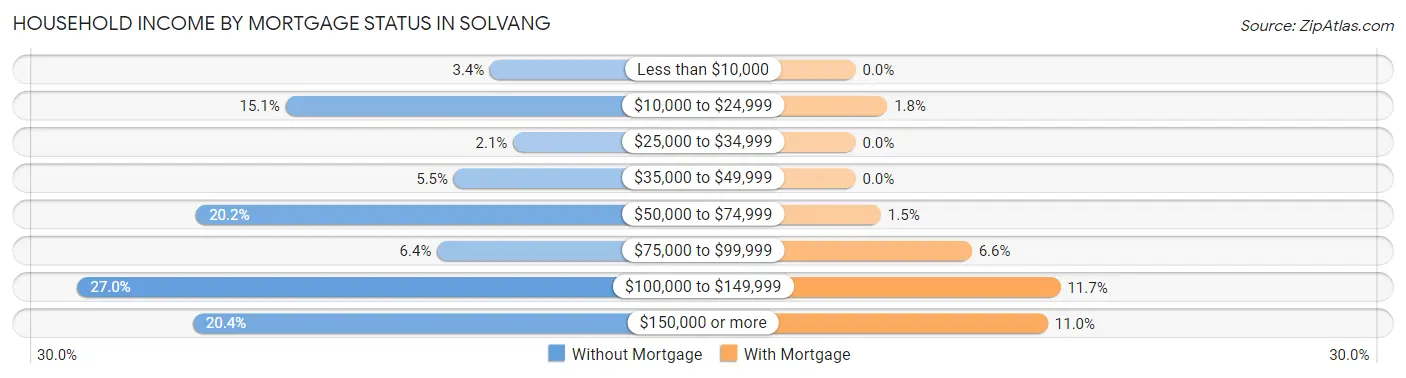
| Household Income | Without Mortgage | With Mortgage |
| Less than $10,000 | 18 (3.4%) | 0 (0.0%) |
| $10,000 to $24,999 | 80 (15.1%) | 15 (1.8%) |
| $25,000 to $34,999 | 11 (2.1%) | 0 (0.0%) |
| $35,000 to $49,999 | 29 (5.5%) | 0 (0.0%) |
| $50,000 to $74,999 | 107 (20.2%) | 12 (1.5%) |
| $75,000 to $99,999 | 34 (6.4%) | 55 (6.6%) |
| $100,000 to $149,999 | 143 (27.0%) | 97 (11.7%) |
| $150,000 or more | 108 (20.4%) | 91 (11.0%) |
| Total | 530 (100.0%) | 828 (100.0%) |
Property Value to Household Income Ratio in Solvang
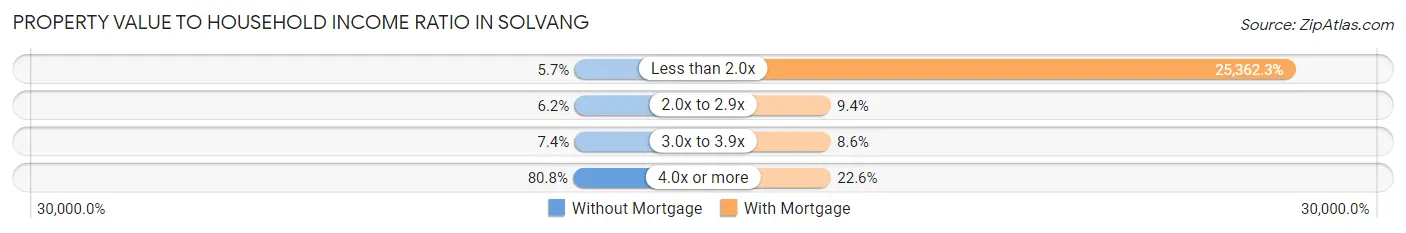
| Value-to-Income Ratio | Without Mortgage | With Mortgage |
| Less than 2.0x | 30 (5.7%) | 210,000 (25,362.3%) |
| 2.0x to 2.9x | 33 (6.2%) | 78 (9.4%) |
| 3.0x to 3.9x | 39 (7.4%) | 71 (8.6%) |
| 4.0x or more | 428 (80.7%) | 187 (22.6%) |
| Total | 530 (100.0%) | 828 (100.0%) |
Real Estate Taxes by Mortgage Status in Solvang
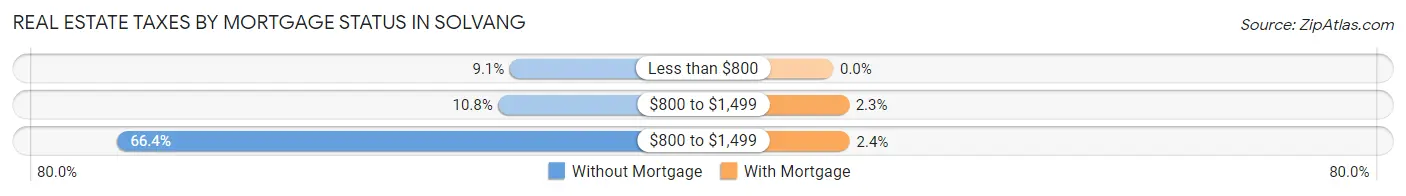
| Property Taxes | Without Mortgage | With Mortgage |
| Less than $800 | 48 (9.1%) | 0 (0.0%) |
| $800 to $1,499 | 57 (10.7%) | 19 (2.3%) |
| $800 to $1,499 | 352 (66.4%) | 20 (2.4%) |
| Total | 530 (100.0%) | 828 (100.0%) |
Health & Disability in Solvang
Health Insurance Coverage by Age in Solvang
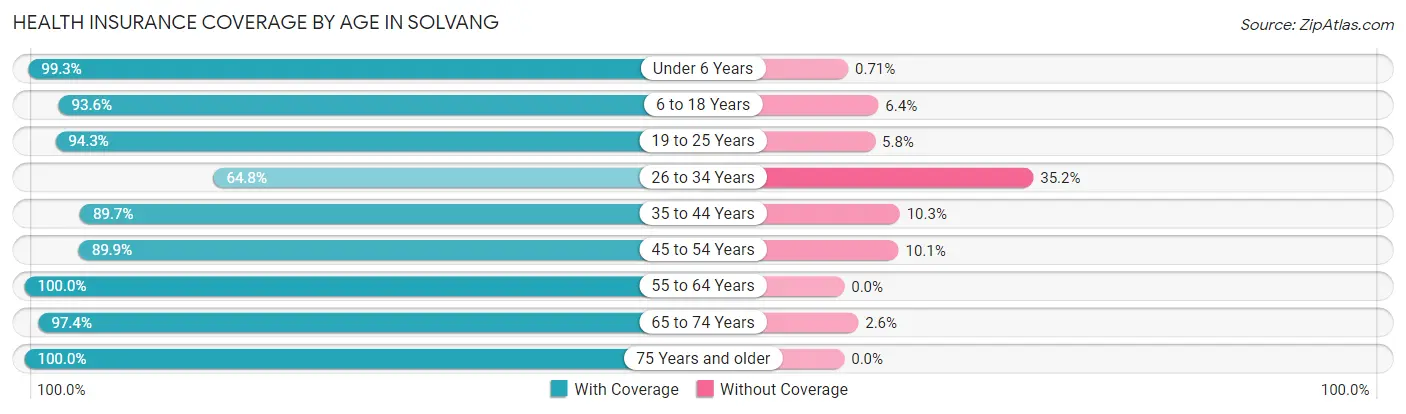
| Age Bracket | With Coverage | Without Coverage |
| Under 6 Years | 140 (99.3%) | 1 (0.7%) |
| 6 to 18 Years | 868 (93.6%) | 59 (6.4%) |
| 19 to 25 Years | 377 (94.3%) | 23 (5.8%) |
| 26 to 34 Years | 351 (64.8%) | 191 (35.2%) |
| 35 to 44 Years | 520 (89.7%) | 60 (10.3%) |
| 45 to 54 Years | 684 (89.9%) | 77 (10.1%) |
| 55 to 64 Years | 859 (100.0%) | 0 (0.0%) |
| 65 to 74 Years | 1,006 (97.4%) | 27 (2.6%) |
| 75 Years and older | 732 (100.0%) | 0 (0.0%) |
| Total | 5,537 (92.7%) | 438 (7.3%) |
Health Insurance Coverage by Citizenship Status in Solvang
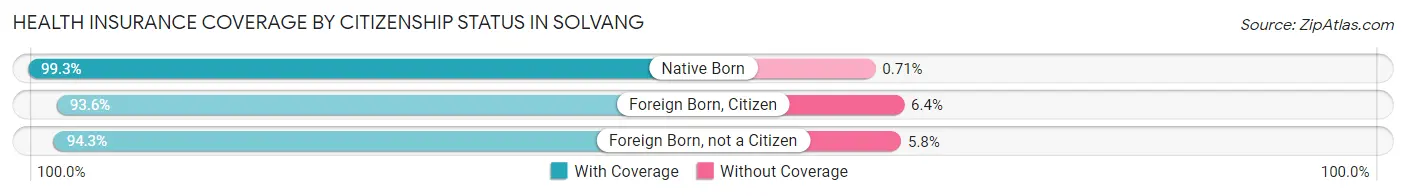
| Citizenship Status | With Coverage | Without Coverage |
| Native Born | 140 (99.3%) | 1 (0.7%) |
| Foreign Born, Citizen | 868 (93.6%) | 59 (6.4%) |
| Foreign Born, not a Citizen | 377 (94.3%) | 23 (5.8%) |
Health Insurance Coverage by Household Income in Solvang
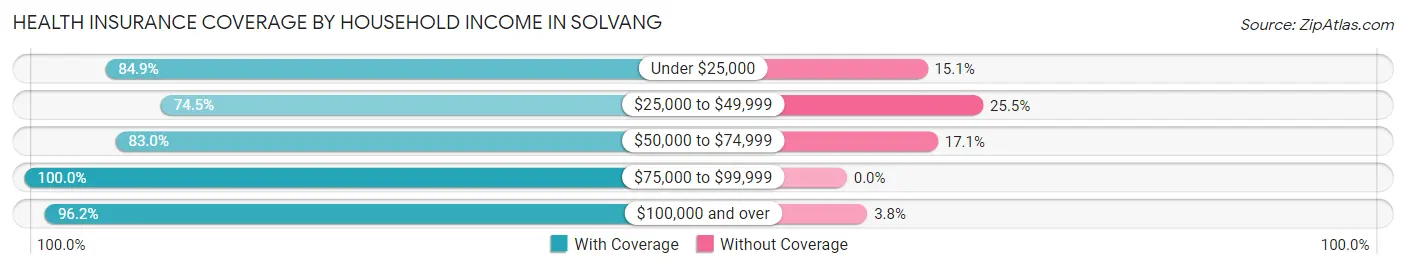
| Household Income | With Coverage | Without Coverage |
| Under $25,000 | 219 (84.9%) | 39 (15.1%) |
| $25,000 to $49,999 | 411 (74.5%) | 141 (25.5%) |
| $50,000 to $74,999 | 540 (83.0%) | 111 (17.1%) |
| $75,000 to $99,999 | 694 (100.0%) | 0 (0.0%) |
| $100,000 and over | 3,665 (96.2%) | 146 (3.8%) |
Public vs Private Health Insurance Coverage by Age in Solvang
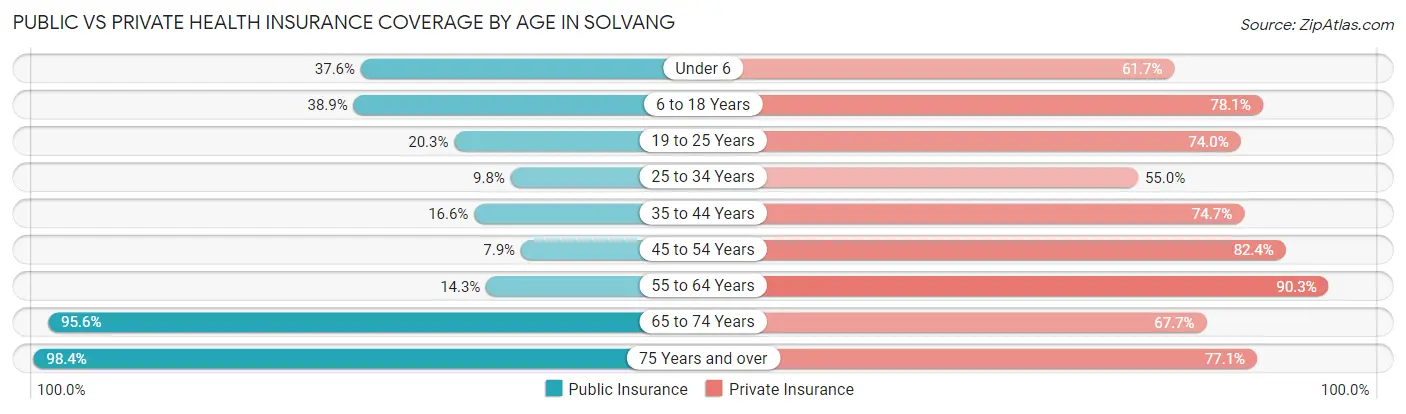
| Age Bracket | Public Insurance | Private Insurance |
| Under 6 | 53 (37.6%) | 87 (61.7%) |
| 6 to 18 Years | 361 (38.9%) | 724 (78.1%) |
| 19 to 25 Years | 81 (20.3%) | 296 (74.0%) |
| 25 to 34 Years | 53 (9.8%) | 298 (55.0%) |
| 35 to 44 Years | 96 (16.6%) | 433 (74.7%) |
| 45 to 54 Years | 60 (7.9%) | 627 (82.4%) |
| 55 to 64 Years | 123 (14.3%) | 776 (90.3%) |
| 65 to 74 Years | 988 (95.6%) | 699 (67.7%) |
| 75 Years and over | 720 (98.4%) | 564 (77.0%) |
| Total | 2,535 (42.4%) | 4,504 (75.4%) |
Disability Status by Sex by Age in Solvang
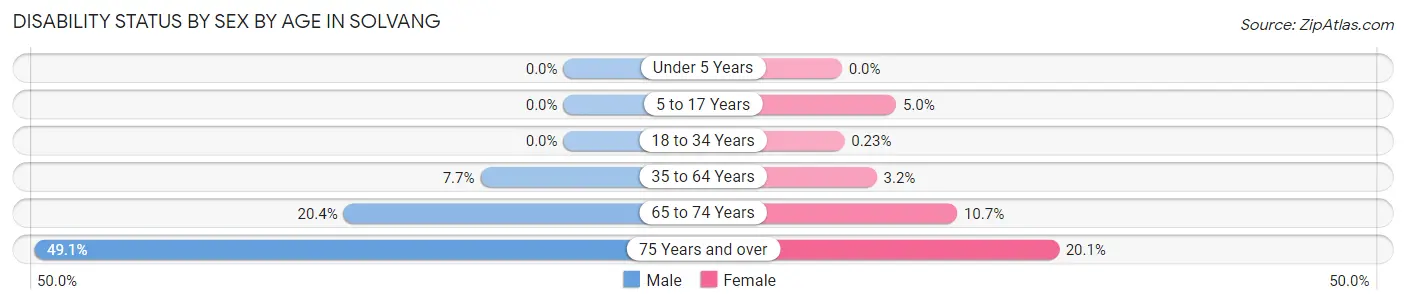
| Age Bracket | Male | Female |
| Under 5 Years | 0 (0.0%) | 0 (0.0%) |
| 5 to 17 Years | 0 (0.0%) | 25 (5.0%) |
| 18 to 34 Years | 0 (0.0%) | 1 (0.2%) |
| 35 to 64 Years | 74 (7.7%) | 40 (3.2%) |
| 65 to 74 Years | 81 (20.4%) | 68 (10.7%) |
| 75 Years and over | 140 (49.1%) | 90 (20.1%) |
Disability Class by Sex by Age in Solvang
Disability Class: Hearing Difficulty
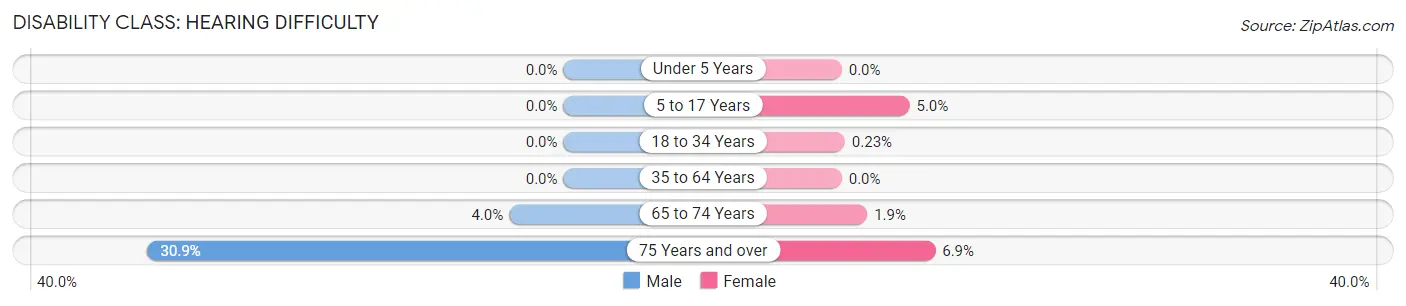
| Age Bracket | Male | Female |
| Under 5 Years | 0 (0.0%) | 0 (0.0%) |
| 5 to 17 Years | 0 (0.0%) | 25 (5.0%) |
| 18 to 34 Years | 0 (0.0%) | 1 (0.2%) |
| 35 to 64 Years | 0 (0.0%) | 0 (0.0%) |
| 65 to 74 Years | 16 (4.0%) | 12 (1.9%) |
| 75 Years and over | 88 (30.9%) | 31 (6.9%) |
Disability Class: Vision Difficulty
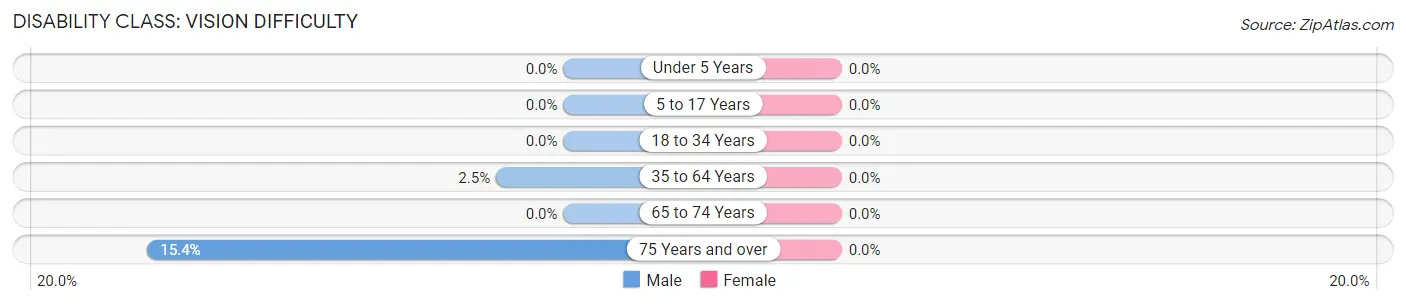
| Age Bracket | Male | Female |
| Under 5 Years | 0 (0.0%) | 0 (0.0%) |
| 5 to 17 Years | 0 (0.0%) | 0 (0.0%) |
| 18 to 34 Years | 0 (0.0%) | 0 (0.0%) |
| 35 to 64 Years | 24 (2.5%) | 0 (0.0%) |
| 65 to 74 Years | 0 (0.0%) | 0 (0.0%) |
| 75 Years and over | 44 (15.4%) | 0 (0.0%) |
Disability Class: Cognitive Difficulty
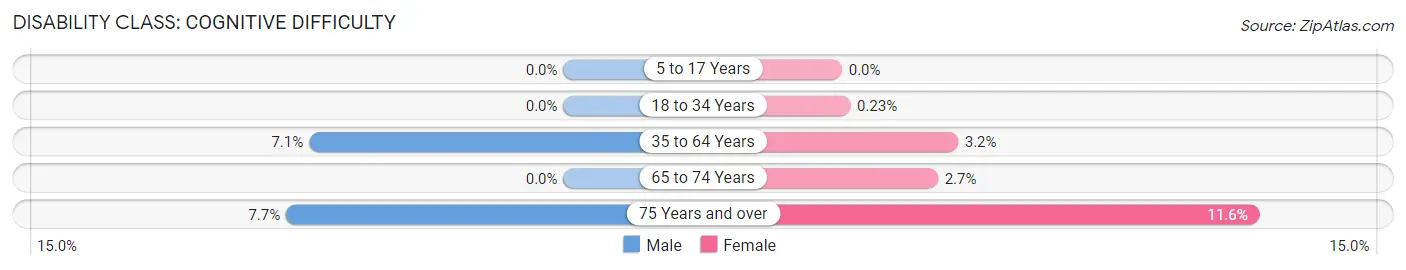
| Age Bracket | Male | Female |
| 5 to 17 Years | 0 (0.0%) | 0 (0.0%) |
| 18 to 34 Years | 0 (0.0%) | 1 (0.2%) |
| 35 to 64 Years | 68 (7.1%) | 40 (3.2%) |
| 65 to 74 Years | 0 (0.0%) | 17 (2.7%) |
| 75 Years and over | 22 (7.7%) | 52 (11.6%) |
Disability Class: Ambulatory Difficulty
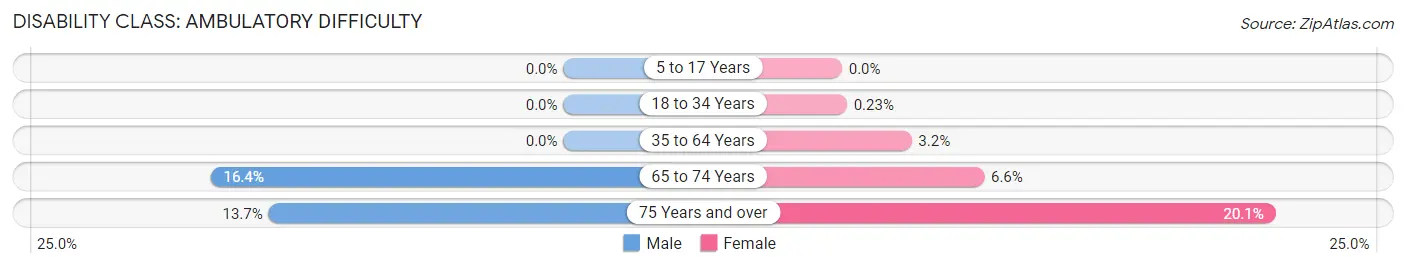
| Age Bracket | Male | Female |
| 5 to 17 Years | 0 (0.0%) | 0 (0.0%) |
| 18 to 34 Years | 0 (0.0%) | 1 (0.2%) |
| 35 to 64 Years | 0 (0.0%) | 40 (3.2%) |
| 65 to 74 Years | 65 (16.4%) | 42 (6.6%) |
| 75 Years and over | 39 (13.7%) | 90 (20.1%) |
Disability Class: Self-Care Difficulty
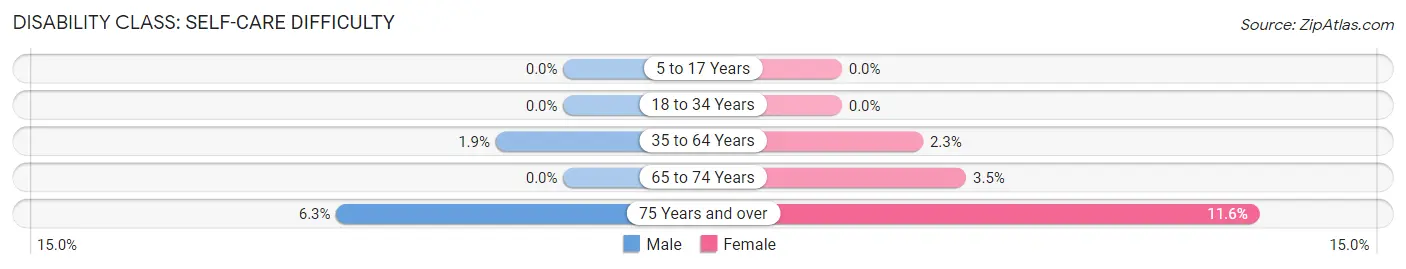
| Age Bracket | Male | Female |
| 5 to 17 Years | 0 (0.0%) | 0 (0.0%) |
| 18 to 34 Years | 0 (0.0%) | 0 (0.0%) |
| 35 to 64 Years | 18 (1.9%) | 28 (2.3%) |
| 65 to 74 Years | 0 (0.0%) | 22 (3.5%) |
| 75 Years and over | 18 (6.3%) | 52 (11.6%) |
Technology Access in Solvang
Computing Device Access in Solvang
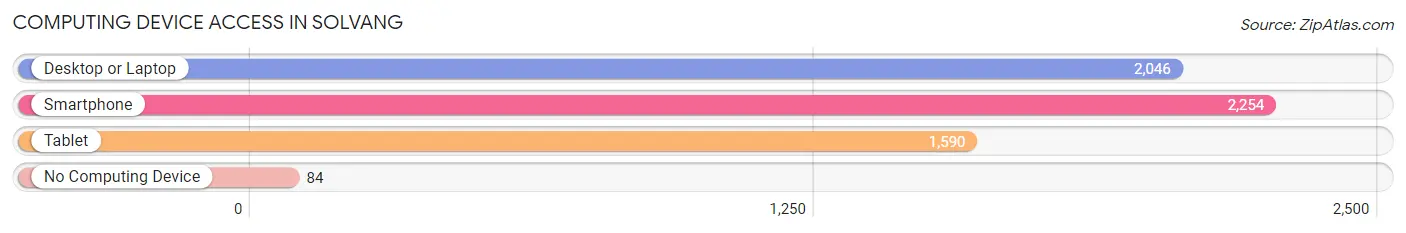
| Device Type | # Households | % Households |
| Desktop or Laptop | 2,046 | 83.2% |
| Smartphone | 2,254 | 91.7% |
| Tablet | 1,590 | 64.7% |
| No Computing Device | 84 | 3.4% |
| Total | 2,459 | 100.0% |
Internet Access in Solvang
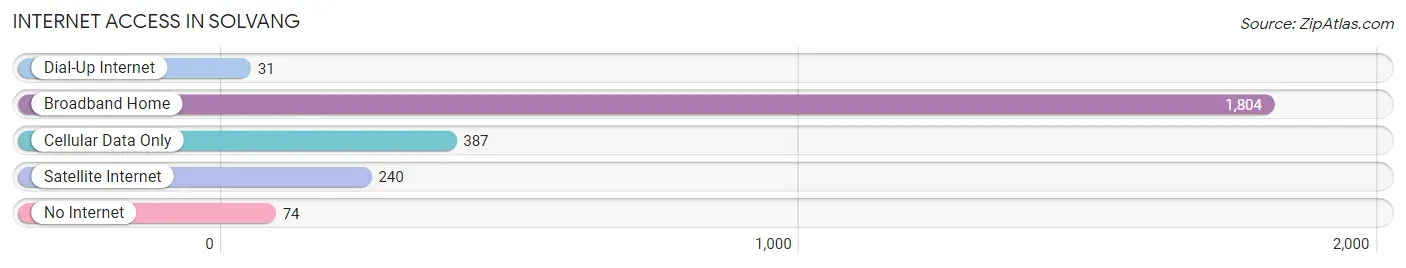
| Internet Type | # Households | % Households |
| Dial-Up Internet | 31 | 1.3% |
| Broadband Home | 1,804 | 73.4% |
| Cellular Data Only | 387 | 15.7% |
| Satellite Internet | 240 | 9.8% |
| No Internet | 74 | 3.0% |
| Total | 2,459 | 100.0% |
Solvang Summary
Solvang, California is a small city located in the Santa Ynez Valley of Santa Barbara County. It is known for its Danish-style architecture and culture, and is a popular tourist destination. The city was founded in 1911 by a group of Danish-Americans who wanted to create a Danish-style village in the United States.
History
Solvang was founded in 1911 by a group of Danish-Americans who wanted to create a Danish-style village in the United States. The city was named after the Danish city of Solvang, which means “sunny field” in Danish. The founders of Solvang wanted to create a place where Danish immigrants could live and work, and where they could preserve their culture and language.
The city was officially incorporated in 1985, and has since become a popular tourist destination. The city is known for its Danish-style architecture, which includes windmills, thatched roofs, and half-timbered buildings. The city also has a number of Danish-style restaurants, bakeries, and shops.
Geography
Solvang is located in the Santa Ynez Valley of Santa Barbara County, California. The city is situated on the Santa Ynez River, and is surrounded by rolling hills and vineyards. The city is located about 30 miles north of Santa Barbara, and about 90 miles northwest of Los Angeles.
The climate in Solvang is Mediterranean, with warm, dry summers and mild, wet winters. The average temperature in the summer is around 75°F, and the average temperature in the winter is around 55°F.
Economy
The economy of Solvang is largely based on tourism. The city is a popular destination for visitors from all over the world, who come to experience the city’s Danish-style architecture and culture. The city also has a number of wineries, restaurants, and shops that cater to tourists.
In addition to tourism, Solvang is also home to a number of businesses, including a number of technology companies. The city is also home to a number of agricultural businesses, including wineries, olive oil producers, and fruit growers.
Demographics
As of the 2010 census, the population of Solvang was 5,245. The racial makeup of the city was 87.3% White, 0.7% African American, 0.3% Native American, 0.9% Asian, 0.1% Pacific Islander, 8.2% from other races, and 2.5% from two or more races. The median household income in the city was $60,945, and the median family income was $71,945.
Solvang is a diverse city, with a large population of Danish-Americans. The city also has a large population of Hispanic and Latino residents, as well as a small population of Asian-Americans. The city is also home to a number of other ethnic groups, including German, Irish, Italian, and French.
Common Questions
What is Per Capita Income in Solvang?
Per Capita income in Solvang is $65,211.
What is the Median Family Income in Solvang?
Median Family Income in Solvang is $130,595.
What is the Median Household income in Solvang?
Median Household Income in Solvang is $108,074.
What is Income or Wage Gap in Solvang?
Income or Wage Gap in Solvang is 28.7%.
Women in Solvang earn 71.3 cents for every dollar earned by a man.
What is Inequality or Gini Index in Solvang?
Inequality or Gini Index in Solvang is 0.45.
What is the Total Population of Solvang?
Total Population of Solvang is 6,035.
What is the Total Male Population of Solvang?
Total Male Population of Solvang is 2,708.
What is the Total Female Population of Solvang?
Total Female Population of Solvang is 3,327.
What is the Ratio of Males per 100 Females in Solvang?
There are 81.39 Males per 100 Females in Solvang.
What is the Ratio of Females per 100 Males in Solvang?
There are 122.86 Females per 100 Males in Solvang.
What is the Median Population Age in Solvang?
Median Population Age in Solvang is 50.6 Years.
What is the Average Family Size in Solvang
Average Family Size in Solvang is 2.9 People.
What is the Average Household Size in Solvang
Average Household Size in Solvang is 2.4 People.
How Large is the Labor Force in Solvang?
There are 3,139 People in the Labor Forcein in Solvang.
What is the Percentage of People in the Labor Force in Solvang?
61.5% of People are in the Labor Force in Solvang.
What is the Unemployment Rate in Solvang?
Unemployment Rate in Solvang is 4.2%.