Cities with the Highest Percentage of Population Employed in Material Moving in Puerto Rico
RELATED REPORTS & OPTIONS
Material Moving
Puerto Rico
Compare Cities
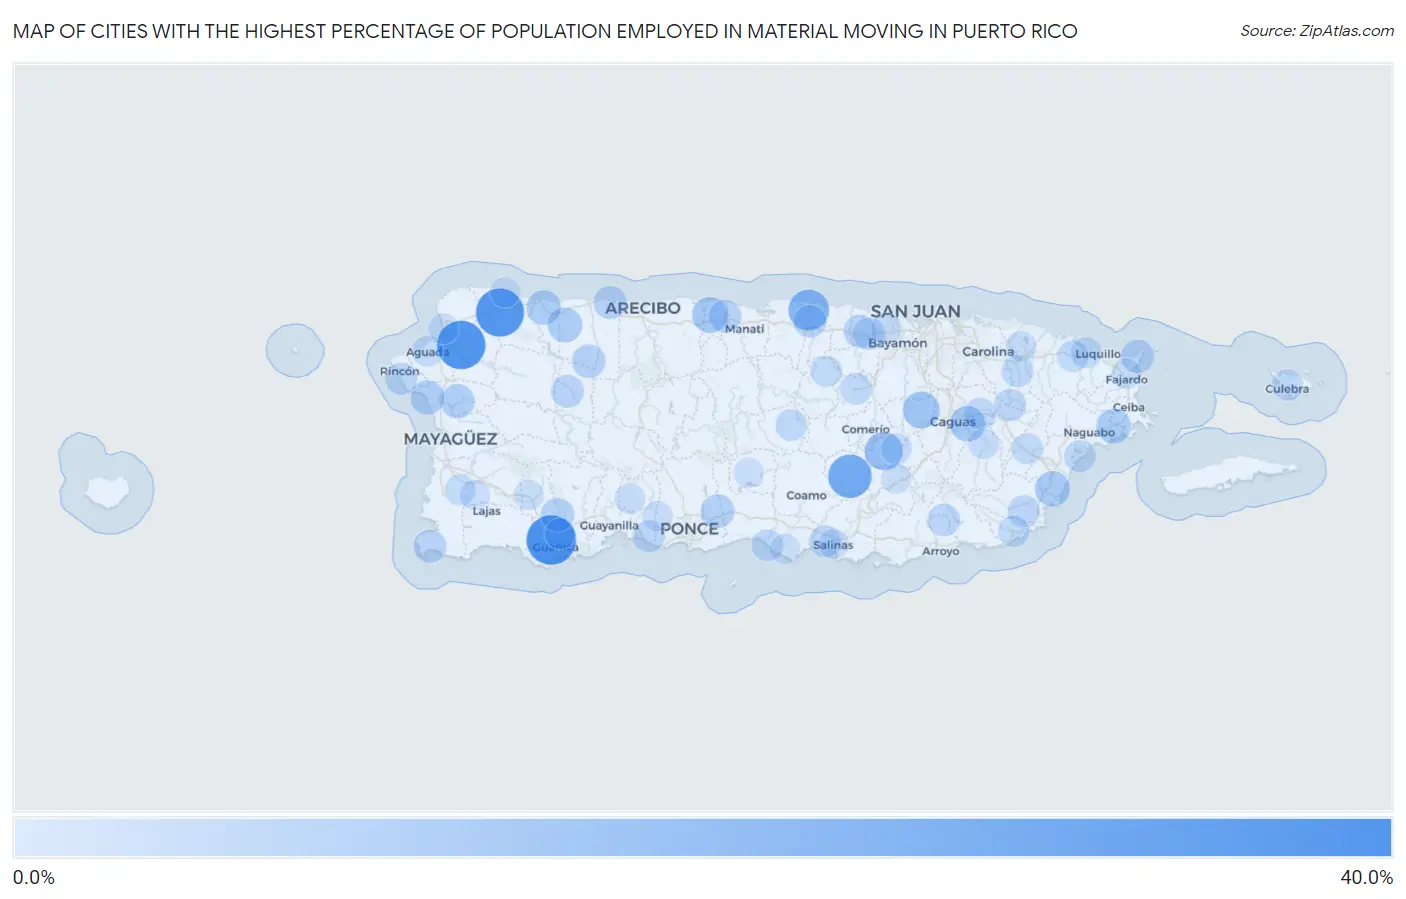
Map of Cities with the Highest Percentage of Population Employed in Material Moving in Puerto Rico
0.0%
40.0%
Cities with the Highest Percentage of Population Employed in Material Moving in Puerto Rico
| City | % Employed | vs State | vs National | |
| 1. | Fuig | 38.0% | 3.1%(+34.9)#1 | 3.8%(+34.2)#183 |
| 2. | Moca | 36.1% | 3.1%(+33.0)#2 | 3.8%(+32.3)#203 |
| 3. | Mora | 35.6% | 3.1%(+32.5)#3 | 3.8%(+31.8)#212 |
| 4. | Cambalache | 27.5% | 3.1%(+24.4)#4 | 3.8%(+23.6)#370 |
| 5. | Pastos | 27.3% | 3.1%(+24.2)#5 | 3.8%(+23.5)#375 |
| 6. | Villa Esperanza | 25.3% | 3.1%(+22.2)#6 | 3.8%(+21.4)#433 |
| 7. | Sabana | 22.6% | 3.1%(+19.5)#7 | 3.8%(+18.7)#563 |
| 8. | Rosa Sanchez | 18.6% | 3.1%(+15.5)#8 | 3.8%(+14.8)#842 |
| 9. | Parcelas La Milagrosa | 17.7% | 3.1%(+14.6)#9 | 3.8%(+13.9)#936 |
| 10. | Toaville | 17.2% | 3.1%(+14.1)#10 | 3.8%(+13.4)#1,012 |
| 11. | Parcelas Penuelas | 15.6% | 3.1%(+12.5)#11 | 3.8%(+11.8)#1,260 |
| 12. | Aguas Buenas | 15.6% | 3.1%(+12.5)#12 | 3.8%(+11.7)#1,264 |
| 13. | Palmarejo | 14.3% | 3.1%(+11.2)#13 | 3.8%(+10.5)#1,524 |
| 14. | Garrochales | 14.0% | 3.1%(+10.9)#14 | 3.8%(+10.1)#1,619 |
| 15. | Rincón | 13.6% | 3.1%(+10.5)#15 | 3.8%(+9.75)#1,744 |
| 16. | Parcelas De Navarro | 13.2% | 3.1%(+10.1)#16 | 3.8%(+9.36)#1,858 |
| 17. | Candelero Abajo | 12.8% | 3.1%(+9.73)#17 | 3.8%(+9.01)#1,985 |
| 18. | Piedra Gorda | 12.1% | 3.1%(+9.01)#18 | 3.8%(+8.29)#2,245 |
| 19. | Daguao | 12.0% | 3.1%(+8.85)#19 | 3.8%(+8.13)#2,305 |
| 20. | Villa Quintero | 11.9% | 3.1%(+8.80)#20 | 3.8%(+8.07)#2,323 |
| 21. | El Veintiséis | 11.8% | 3.1%(+8.69)#21 | 3.8%(+7.96)#2,372 |
| 22. | Quebradillas | 11.7% | 3.1%(+8.62)#22 | 3.8%(+7.90)#2,410 |
| 23. | Bayamon | 11.6% | 3.1%(+8.49)#23 | 3.8%(+7.77)#2,457 |
| 24. | Palma Sola | 11.4% | 3.1%(+8.29)#24 | 3.8%(+7.57)#2,538 |
| 25. | Palomas Comunidad Yauco Municipio | 11.2% | 3.1%(+8.05)#25 | 3.8%(+7.32)#2,654 |
| 26. | Espino | 11.1% | 3.1%(+8.00)#26 | 3.8%(+7.28)#2,664 |
| 27. | La Playa | 11.1% | 3.1%(+7.95)#27 | 3.8%(+7.23)#2,703 |
| 28. | Coto Laurel | 10.4% | 3.1%(+7.26)#28 | 3.8%(+6.54)#3,067 |
| 29. | Palomas Comunidad Comerio Municipio | 10.3% | 3.1%(+7.22)#29 | 3.8%(+6.49)#3,093 |
| 30. | Lluveras | 10.1% | 3.1%(+7.03)#30 | 3.8%(+6.30)#3,201 |
| 31. | Quebrada | 10.1% | 3.1%(+6.98)#31 | 3.8%(+6.26)#3,234 |
| 32. | Rafael Hernandez | 9.6% | 3.1%(+6.53)#32 | 3.8%(+5.81)#3,548 |
| 33. | Las Croabas | 9.6% | 3.1%(+6.51)#33 | 3.8%(+5.79)#3,569 |
| 34. | Carrizales | 9.5% | 3.1%(+6.38)#34 | 3.8%(+5.66)#3,659 |
| 35. | Villa Calma | 9.3% | 3.1%(+6.18)#35 | 3.8%(+5.45)#3,835 |
| 36. | San Antonio Comunidad Quebradillas Municipio | 9.1% | 3.1%(+5.95)#36 | 3.8%(+5.23)#4,031 |
| 37. | Pole Ojea | 9.0% | 3.1%(+5.94)#37 | 3.8%(+5.22)#4,037 |
| 38. | Campanilla | 8.9% | 3.1%(+5.75)#38 | 3.8%(+5.03)#4,180 |
| 39. | Ceiba | 8.9% | 3.1%(+5.75)#39 | 3.8%(+5.03)#4,184 |
| 40. | Lares | 8.8% | 3.1%(+5.72)#40 | 3.8%(+5.00)#4,206 |
| 41. | Barceloneta | 8.7% | 3.1%(+5.55)#41 | 3.8%(+4.83)#4,350 |
| 42. | Jaguas | 8.5% | 3.1%(+5.43)#42 | 3.8%(+4.71)#4,468 |
| 43. | Yaurel | 8.4% | 3.1%(+5.33)#43 | 3.8%(+4.60)#4,568 |
| 44. | Lomas | 8.0% | 3.1%(+4.86)#44 | 3.8%(+4.14)#5,068 |
| 45. | Candelaria Arenas | 7.9% | 3.1%(+4.83)#45 | 3.8%(+4.11)#5,110 |
| 46. | Boqueron Comunidad Las Piedras Municipio | 7.9% | 3.1%(+4.82)#46 | 3.8%(+4.09)#5,132 |
| 47. | Stella | 7.9% | 3.1%(+4.76)#47 | 3.8%(+4.03)#5,210 |
| 48. | Yabucoa | 7.5% | 3.1%(+4.43)#48 | 3.8%(+3.71)#5,635 |
| 49. | Las Ochenta | 7.5% | 3.1%(+4.41)#49 | 3.8%(+3.69)#5,656 |
| 50. | Tallaboa | 7.5% | 3.1%(+4.34)#50 | 3.8%(+3.62)#5,740 |
| 51. | Gurabo | 7.3% | 3.1%(+4.16)#51 | 3.8%(+3.43)#6,002 |
| 52. | Naranjito | 7.3% | 3.1%(+4.16)#52 | 3.8%(+3.43)#6,009 |
| 53. | Maria Antonia | 7.3% | 3.1%(+4.14)#53 | 3.8%(+3.42)#6,024 |
| 54. | Campo Rico | 7.2% | 3.1%(+4.11)#54 | 3.8%(+3.38)#6,065 |
| 55. | Playita Cortada | 7.0% | 3.1%(+3.94)#55 | 3.8%(+3.21)#6,308 |
| 56. | Voladoras | 7.0% | 3.1%(+3.90)#56 | 3.8%(+3.18)#6,371 |
| 57. | Punta Santiago | 7.0% | 3.1%(+3.89)#57 | 3.8%(+3.17)#6,380 |
| 58. | Orocovis | 7.0% | 3.1%(+3.86)#58 | 3.8%(+3.13)#6,442 |
| 59. | Playita Comunidad Yabucoa Municipio | 6.9% | 3.1%(+3.80)#59 | 3.8%(+3.08)#6,527 |
| 60. | Comerio | 6.8% | 3.1%(+3.74)#60 | 3.8%(+3.02)#6,612 |
| 61. | Palmer | 6.8% | 3.1%(+3.74)#61 | 3.8%(+3.01)#6,627 |
| 62. | Maunabo | 6.6% | 3.1%(+3.50)#62 | 3.8%(+2.77)#7,021 |
| 63. | Corozal | 6.5% | 3.1%(+3.43)#63 | 3.8%(+2.71)#7,122 |
| 64. | Culebra | 6.4% | 3.1%(+3.33)#64 | 3.8%(+2.60)#7,278 |
| 65. | Catano | 6.4% | 3.1%(+3.31)#65 | 3.8%(+2.59)#7,311 |
| 66. | Las Piedras | 6.3% | 3.1%(+3.22)#66 | 3.8%(+2.50)#7,468 |
| 67. | Los Héroes | 6.1% | 3.1%(+3.02)#67 | 3.8%(+2.30)#7,796 |
| 68. | Rio Grande | 6.1% | 3.1%(+3.01)#68 | 3.8%(+2.29)#7,814 |
| 69. | El Mango | 6.1% | 3.1%(+3.00)#69 | 3.8%(+2.28)#7,829 |
| 70. | Playa Fortuna | 5.9% | 3.1%(+2.84)#70 | 3.8%(+2.12)#8,143 |
| 71. | Cidra | 5.9% | 3.1%(+2.83)#71 | 3.8%(+2.11)#8,161 |
| 72. | Sabana Seca | 5.8% | 3.1%(+2.66)#72 | 3.8%(+1.93)#8,497 |
| 73. | Monte Grande | 5.8% | 3.1%(+2.65)#73 | 3.8%(+1.93)#8,506 |
| 74. | Aguada | 5.8% | 3.1%(+2.64)#74 | 3.8%(+1.92)#8,533 |
| 75. | Las Gaviotas | 5.7% | 3.1%(+2.62)#75 | 3.8%(+1.90)#8,590 |
| 76. | Lomas Verdes | 5.7% | 3.1%(+2.57)#76 | 3.8%(+1.85)#8,692 |
| 77. | Santa Barbara | 5.6% | 3.1%(+2.47)#77 | 3.8%(+1.74)#8,905 |
| 78. | El Tumbao | 5.5% | 3.1%(+2.38)#78 | 3.8%(+1.66)#9,075 |
| 79. | Caban | 5.4% | 3.1%(+2.30)#79 | 3.8%(+1.58)#9,237 |
| 80. | Santo Domingo | 5.2% | 3.1%(+2.10)#80 | 3.8%(+1.38)#9,696 |
| 81. | San Lorenzo | 5.2% | 3.1%(+2.10)#81 | 3.8%(+1.38)#9,703 |
| 82. | H Rivera Colon | 5.2% | 3.1%(+2.08)#82 | 3.8%(+1.35)#9,745 |
| 83. | Guanica | 5.2% | 3.1%(+2.05)#83 | 3.8%(+1.32)#9,828 |
| 84. | Quebrada Del Agua | 5.1% | 3.1%(+1.99)#84 | 3.8%(+1.26)#9,949 |
| 85. | Aguadilla | 5.0% | 3.1%(+1.94)#85 | 3.8%(+1.22)#10,048 |
| 86. | San Isidro | 5.0% | 3.1%(+1.86)#86 | 3.8%(+1.14)#10,231 |
| 87. | Suarez | 4.9% | 3.1%(+1.80)#87 | 3.8%(+1.07)#10,372 |
| 88. | Cayey | 4.8% | 3.1%(+1.70)#88 | 3.8%(+0.978)#10,616 |
| 89. | Sabana Grande | 4.7% | 3.1%(+1.64)#89 | 3.8%(+0.916)#10,800 |
| 90. | Fajardo | 4.7% | 3.1%(+1.63)#90 | 3.8%(+0.908)#10,828 |
| 91. | Salinas | 4.7% | 3.1%(+1.62)#91 | 3.8%(+0.895)#10,862 |
| 92. | Loiza | 4.7% | 3.1%(+1.59)#92 | 3.8%(+0.864)#10,945 |
| 93. | Mariano Colon | 4.7% | 3.1%(+1.55)#93 | 3.8%(+0.825)#11,048 |
| 94. | Sabana Eneas | 4.6% | 3.1%(+1.45)#94 | 3.8%(+0.729)#11,298 |
| 95. | Villalba | 4.6% | 3.1%(+1.45)#95 | 3.8%(+0.722)#11,314 |
| 96. | Santa Isabel | 4.5% | 3.1%(+1.40)#96 | 3.8%(+0.679)#11,446 |
| 97. | San Antonio Comunidad Aguadilla Municipio | 4.5% | 3.1%(+1.39)#97 | 3.8%(+0.662)#11,492 |
| 98. | Isabela | 4.4% | 3.1%(+1.27)#98 | 3.8%(+0.550)#11,765 |
| 99. | Imbery | 4.3% | 3.1%(+1.24)#99 | 3.8%(+0.514)#11,892 |
| 100. | Penuelas | 4.3% | 3.1%(+1.24)#100 | 3.8%(+0.512)#11,899 |
Common Questions
What are the Top 10 Cities with the Highest Percentage of Population Employed in Material Moving in Puerto Rico?
Top 10 Cities with the Highest Percentage of Population Employed in Material Moving in Puerto Rico are:
#1
38.0%
#2
36.1%
#3
35.6%
#4
27.3%
#5
22.6%
#6
17.7%
#7
15.6%
#8
14.0%
#9
13.2%
#10
12.8%
What city has the Highest Percentage of Population Employed in Material Moving in Puerto Rico?
Fuig has the Highest Percentage of Population Employed in Material Moving in Puerto Rico with 38.0%.
What is the Percentage of Population Employed in Material Moving in the State of Puerto Rico?
Percentage of Population Employed in Material Moving in Puerto Rico is 3.1%.
What is the Percentage of Population Employed in Material Moving in the United States?
Percentage of Population Employed in Material Moving in the United States is 3.8%.