Cities with the Highest Percentage of Population Employed in Material Moving in Florida
RELATED REPORTS & OPTIONS
Material Moving
Florida
Compare Cities
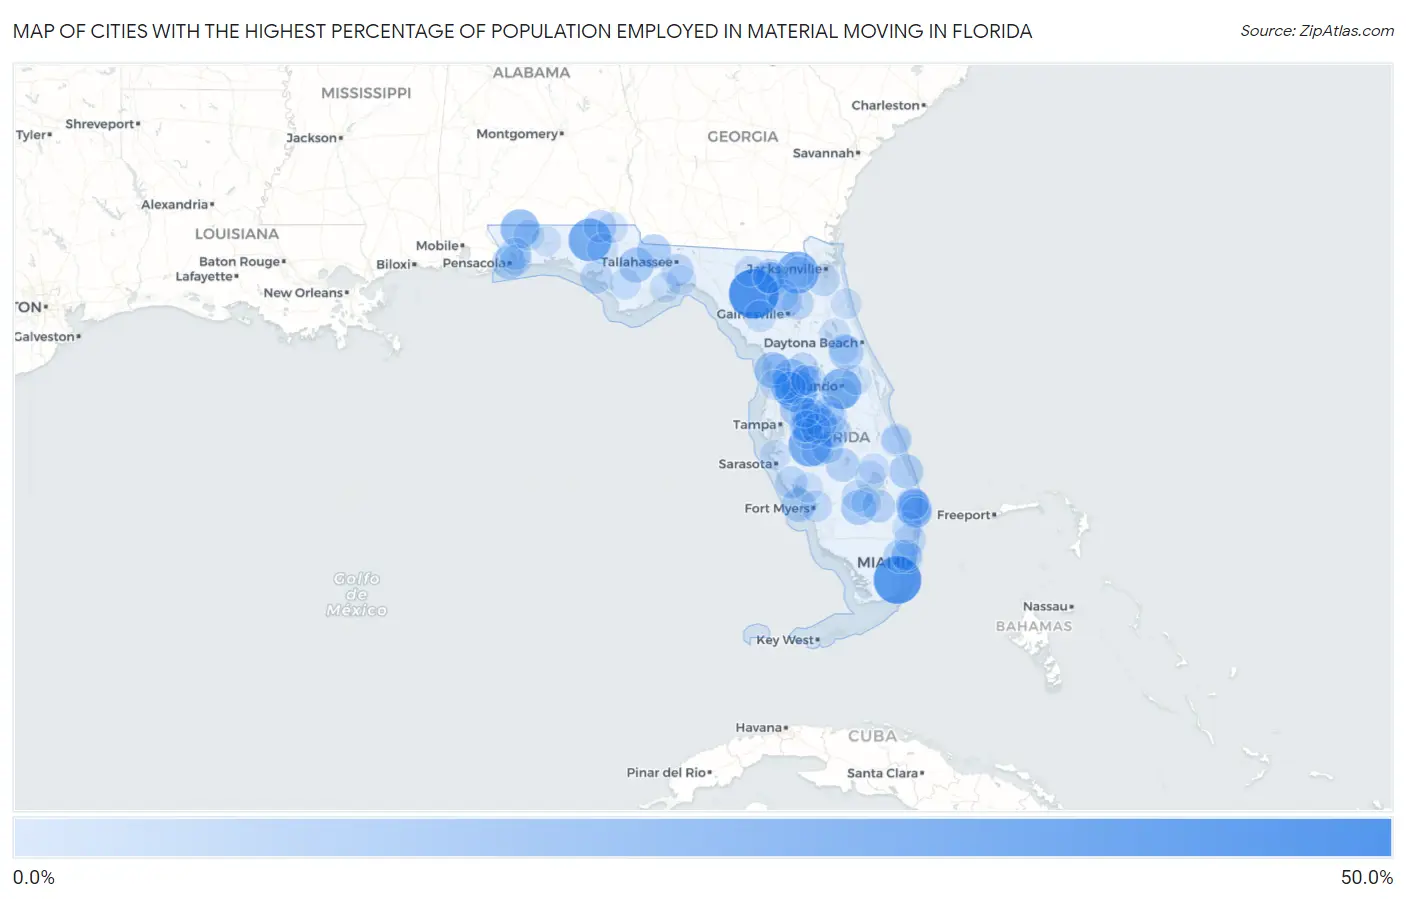
Map of Cities with the Highest Percentage of Population Employed in Material Moving in Florida
0.0%
50.0%
Cities with the Highest Percentage of Population Employed in Material Moving in Florida
| City | % Employed | vs State | vs National | |
| 1. | Branford | 40.7% | 3.2%(+37.5)#1 | 3.8%(+36.8)#159 |
| 2. | Homestead Base | 37.3% | 3.2%(+34.1)#2 | 3.8%(+33.5)#190 |
| 3. | Fort Green | 29.1% | 3.2%(+25.9)#3 | 3.8%(+25.3)#328 |
| 4. | Caryville | 28.9% | 3.2%(+25.8)#4 | 3.8%(+25.1)#330 |
| 5. | Glen St Mary | 27.4% | 3.2%(+24.2)#5 | 3.8%(+23.5)#373 |
| 6. | Lacoochee | 26.1% | 3.2%(+22.9)#6 | 3.8%(+22.3)#401 |
| 7. | Holden Heights | 24.4% | 3.2%(+21.3)#7 | 3.8%(+20.6)#467 |
| 8. | Fidelis | 21.9% | 3.2%(+18.7)#8 | 3.8%(+18.0)#601 |
| 9. | Istachatta | 18.2% | 3.2%(+15.0)#9 | 3.8%(+14.4)#888 |
| 10. | Combee Settlement | 18.1% | 3.2%(+15.0)#10 | 3.8%(+14.3)#898 |
| 11. | Homosassa | 16.8% | 3.2%(+13.6)#11 | 3.8%(+13.0)#1,063 |
| 12. | Scottsmoor | 16.0% | 3.2%(+12.8)#12 | 3.8%(+12.1)#1,198 |
| 13. | Acacia Villas | 15.8% | 3.2%(+12.6)#13 | 3.8%(+12.0)#1,219 |
| 14. | Crystal Springs | 15.7% | 3.2%(+12.6)#14 | 3.8%(+11.9)#1,240 |
| 15. | Lake Mystic | 15.0% | 3.2%(+11.8)#15 | 3.8%(+11.2)#1,373 |
| 16. | Midway Cdp Seminole County | 15.0% | 3.2%(+11.8)#16 | 3.8%(+11.2)#1,375 |
| 17. | Montura | 14.9% | 3.2%(+11.8)#17 | 3.8%(+11.1)#1,388 |
| 18. | North Deland | 14.5% | 3.2%(+11.3)#18 | 3.8%(+10.7)#1,487 |
| 19. | Spring Lake | 14.0% | 3.2%(+10.9)#19 | 3.8%(+10.2)#1,602 |
| 20. | Rio | 13.9% | 3.2%(+10.7)#20 | 3.8%(+10.1)#1,649 |
| 21. | Seminole Manor | 13.9% | 3.2%(+10.7)#21 | 3.8%(+10.0)#1,651 |
| 22. | Tropical Park | 13.7% | 3.2%(+10.5)#22 | 3.8%(+9.88)#1,696 |
| 23. | Five Points | 13.5% | 3.2%(+10.3)#23 | 3.8%(+9.69)#1,760 |
| 24. | Gretna | 13.5% | 3.2%(+10.3)#24 | 3.8%(+9.64)#1,775 |
| 25. | Bokeelia | 13.2% | 3.2%(+10.00)#25 | 3.8%(+9.35)#1,861 |
| 26. | Goulding | 13.0% | 3.2%(+9.80)#26 | 3.8%(+9.16)#1,927 |
| 27. | Eagle Lake | 12.8% | 3.2%(+9.65)#27 | 3.8%(+9.01)#1,986 |
| 28. | Ocklawaha | 12.6% | 3.2%(+9.43)#28 | 3.8%(+8.79)#2,056 |
| 29. | Lake Placid | 12.3% | 3.2%(+9.11)#29 | 3.8%(+8.46)#2,180 |
| 30. | Watertown | 12.2% | 3.2%(+9.05)#30 | 3.8%(+8.41)#2,208 |
| 31. | Medley | 12.2% | 3.2%(+9.04)#31 | 3.8%(+8.39)#2,211 |
| 32. | La Crosse | 12.2% | 3.2%(+9.01)#32 | 3.8%(+8.36)#2,223 |
| 33. | Noma | 11.3% | 3.2%(+8.13)#33 | 3.8%(+7.49)#2,578 |
| 34. | Plantation Mobile Home Park | 11.2% | 3.2%(+8.03)#34 | 3.8%(+7.39)#2,618 |
| 35. | South Bay | 11.2% | 3.2%(+8.01)#35 | 3.8%(+7.36)#2,632 |
| 36. | Wauchula | 11.0% | 3.2%(+7.81)#36 | 3.8%(+7.17)#2,729 |
| 37. | Willow Oak | 10.7% | 3.2%(+7.55)#37 | 3.8%(+6.91)#2,850 |
| 38. | Babson Park | 10.7% | 3.2%(+7.54)#38 | 3.8%(+6.90)#2,858 |
| 39. | Warm Mineral Springs | 10.7% | 3.2%(+7.49)#39 | 3.8%(+6.85)#2,885 |
| 40. | Pretty Bayou | 10.7% | 3.2%(+7.47)#40 | 3.8%(+6.83)#2,897 |
| 41. | Orange Park | 10.4% | 3.2%(+7.19)#41 | 3.8%(+6.54)#3,060 |
| 42. | Fuller Heights | 10.3% | 3.2%(+7.14)#42 | 3.8%(+6.50)#3,090 |
| 43. | Woodville | 10.3% | 3.2%(+7.09)#43 | 3.8%(+6.45)#3,119 |
| 44. | Coleman | 10.2% | 3.2%(+6.97)#44 | 3.8%(+6.33)#3,187 |
| 45. | Lemon Grove | 10.1% | 3.2%(+6.91)#45 | 3.8%(+6.27)#3,229 |
| 46. | Waldo | 10.1% | 3.2%(+6.90)#46 | 3.8%(+6.26)#3,233 |
| 47. | Mulat | 10.1% | 3.2%(+6.90)#47 | 3.8%(+6.26)#3,236 |
| 48. | Macclenny | 9.9% | 3.2%(+6.66)#48 | 3.8%(+6.02)#3,395 |
| 49. | Roosevelt Gardens | 9.7% | 3.2%(+6.56)#49 | 3.8%(+5.91)#3,473 |
| 50. | Worthington Springs | 9.7% | 3.2%(+6.52)#50 | 3.8%(+5.88)#3,501 |
| 51. | Ridge Manor | 9.6% | 3.2%(+6.45)#51 | 3.8%(+5.80)#3,555 |
| 52. | Grenelefe | 9.5% | 3.2%(+6.31)#52 | 3.8%(+5.66)#3,657 |
| 53. | Lake City | 9.5% | 3.2%(+6.29)#53 | 3.8%(+5.65)#3,671 |
| 54. | Webster | 9.4% | 3.2%(+6.21)#54 | 3.8%(+5.56)#3,757 |
| 55. | Moore Haven | 9.2% | 3.2%(+6.01)#55 | 3.8%(+5.36)#3,900 |
| 56. | Trenton | 9.2% | 3.2%(+5.98)#56 | 3.8%(+5.33)#3,936 |
| 57. | Hill N Dale | 9.1% | 3.2%(+5.95)#57 | 3.8%(+5.31)#3,959 |
| 58. | Pinewood | 9.0% | 3.2%(+5.86)#58 | 3.8%(+5.21)#4,041 |
| 59. | Crystal Lake | 9.0% | 3.2%(+5.85)#59 | 3.8%(+5.20)#4,051 |
| 60. | Garcon Point | 9.0% | 3.2%(+5.85)#60 | 3.8%(+5.20)#4,054 |
| 61. | North Brooksville | 9.0% | 3.2%(+5.77)#61 | 3.8%(+5.12)#4,113 |
| 62. | Tice | 8.9% | 3.2%(+5.75)#62 | 3.8%(+5.11)#4,127 |
| 63. | Mulberry | 8.8% | 3.2%(+5.65)#63 | 3.8%(+5.00)#4,202 |
| 64. | Wahneta | 8.7% | 3.2%(+5.54)#64 | 3.8%(+4.90)#4,286 |
| 65. | Mascotte | 8.7% | 3.2%(+5.50)#65 | 3.8%(+4.86)#4,334 |
| 66. | Opa Locka | 8.6% | 3.2%(+5.42)#66 | 3.8%(+4.77)#4,410 |
| 67. | Wewahitchka | 8.6% | 3.2%(+5.40)#67 | 3.8%(+4.75)#4,433 |
| 68. | Taft | 8.6% | 3.2%(+5.38)#68 | 3.8%(+4.74)#4,452 |
| 69. | Wausau | 8.4% | 3.2%(+5.20)#69 | 3.8%(+4.56)#4,616 |
| 70. | Munson | 8.2% | 3.2%(+5.01)#70 | 3.8%(+4.37)#4,829 |
| 71. | Seville | 8.1% | 3.2%(+4.93)#71 | 3.8%(+4.28)#4,914 |
| 72. | Live Oak | 8.0% | 3.2%(+4.81)#72 | 3.8%(+4.16)#5,047 |
| 73. | Campbellton | 7.9% | 3.2%(+4.71)#73 | 3.8%(+4.06)#5,175 |
| 74. | Buckhead Ridge | 7.7% | 3.2%(+4.54)#74 | 3.8%(+3.90)#5,386 |
| 75. | Rainbow Park | 7.7% | 3.2%(+4.54)#75 | 3.8%(+3.89)#5,392 |
| 76. | Sopchoppy | 7.7% | 3.2%(+4.51)#76 | 3.8%(+3.86)#5,425 |
| 77. | Center Hill | 7.7% | 3.2%(+4.49)#77 | 3.8%(+3.85)#5,462 |
| 78. | Crooked Lake Park | 7.7% | 3.2%(+4.49)#78 | 3.8%(+3.84)#5,464 |
| 79. | St Augustine Shores | 7.7% | 3.2%(+4.48)#79 | 3.8%(+3.83)#5,475 |
| 80. | Watergate | 7.7% | 3.2%(+4.47)#80 | 3.8%(+3.83)#5,477 |
| 81. | Schall Circle | 7.7% | 3.2%(+4.47)#81 | 3.8%(+3.83)#5,480 |
| 82. | Polk City | 7.7% | 3.2%(+4.47)#82 | 3.8%(+3.82)#5,483 |
| 83. | Cypress Quarters | 7.6% | 3.2%(+4.43)#83 | 3.8%(+3.78)#5,536 |
| 84. | Gifford | 7.6% | 3.2%(+4.37)#84 | 3.8%(+3.73)#5,605 |
| 85. | Winter Beach | 7.5% | 3.2%(+4.28)#85 | 3.8%(+3.64)#5,722 |
| 86. | Davenport | 7.4% | 3.2%(+4.25)#86 | 3.8%(+3.61)#5,758 |
| 87. | West Samoset | 7.4% | 3.2%(+4.17)#87 | 3.8%(+3.53)#5,866 |
| 88. | Homosassa Springs | 7.3% | 3.2%(+4.13)#88 | 3.8%(+3.49)#5,918 |
| 89. | Lake Kerr | 7.2% | 3.2%(+4.05)#89 | 3.8%(+3.41)#6,043 |
| 90. | Bradley Junction | 7.2% | 3.2%(+4.00)#90 | 3.8%(+3.36)#6,104 |
| 91. | St Marks | 7.1% | 3.2%(+3.87)#91 | 3.8%(+3.23)#6,283 |
| 92. | Crestview | 7.0% | 3.2%(+3.84)#92 | 3.8%(+3.20)#6,330 |
| 93. | De Leon Springs | 7.0% | 3.2%(+3.80)#93 | 3.8%(+3.16)#6,405 |
| 94. | San Castle | 7.0% | 3.2%(+3.78)#94 | 3.8%(+3.14)#6,429 |
| 95. | Chuluota | 6.9% | 3.2%(+3.76)#95 | 3.8%(+3.12)#6,460 |
| 96. | Bartow | 6.9% | 3.2%(+3.74)#96 | 3.8%(+3.10)#6,485 |
| 97. | Harlem | 6.9% | 3.2%(+3.73)#97 | 3.8%(+3.08)#6,513 |
| 98. | North Weeki Wachee | 6.9% | 3.2%(+3.71)#98 | 3.8%(+3.07)#6,536 |
| 99. | Cleveland | 6.9% | 3.2%(+3.69)#99 | 3.8%(+3.04)#6,572 |
| 100. | Kathleen | 6.8% | 3.2%(+3.65)#100 | 3.8%(+3.01)#6,633 |
Common Questions
What are the Top 10 Cities with the Highest Percentage of Population Employed in Material Moving in Florida?
Top 10 Cities with the Highest Percentage of Population Employed in Material Moving in Florida are:
#1
40.7%
#2
37.3%
#3
29.1%
#4
28.9%
#5
27.4%
#6
26.1%
#7
24.4%
#8
21.9%
#9
18.2%
#10
18.1%
What city has the Highest Percentage of Population Employed in Material Moving in Florida?
Branford has the Highest Percentage of Population Employed in Material Moving in Florida with 40.7%.
What is the Percentage of Population Employed in Material Moving in the State of Florida?
Percentage of Population Employed in Material Moving in Florida is 3.2%.
What is the Percentage of Population Employed in Material Moving in the United States?
Percentage of Population Employed in Material Moving in the United States is 3.8%.