Cities with the Highest Percentage of Population Employed in Material Moving in Michigan
RELATED REPORTS & OPTIONS
Material Moving
Michigan
Compare Cities
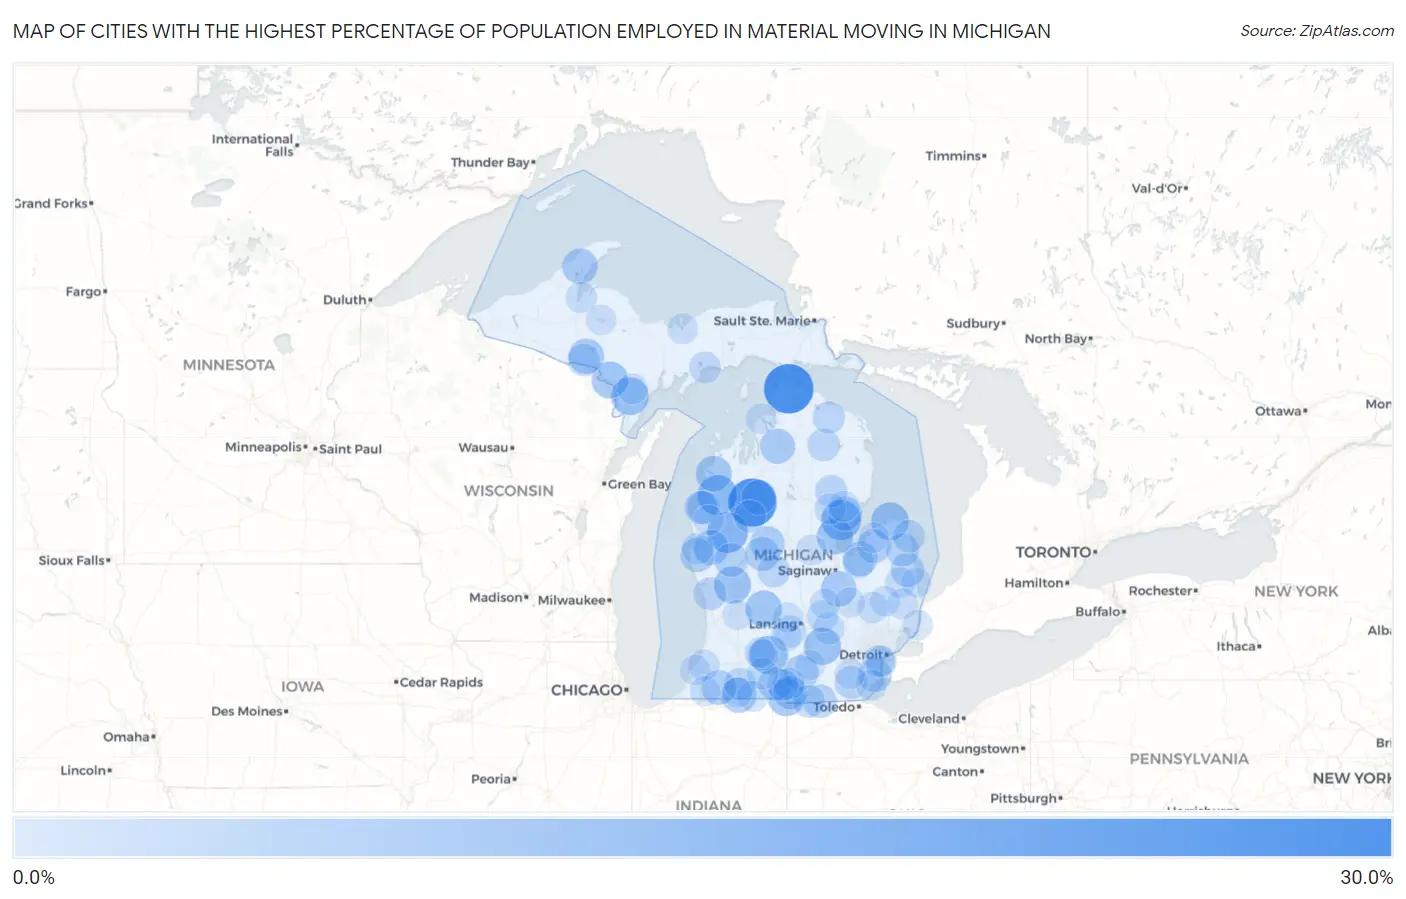
Map of Cities with the Highest Percentage of Population Employed in Material Moving in Michigan
0.0%
30.0%
Cities with the Highest Percentage of Population Employed in Material Moving in Michigan
| City | % Employed | vs State | vs National | |
| 1. | Carp Lake | 29.8% | 4.2%(+25.6)#1 | 3.8%(+25.9)#312 |
| 2. | Haring | 28.2% | 4.2%(+24.1)#2 | 3.8%(+24.4)#349 |
| 3. | Hurontown | 20.5% | 4.2%(+16.4)#3 | 3.8%(+16.7)#692 |
| 4. | Baldwin | 19.6% | 4.2%(+15.4)#4 | 3.8%(+15.8)#755 |
| 5. | Kaleva | 18.8% | 4.2%(+14.7)#5 | 3.8%(+15.0)#815 |
| 6. | Omer | 18.8% | 4.2%(+14.6)#6 | 3.8%(+14.9)#819 |
| 7. | Brownlee Park | 17.1% | 4.2%(+12.9)#7 | 3.8%(+13.3)#1,030 |
| 8. | Atlantic Mine | 16.3% | 4.2%(+12.2)#8 | 3.8%(+12.5)#1,136 |
| 9. | Carney | 16.3% | 4.2%(+12.2)#9 | 3.8%(+12.5)#1,144 |
| 10. | Port Austin | 16.3% | 4.2%(+12.1)#10 | 3.8%(+12.4)#1,148 |
| 11. | Montgomery | 15.7% | 4.2%(+11.5)#11 | 3.8%(+11.8)#1,250 |
| 12. | Stockbridge | 15.6% | 4.2%(+11.5)#12 | 3.8%(+11.8)#1,256 |
| 13. | Kent City | 15.6% | 4.2%(+11.5)#13 | 3.8%(+11.8)#1,257 |
| 14. | Norway | 15.3% | 4.2%(+11.2)#14 | 3.8%(+11.5)#1,320 |
| 15. | Pinconning | 14.8% | 4.2%(+10.7)#15 | 3.8%(+11.0)#1,407 |
| 16. | Saranac | 14.8% | 4.2%(+10.6)#16 | 3.8%(+11.0)#1,421 |
| 17. | Beulah | 14.3% | 4.2%(+10.1)#17 | 3.8%(+10.5)#1,534 |
| 18. | Rapid River | 14.1% | 4.2%(+9.93)#18 | 3.8%(+10.3)#1,587 |
| 19. | Montrose | 13.8% | 4.2%(+9.68)#19 | 3.8%(+10.0)#1,660 |
| 20. | Hubbell | 13.8% | 4.2%(+9.62)#20 | 3.8%(+9.95)#1,674 |
| 21. | Crystal Falls | 13.7% | 4.2%(+9.53)#21 | 3.8%(+9.85)#1,708 |
| 22. | White Pigeon | 13.6% | 4.2%(+9.43)#22 | 3.8%(+9.75)#1,739 |
| 23. | Alba | 13.3% | 4.2%(+9.18)#23 | 3.8%(+9.50)#1,805 |
| 24. | Walkerville | 13.3% | 4.2%(+9.18)#24 | 3.8%(+9.50)#1,811 |
| 25. | Hanover | 13.2% | 4.2%(+9.05)#25 | 3.8%(+9.37)#1,855 |
| 26. | Akron | 13.0% | 4.2%(+8.87)#26 | 3.8%(+9.19)#1,919 |
| 27. | Cassopolis | 13.0% | 4.2%(+8.82)#27 | 3.8%(+9.14)#1,934 |
| 28. | Jennings | 12.9% | 4.2%(+8.79)#28 | 3.8%(+9.11)#1,947 |
| 29. | Barryton | 12.9% | 4.2%(+8.73)#29 | 3.8%(+9.05)#1,969 |
| 30. | Shelby | 12.6% | 4.2%(+8.41)#30 | 3.8%(+8.74)#2,080 |
| 31. | Turner | 12.5% | 4.2%(+8.35)#31 | 3.8%(+8.67)#2,113 |
| 32. | Mecosta | 12.4% | 4.2%(+8.28)#32 | 3.8%(+8.61)#2,131 |
| 33. | Owendale | 12.2% | 4.2%(+8.02)#33 | 3.8%(+8.34)#2,229 |
| 34. | Carsonville | 11.9% | 4.2%(+7.78)#34 | 3.8%(+8.10)#2,315 |
| 35. | Rockwood | 11.9% | 4.2%(+7.72)#35 | 3.8%(+8.04)#2,339 |
| 36. | Greenland | 11.8% | 4.2%(+7.69)#36 | 3.8%(+8.01)#2,353 |
| 37. | Coldwater | 11.8% | 4.2%(+7.66)#37 | 3.8%(+7.98)#2,364 |
| 38. | Reading | 11.8% | 4.2%(+7.64)#38 | 3.8%(+7.96)#2,374 |
| 39. | White Cloud | 11.8% | 4.2%(+7.61)#39 | 3.8%(+7.93)#2,383 |
| 40. | Morenci | 11.6% | 4.2%(+7.44)#40 | 3.8%(+7.76)#2,461 |
| 41. | Minden City | 11.5% | 4.2%(+7.31)#41 | 3.8%(+7.63)#2,514 |
| 42. | Stronach | 11.5% | 4.2%(+7.31)#42 | 3.8%(+7.63)#2,515 |
| 43. | Oak Hill | 11.3% | 4.2%(+7.18)#43 | 3.8%(+7.51)#2,566 |
| 44. | Dundee | 11.2% | 4.2%(+7.02)#44 | 3.8%(+7.34)#2,641 |
| 45. | Fruitport | 11.0% | 4.2%(+6.80)#45 | 3.8%(+7.12)#2,757 |
| 46. | Cannonsburg | 10.7% | 4.2%(+6.53)#46 | 3.8%(+6.85)#2,883 |
| 47. | Harbor Beach | 10.6% | 4.2%(+6.49)#47 | 3.8%(+6.81)#2,909 |
| 48. | Alpha | 10.6% | 4.2%(+6.49)#48 | 3.8%(+6.81)#2,912 |
| 49. | Lupton | 10.6% | 4.2%(+6.44)#49 | 3.8%(+6.76)#2,930 |
| 50. | Waldron | 10.6% | 4.2%(+6.41)#50 | 3.8%(+6.73)#2,946 |
| 51. | Atlanta | 10.5% | 4.2%(+6.34)#51 | 3.8%(+6.67)#2,987 |
| 52. | Edmore | 10.4% | 4.2%(+6.27)#52 | 3.8%(+6.59)#3,028 |
| 53. | Tustin | 10.3% | 4.2%(+6.13)#53 | 3.8%(+6.45)#3,116 |
| 54. | Millersburg | 10.2% | 4.2%(+6.05)#54 | 3.8%(+6.37)#3,151 |
| 55. | Three Rivers | 10.1% | 4.2%(+5.99)#55 | 3.8%(+6.31)#3,193 |
| 56. | Lincoln Park | 10.0% | 4.2%(+5.89)#56 | 3.8%(+6.21)#3,264 |
| 57. | Allen | 10.0% | 4.2%(+5.85)#57 | 3.8%(+6.17)#3,298 |
| 58. | Potterville | 9.9% | 4.2%(+5.78)#58 | 3.8%(+6.11)#3,338 |
| 59. | Quincy | 9.9% | 4.2%(+5.78)#59 | 3.8%(+6.10)#3,339 |
| 60. | Millburg | 9.7% | 4.2%(+5.51)#60 | 3.8%(+5.84)#3,531 |
| 61. | Manistique | 9.6% | 4.2%(+5.50)#61 | 3.8%(+5.82)#3,540 |
| 62. | Fowlerville | 9.5% | 4.2%(+5.38)#62 | 3.8%(+5.70)#3,615 |
| 63. | Morrice | 9.5% | 4.2%(+5.37)#63 | 3.8%(+5.69)#3,639 |
| 64. | Fairgrove | 9.4% | 4.2%(+5.29)#64 | 3.8%(+5.61)#3,709 |
| 65. | Hart | 9.4% | 4.2%(+5.26)#65 | 3.8%(+5.58)#3,747 |
| 66. | Metamora | 9.3% | 4.2%(+5.11)#66 | 3.8%(+5.43)#3,849 |
| 67. | Lake Leann | 9.3% | 4.2%(+5.10)#67 | 3.8%(+5.42)#3,853 |
| 68. | Athens | 9.3% | 4.2%(+5.10)#68 | 3.8%(+5.42)#3,854 |
| 69. | Skidway Lake | 9.1% | 4.2%(+4.90)#69 | 3.8%(+5.22)#4,032 |
| 70. | Springfield | 9.0% | 4.2%(+4.83)#70 | 3.8%(+5.15)#4,094 |
| 71. | Watervliet | 9.0% | 4.2%(+4.82)#71 | 3.8%(+5.14)#4,105 |
| 72. | Zeba | 8.9% | 4.2%(+4.78)#72 | 3.8%(+5.10)#4,129 |
| 73. | Sturgis | 8.9% | 4.2%(+4.76)#73 | 3.8%(+5.08)#4,137 |
| 74. | Detroit Beach | 8.9% | 4.2%(+4.73)#74 | 3.8%(+5.05)#4,166 |
| 75. | Ecorse | 8.9% | 4.2%(+4.71)#75 | 3.8%(+5.03)#4,178 |
| 76. | Whittemore | 8.8% | 4.2%(+4.65)#76 | 3.8%(+4.97)#4,233 |
| 77. | Level Park Oak Park | 8.8% | 4.2%(+4.63)#77 | 3.8%(+4.96)#4,244 |
| 78. | Peck | 8.7% | 4.2%(+4.59)#78 | 3.8%(+4.91)#4,280 |
| 79. | Sanford | 8.7% | 4.2%(+4.56)#79 | 3.8%(+4.89)#4,299 |
| 80. | Charlevoix | 8.7% | 4.2%(+4.50)#80 | 3.8%(+4.82)#4,354 |
| 81. | Powers | 8.6% | 4.2%(+4.45)#81 | 3.8%(+4.77)#4,413 |
| 82. | Munising | 8.6% | 4.2%(+4.42)#82 | 3.8%(+4.74)#4,450 |
| 83. | Emmett | 8.5% | 4.2%(+4.31)#83 | 3.8%(+4.63)#4,539 |
| 84. | Michigamme | 8.5% | 4.2%(+4.30)#84 | 3.8%(+4.62)#4,554 |
| 85. | Benton Heights | 8.4% | 4.2%(+4.23)#85 | 3.8%(+4.55)#4,626 |
| 86. | Charlotte | 8.4% | 4.2%(+4.22)#86 | 3.8%(+4.55)#4,629 |
| 87. | Milan | 8.3% | 4.2%(+4.11)#87 | 3.8%(+4.43)#4,754 |
| 88. | Imlay City | 8.3% | 4.2%(+4.10)#88 | 3.8%(+4.43)#4,759 |
| 89. | Niles | 8.2% | 4.2%(+4.08)#89 | 3.8%(+4.40)#4,790 |
| 90. | Marine City | 8.2% | 4.2%(+4.03)#90 | 3.8%(+4.35)#4,849 |
| 91. | Pittsford | 8.2% | 4.2%(+4.02)#91 | 3.8%(+4.34)#4,853 |
| 92. | Middletown | 8.2% | 4.2%(+4.00)#92 | 3.8%(+4.32)#4,870 |
| 93. | Pigeon | 8.1% | 4.2%(+3.99)#93 | 3.8%(+4.31)#4,876 |
| 94. | Flint | 8.1% | 4.2%(+3.97)#94 | 3.8%(+4.30)#4,900 |
| 95. | Fountain | 8.1% | 4.2%(+3.96)#95 | 3.8%(+4.28)#4,925 |
| 96. | Constantine | 8.1% | 4.2%(+3.94)#96 | 3.8%(+4.26)#4,941 |
| 97. | Eagle | 8.1% | 4.2%(+3.91)#97 | 3.8%(+4.23)#4,978 |
| 98. | Lexington | 8.1% | 4.2%(+3.91)#98 | 3.8%(+4.23)#4,981 |
| 99. | Vandercook Lake | 8.0% | 4.2%(+3.86)#99 | 3.8%(+4.18)#5,019 |
| 100. | Cutlerville | 7.9% | 4.2%(+3.79)#100 | 3.8%(+4.11)#5,104 |
Common Questions
What are the Top 10 Cities with the Highest Percentage of Population Employed in Material Moving in Michigan?
Top 10 Cities with the Highest Percentage of Population Employed in Material Moving in Michigan are:
#1
29.8%
#2
28.2%
#3
19.6%
#4
18.8%
#5
18.8%
#6
17.1%
#7
16.3%
#8
16.3%
#9
15.7%
#10
15.6%
What city has the Highest Percentage of Population Employed in Material Moving in Michigan?
Carp Lake has the Highest Percentage of Population Employed in Material Moving in Michigan with 29.8%.
What is the Percentage of Population Employed in Material Moving in the State of Michigan?
Percentage of Population Employed in Material Moving in Michigan is 4.2%.
What is the Percentage of Population Employed in Material Moving in the United States?
Percentage of Population Employed in Material Moving in the United States is 3.8%.