Smith Corner, CA Map & Demographics
Smith Corner Map
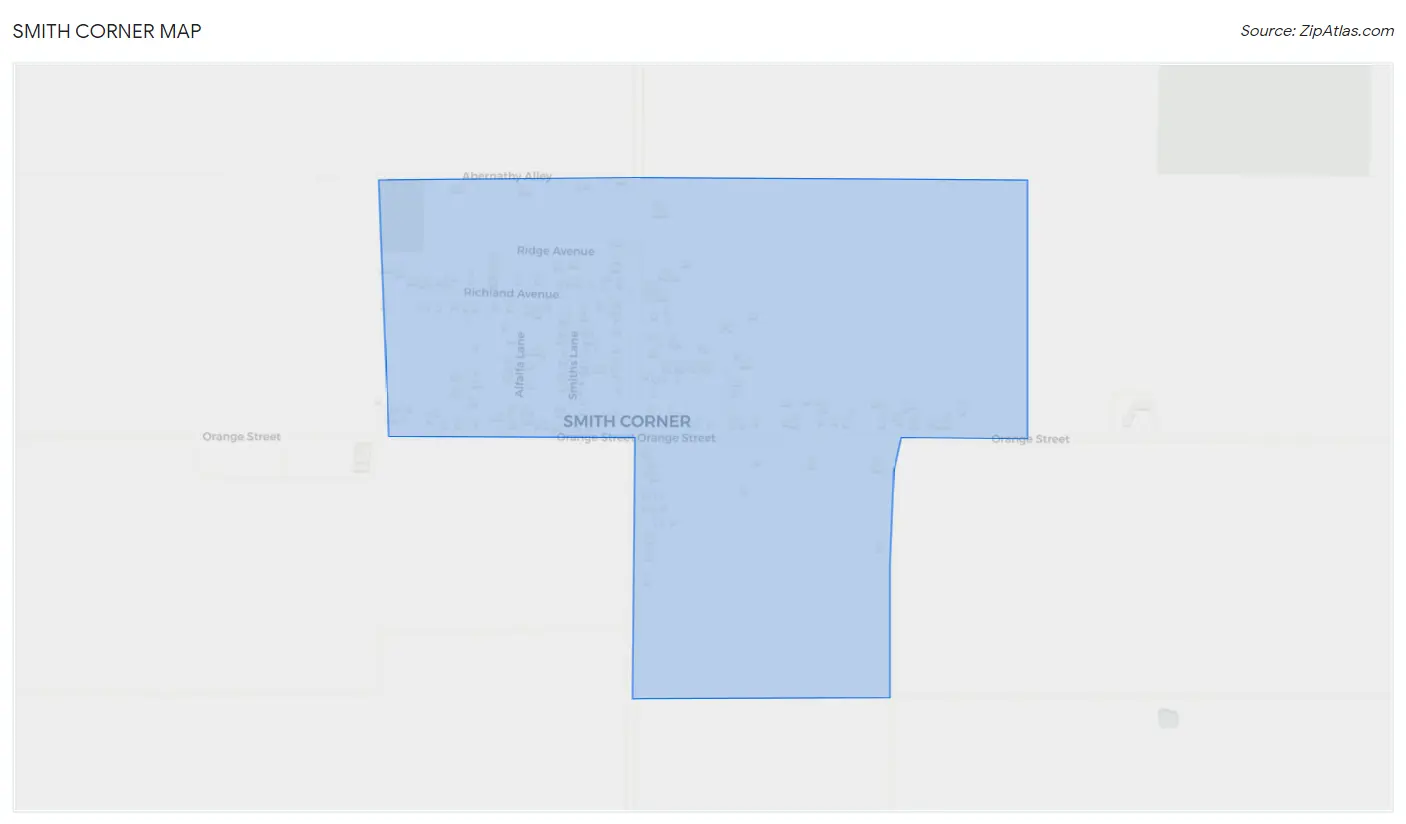
Smith Corner Overview
$11,617
PER CAPITA INCOME
$41,250
AVG FAMILY INCOME
$41,250
AVG HOUSEHOLD INCOME
0.22
INEQUALITY / GINI INDEX
316
TOTAL POPULATION
148
MALE POPULATION
168
FEMALE POPULATION
88.10
MALES / 100 FEMALES
113.51
FEMALES / 100 MALES
35.7
MEDIAN AGE
3.4
AVG FAMILY SIZE
3.4
AVG HOUSEHOLD SIZE
138
LABOR FORCE [ PEOPLE ]
50.9%
PERCENT IN LABOR FORCE
13.8%
UNEMPLOYMENT RATE
Income in Smith Corner
Income Overview in Smith Corner
Per Capita Income in Smith Corner is $11,617, while median incomes of families and households are $41,250 and $41,250 respectively.
| Characteristic | Number | Measure |
| Per Capita Income | 316 | $11,617 |
| Median Family Income | 93 | $41,250 |
| Mean Family Income | 93 | $37,699 |
| Median Household Income | 93 | $41,250 |
| Mean Household Income | 93 | $37,699 |
| Income Deficit | 93 | $0 |
| Wage / Income Gap (%) | 316 | 0.00% |
| Wage / Income Gap ($) | 316 | 100.00¢ per $1 |
| Gini / Inequality Index | 316 | 0.22 |
Earnings by Sex in Smith Corner
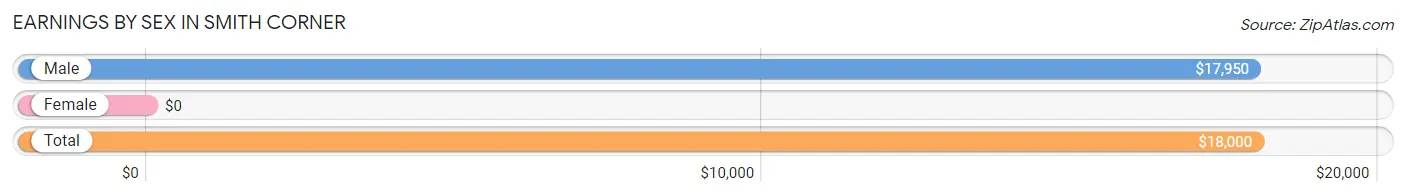
| Sex | Number | Average Earnings |
| Male | 83 (62.9%) | $17,950 |
| Female | 49 (37.1%) | $0 |
| Total | 132 (100.0%) | $18,000 |
Earnings by Sex by Income Bracket in Smith Corner
The most common earnings brackets in Smith Corner are $17,500 to $19,999 for men (25 | 30.1%) and $7,500 to $9,999 for women (24 | 49.0%).
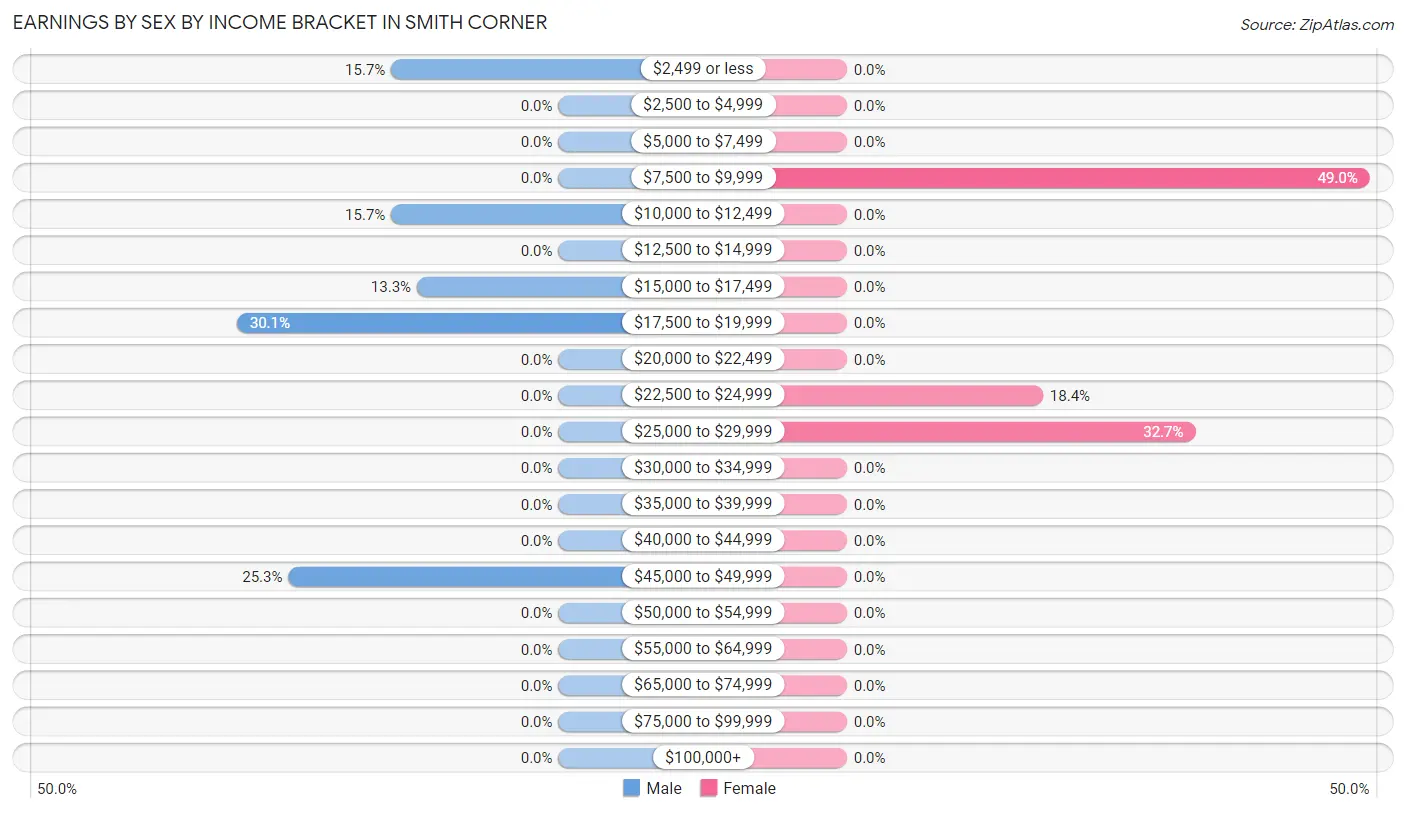
| Income | Male | Female |
| $2,499 or less | 13 (15.7%) | 0 (0.0%) |
| $2,500 to $4,999 | 0 (0.0%) | 0 (0.0%) |
| $5,000 to $7,499 | 0 (0.0%) | 0 (0.0%) |
| $7,500 to $9,999 | 0 (0.0%) | 24 (49.0%) |
| $10,000 to $12,499 | 13 (15.7%) | 0 (0.0%) |
| $12,500 to $14,999 | 0 (0.0%) | 0 (0.0%) |
| $15,000 to $17,499 | 11 (13.3%) | 0 (0.0%) |
| $17,500 to $19,999 | 25 (30.1%) | 0 (0.0%) |
| $20,000 to $22,499 | 0 (0.0%) | 0 (0.0%) |
| $22,500 to $24,999 | 0 (0.0%) | 9 (18.4%) |
| $25,000 to $29,999 | 0 (0.0%) | 16 (32.7%) |
| $30,000 to $34,999 | 0 (0.0%) | 0 (0.0%) |
| $35,000 to $39,999 | 0 (0.0%) | 0 (0.0%) |
| $40,000 to $44,999 | 0 (0.0%) | 0 (0.0%) |
| $45,000 to $49,999 | 21 (25.3%) | 0 (0.0%) |
| $50,000 to $54,999 | 0 (0.0%) | 0 (0.0%) |
| $55,000 to $64,999 | 0 (0.0%) | 0 (0.0%) |
| $65,000 to $74,999 | 0 (0.0%) | 0 (0.0%) |
| $75,000 to $99,999 | 0 (0.0%) | 0 (0.0%) |
| $100,000+ | 0 (0.0%) | 0 (0.0%) |
| Total | 83 (100.0%) | 49 (100.0%) |
Earnings by Sex by Educational Attainment in Smith Corner
| Educational Attainment | Male Income | Female Income |
| Less than High School | - | - |
| High School Diploma | - | - |
| College or Associate's Degree | - | - |
| Bachelor's Degree | - | - |
| Graduate Degree | - | - |
| Total | - | - |
Family Income in Smith Corner
Family Income Brackets in Smith Corner
According to the Smith Corner family income data, there are 48 families falling into the $35,000 to $49,999 income range, which is the most common income bracket and makes up 51.6% of all families.
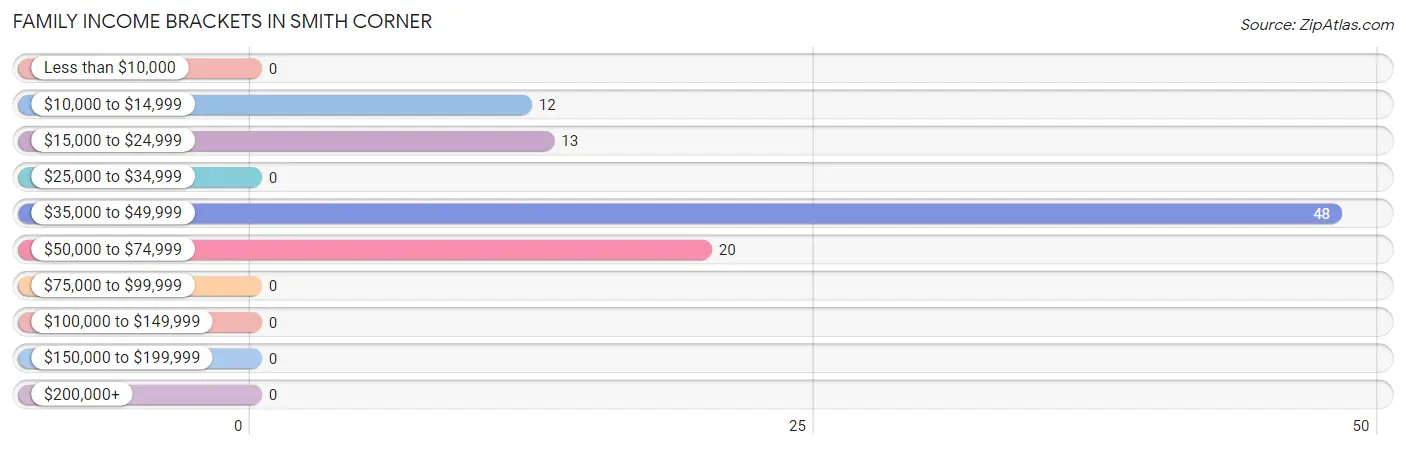
| Income Bracket | # Families | % Families |
| Less than $10,000 | 0 | 0.0% |
| $10,000 to $14,999 | 12 | 12.9% |
| $15,000 to $24,999 | 13 | 14.0% |
| $25,000 to $34,999 | 0 | 0.0% |
| $35,000 to $49,999 | 48 | 51.6% |
| $50,000 to $74,999 | 20 | 21.5% |
| $75,000 to $99,999 | 0 | 0.0% |
| $100,000 to $149,999 | 0 | 0.0% |
| $150,000 to $199,999 | 0 | 0.0% |
| $200,000+ | 0 | 0.0% |
Family Income by Famaliy Size in Smith Corner
| Income Bracket | # Families | Median Income |
| 2-Person Families | 41 (44.1%) | $0 |
| 3-Person Families | 14 (15.0%) | $0 |
| 4-Person Families | 7 (7.5%) | $0 |
| 5-Person Families | 31 (33.3%) | $0 |
| 6-Person Families | 0 (0.0%) | $0 |
| 7+ Person Families | 0 (0.0%) | $0 |
| Total | 93 (100.0%) | $41,250 |
Family Income by Number of Earners in Smith Corner
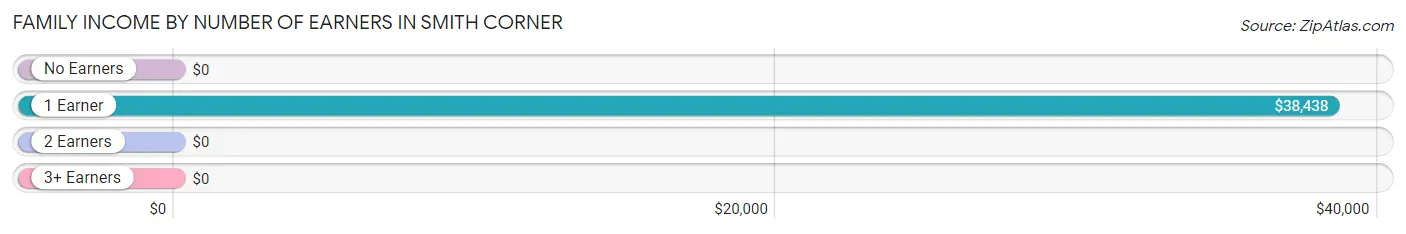
| Number of Earners | # Families | Median Income |
| No Earners | 0 (0.0%) | $0 |
| 1 Earner | 62 (66.7%) | $38,438 |
| 2 Earners | 31 (33.3%) | $0 |
| 3+ Earners | 0 (0.0%) | $0 |
| Total | 93 (100.0%) | $41,250 |
Household Income in Smith Corner
Household Income Brackets in Smith Corner
With 48 households falling in the category, the $35,000 to $49,999 income range is the most frequent in Smith Corner, accounting for 51.6% of all households.
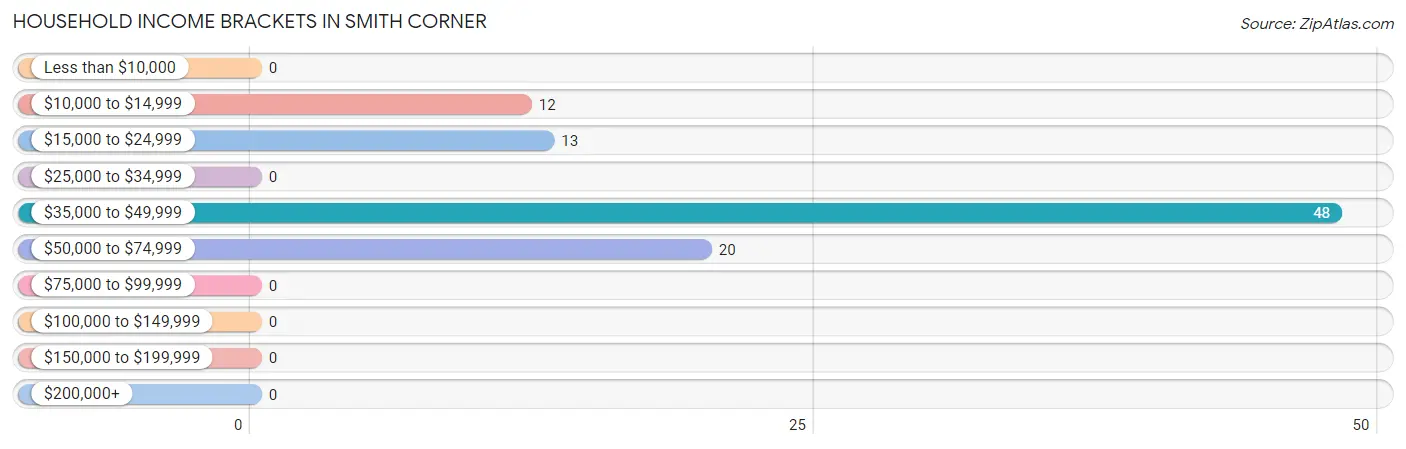
| Income Bracket | # Households | % Households |
| Less than $10,000 | 0 | 0.0% |
| $10,000 to $14,999 | 12 | 12.9% |
| $15,000 to $24,999 | 13 | 14.0% |
| $25,000 to $34,999 | 0 | 0.0% |
| $35,000 to $49,999 | 48 | 51.6% |
| $50,000 to $74,999 | 20 | 21.5% |
| $75,000 to $99,999 | 0 | 0.0% |
| $100,000 to $149,999 | 0 | 0.0% |
| $150,000 to $199,999 | 0 | 0.0% |
| $200,000+ | 0 | 0.0% |
Household Income by Householder Age in Smith Corner
| Income Bracket | # Households | Median Income |
| 15 to 24 Years | 0 (0.0%) | $0 |
| 25 to 44 Years | 21 (22.6%) | $0 |
| 45 to 64 Years | 52 (55.9%) | $0 |
| 65+ Years | 20 (21.5%) | $0 |
| Total | 93 (100.0%) | $41,250 |
Poverty in Smith Corner
Income Below Poverty by Sex and Age in Smith Corner
With 27.0% poverty level for males and 7.1% for females among the residents of Smith Corner, 55 to 64 year old males and 45 to 54 year old females are the most vulnerable to poverty, with 27 males (100.0%) and 12 females (57.1%) in their respective age groups living below the poverty level.
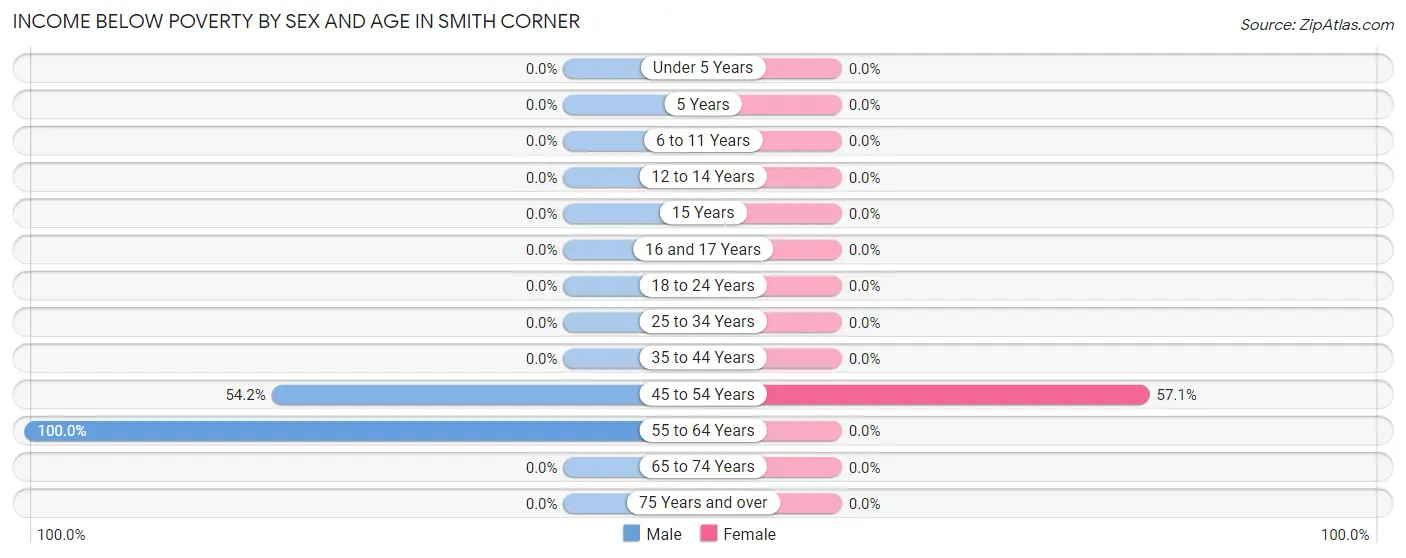
| Age Bracket | Male | Female |
| Under 5 Years | 0 (0.0%) | 0 (0.0%) |
| 5 Years | 0 (0.0%) | 0 (0.0%) |
| 6 to 11 Years | 0 (0.0%) | 0 (0.0%) |
| 12 to 14 Years | 0 (0.0%) | 0 (0.0%) |
| 15 Years | 0 (0.0%) | 0 (0.0%) |
| 16 and 17 Years | 0 (0.0%) | 0 (0.0%) |
| 18 to 24 Years | 0 (0.0%) | 0 (0.0%) |
| 25 to 34 Years | 0 (0.0%) | 0 (0.0%) |
| 35 to 44 Years | 0 (0.0%) | 0 (0.0%) |
| 45 to 54 Years | 13 (54.2%) | 12 (57.1%) |
| 55 to 64 Years | 27 (100.0%) | 0 (0.0%) |
| 65 to 74 Years | 0 (0.0%) | 0 (0.0%) |
| 75 Years and over | 0 (0.0%) | 0 (0.0%) |
| Total | 40 (27.0%) | 12 (7.1%) |
Income Above Poverty by Sex and Age in Smith Corner
According to the poverty statistics in Smith Corner, males aged 12 to 14 years and females aged under 5 years are the age groups that are most secure financially, with 100.0% of males and 100.0% of females in these age groups living above the poverty line.
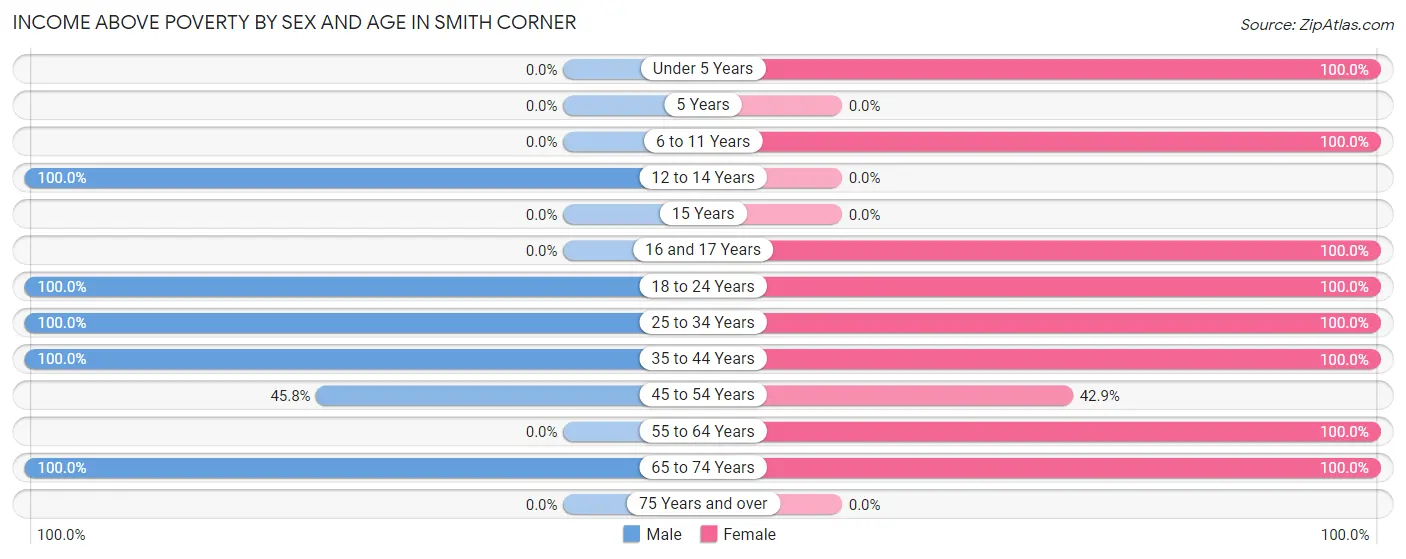
| Age Bracket | Male | Female |
| Under 5 Years | 0 (0.0%) | 19 (100.0%) |
| 5 Years | 0 (0.0%) | 0 (0.0%) |
| 6 to 11 Years | 0 (0.0%) | 16 (100.0%) |
| 12 to 14 Years | 10 (100.0%) | 0 (0.0%) |
| 15 Years | 0 (0.0%) | 0 (0.0%) |
| 16 and 17 Years | 0 (0.0%) | 23 (100.0%) |
| 18 to 24 Years | 25 (100.0%) | 12 (100.0%) |
| 25 to 34 Years | 28 (100.0%) | 6 (100.0%) |
| 35 to 44 Years | 14 (100.0%) | 36 (100.0%) |
| 45 to 54 Years | 11 (45.8%) | 9 (42.9%) |
| 55 to 64 Years | 0 (0.0%) | 16 (100.0%) |
| 65 to 74 Years | 20 (100.0%) | 19 (100.0%) |
| 75 Years and over | 0 (0.0%) | 0 (0.0%) |
| Total | 108 (73.0%) | 156 (92.9%) |
Income Below Poverty Among Married-Couple Families in Smith Corner
The poverty statistics for married-couple families in Smith Corner show that 18.8% or 12 of the total 64 families live below the poverty line. Families with no children have the highest poverty rate of 100.0%, comprising of 12 families. On the other hand, families with 1 or 2 children have the lowest poverty rate of 0.0%, which includes 0 families.
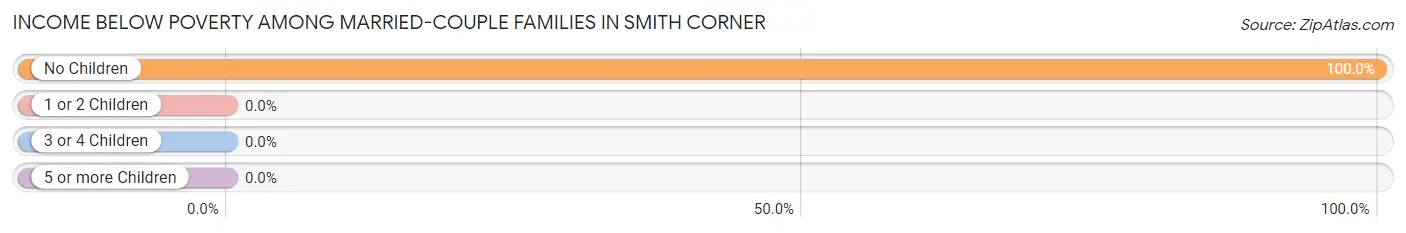
| Children | Above Poverty | Below Poverty |
| No Children | 0 (0.0%) | 12 (100.0%) |
| 1 or 2 Children | 52 (100.0%) | 0 (0.0%) |
| 3 or 4 Children | 0 (0.0%) | 0 (0.0%) |
| 5 or more Children | 0 (0.0%) | 0 (0.0%) |
| Total | 52 (81.2%) | 12 (18.8%) |
Income Below Poverty Among Single-Parent Households in Smith Corner
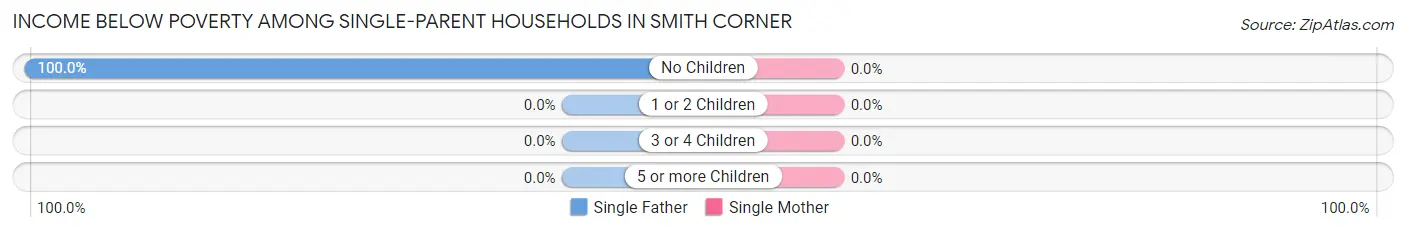
| Children | Single Father | Single Mother |
| No Children | 13 (100.0%) | 0 (0.0%) |
| 1 or 2 Children | 0 (0.0%) | 0 (0.0%) |
| 3 or 4 Children | 0 (0.0%) | 0 (0.0%) |
| 5 or more Children | 0 (0.0%) | 0 (0.0%) |
| Total | 13 (100.0%) | 0 (0.0%) |
Income Below Poverty Among Married-Couple vs Single-Parent Households in Smith Corner
The poverty data for Smith Corner shows that 12 of the married-couple family households (18.8%) and 13 of the single-parent households (44.8%) are living below the poverty level. Within the married-couple family households, those with no children have the highest poverty rate, with 12 households (100.0%) falling below the poverty line. Among the single-parent households, those with no children have the highest poverty rate, with 13 household (44.8%) living below poverty.
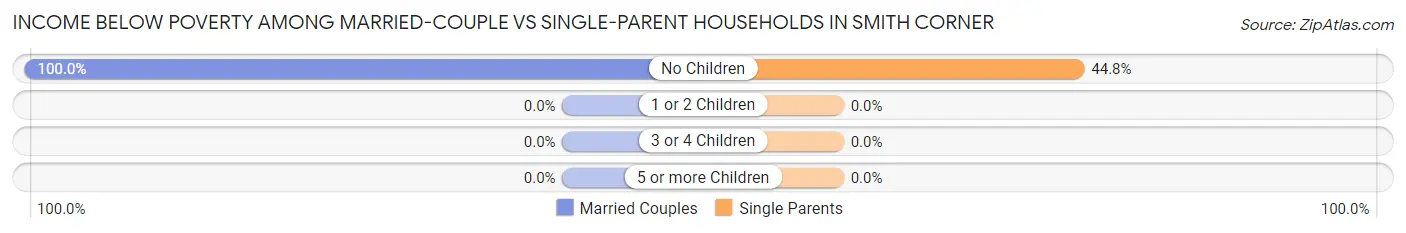
| Children | Married-Couple Families | Single-Parent Households |
| No Children | 12 (100.0%) | 13 (44.8%) |
| 1 or 2 Children | 0 (0.0%) | 0 (0.0%) |
| 3 or 4 Children | 0 (0.0%) | 0 (0.0%) |
| 5 or more Children | 0 (0.0%) | 0 (0.0%) |
| Total | 12 (18.8%) | 13 (44.8%) |
Race in Smith Corner
The most populous races in Smith Corner are Hispanic or Latino (279 | 88.3%), Some other Race (177 | 56.0%), and Two or more Races (77 | 24.4%).
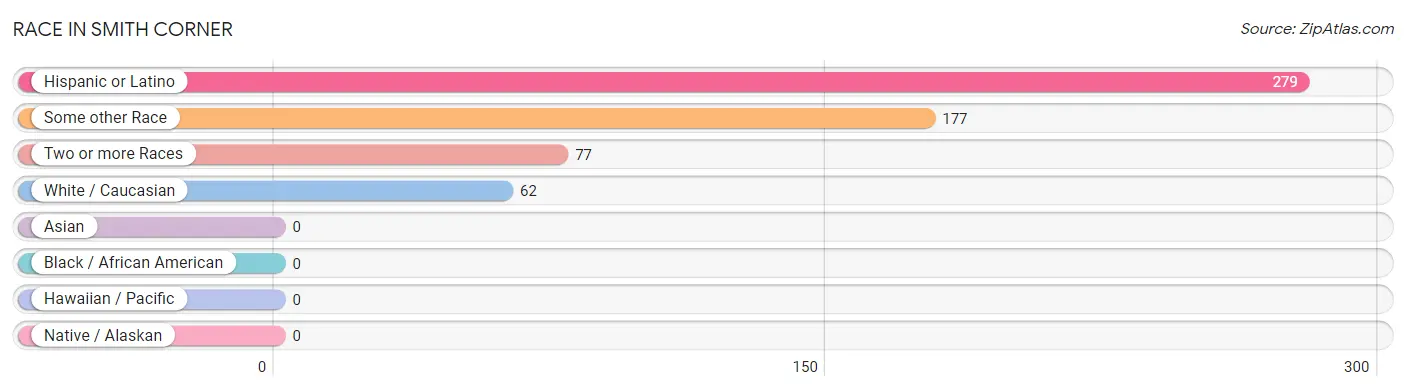
| Race | # Population | % Population |
| Asian | 0 | 0.0% |
| Black / African American | 0 | 0.0% |
| Hawaiian / Pacific | 0 | 0.0% |
| Hispanic or Latino | 279 | 88.3% |
| Native / Alaskan | 0 | 0.0% |
| White / Caucasian | 62 | 19.6% |
| Two or more Races | 77 | 24.4% |
| Some other Race | 177 | 56.0% |
| Total | 316 | 100.0% |
Ancestry in Smith Corner
The most populous ancestries reported in Smith Corner are , and Mexican (279 | 88.3%), together accounting for 88.3% of all Smith Corner residents.

| Ancestry | # Population | % Population |
| Mexican | 279 | 88.3% | View All 1 Rows |
Immigrants in Smith Corner
The most numerous immigrant groups reported in Smith Corner came from Central America (180 | 57.0%), Latin America (180 | 57.0%), and Mexico (180 | 57.0%), together accounting for 170.9% of all Smith Corner residents.
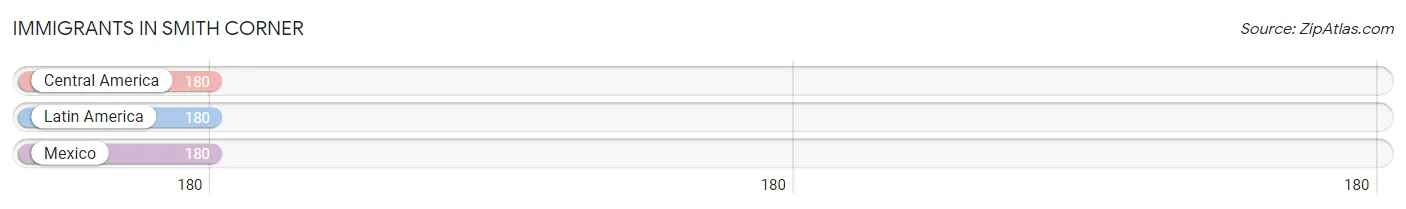
| Immigration Origin | # Population | % Population |
| Central America | 180 | 57.0% |
| Latin America | 180 | 57.0% |
| Mexico | 180 | 57.0% | View All 3 Rows |
Sex and Age in Smith Corner
Sex and Age in Smith Corner
The most populous age groups in Smith Corner are 30 to 34 Years (28 | 18.9%) for men and 40 to 44 Years (24 | 14.3%) for women.
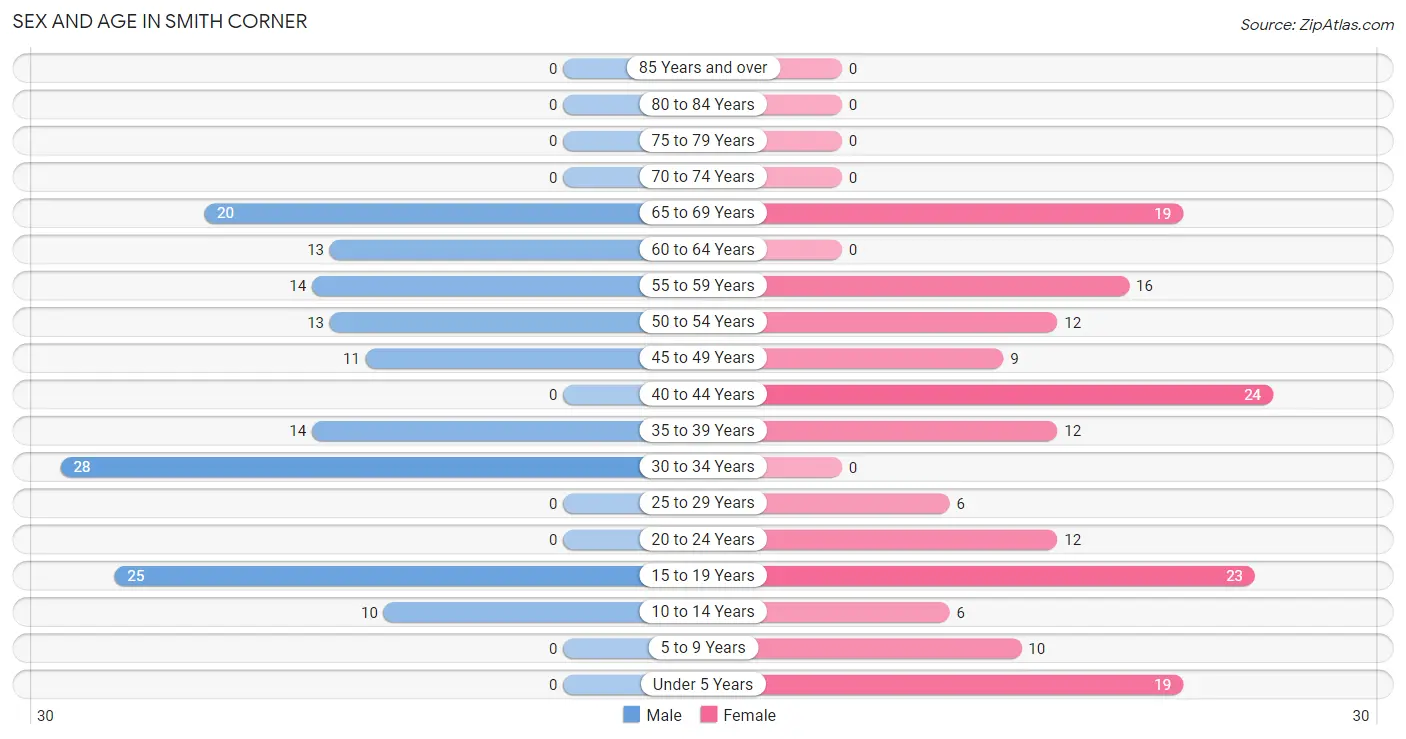
| Age Bracket | Male | Female |
| Under 5 Years | 0 (0.0%) | 19 (11.3%) |
| 5 to 9 Years | 0 (0.0%) | 10 (5.9%) |
| 10 to 14 Years | 10 (6.8%) | 6 (3.6%) |
| 15 to 19 Years | 25 (16.9%) | 23 (13.7%) |
| 20 to 24 Years | 0 (0.0%) | 12 (7.1%) |
| 25 to 29 Years | 0 (0.0%) | 6 (3.6%) |
| 30 to 34 Years | 28 (18.9%) | 0 (0.0%) |
| 35 to 39 Years | 14 (9.5%) | 12 (7.1%) |
| 40 to 44 Years | 0 (0.0%) | 24 (14.3%) |
| 45 to 49 Years | 11 (7.4%) | 9 (5.4%) |
| 50 to 54 Years | 13 (8.8%) | 12 (7.1%) |
| 55 to 59 Years | 14 (9.5%) | 16 (9.5%) |
| 60 to 64 Years | 13 (8.8%) | 0 (0.0%) |
| 65 to 69 Years | 20 (13.5%) | 19 (11.3%) |
| 70 to 74 Years | 0 (0.0%) | 0 (0.0%) |
| 75 to 79 Years | 0 (0.0%) | 0 (0.0%) |
| 80 to 84 Years | 0 (0.0%) | 0 (0.0%) |
| 85 Years and over | 0 (0.0%) | 0 (0.0%) |
| Total | 148 (100.0%) | 168 (100.0%) |
Families and Households in Smith Corner
Median Family Size in Smith Corner
The median family size in Smith Corner is 3.40 persons per family, with married-couple families (64 | 68.8%) accounting for the largest median family size of 3.94 persons per family. On the other hand, single male/father families (13 | 14.0%) represent the smallest median family size with 2.08 persons per family.
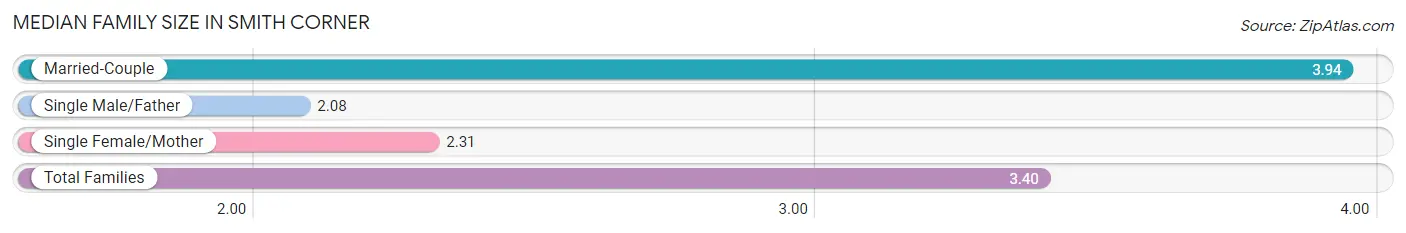
| Family Type | # Families | Family Size |
| Married-Couple | 64 (68.8%) | 3.94 |
| Single Male/Father | 13 (14.0%) | 2.08 |
| Single Female/Mother | 16 (17.2%) | 2.31 |
| Total Families | 93 (100.0%) | 3.40 |
Median Household Size in Smith Corner
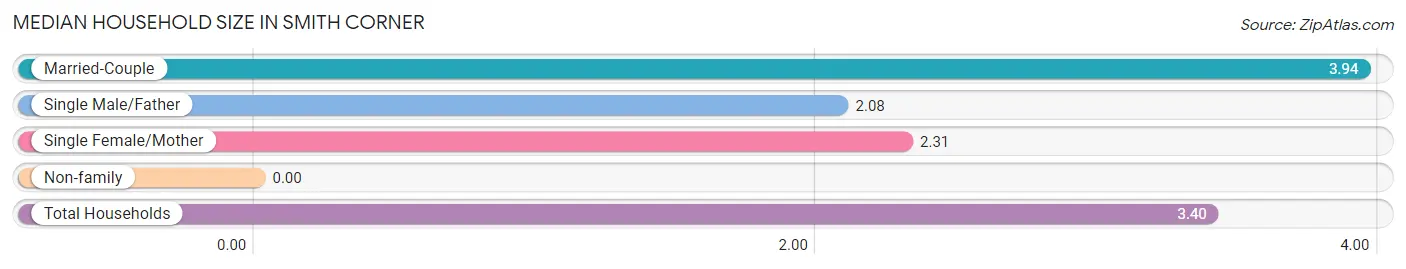
| Household Type | # Households | Household Size |
| Married-Couple | 64 (68.8%) | 3.94 |
| Single Male/Father | 13 (14.0%) | 2.08 |
| Single Female/Mother | 16 (17.2%) | 2.31 |
| Non-family | 0 (0.0%) | - |
| Total Households | 93 (100.0%) | 3.40 |
Household Size by Marriage Status in Smith Corner
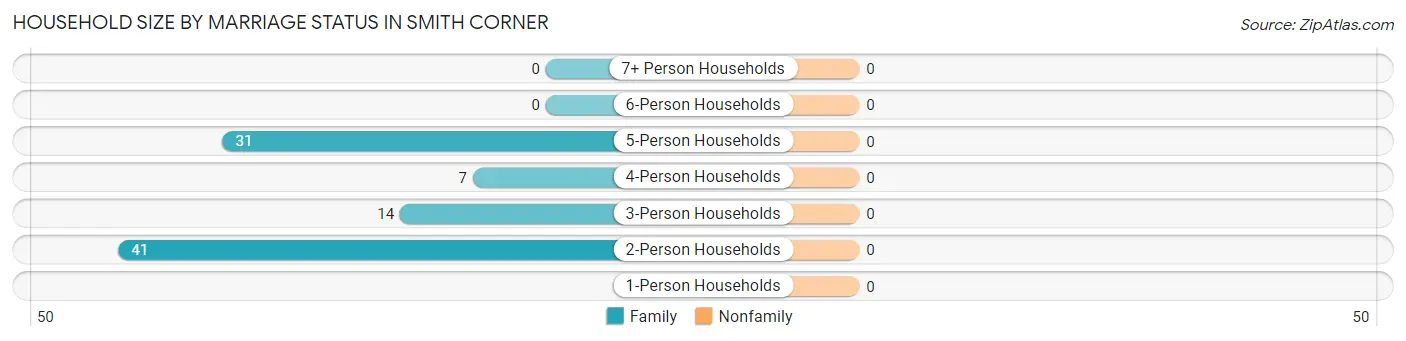
| Household Size | Family Households | Nonfamily Households |
| 1-Person Households | - | 0 (0.0%) |
| 2-Person Households | 41 (44.1%) | 0 (0.0%) |
| 3-Person Households | 14 (15.0%) | 0 (0.0%) |
| 4-Person Households | 7 (7.5%) | 0 (0.0%) |
| 5-Person Households | 31 (33.3%) | 0 (0.0%) |
| 6-Person Households | 0 (0.0%) | 0 (0.0%) |
| 7+ Person Households | 0 (0.0%) | 0 (0.0%) |
| Total | 93 (100.0%) | 0 (0.0%) |
Female Fertility in Smith Corner
Fertility by Age in Smith Corner
Average fertility rate in Smith Corner is 184.0 births per 1,000 women. Women in the age bracket of 20 to 34 years have the highest fertility rate with 333.0 births per 1,000 women. Women in the age bracket of 35 to 50 years acount for 66.7% of all women with births.
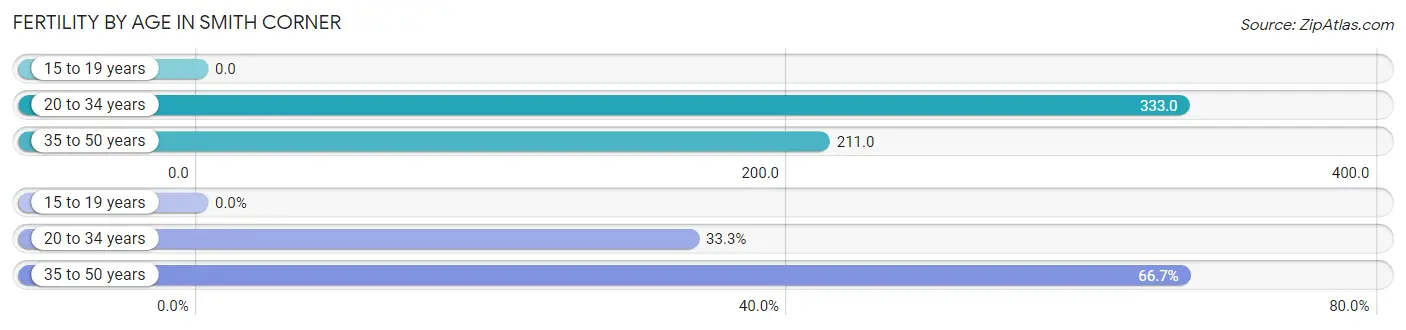
| Age Bracket | Women with Births | Births / 1,000 Women |
| 15 to 19 years | 0 (0.0%) | 0.0 |
| 20 to 34 years | 6 (33.3%) | 333.0 |
| 35 to 50 years | 12 (66.7%) | 211.0 |
| Total | 18 (100.0%) | 184.0 |
Fertility by Age by Marriage Status in Smith Corner
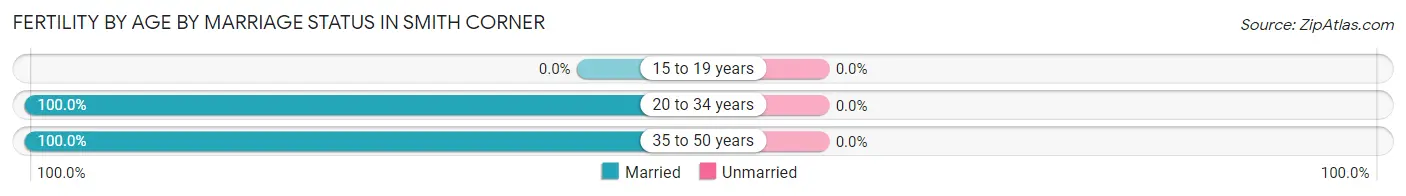
| Age Bracket | Married | Unmarried |
| 15 to 19 years | 0 (0.0%) | 0 (0.0%) |
| 20 to 34 years | 6 (100.0%) | 0 (0.0%) |
| 35 to 50 years | 12 (100.0%) | 0 (0.0%) |
| Total | 18 (100.0%) | 0 (0.0%) |
Fertility by Education in Smith Corner
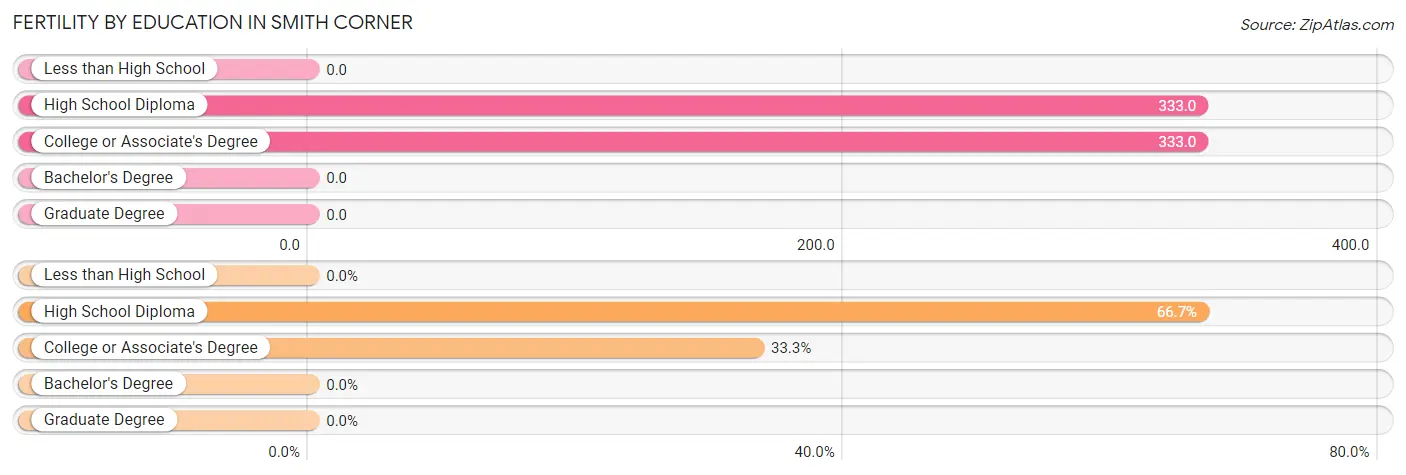
| Educational Attainment | Women with Births | Births / 1,000 Women |
| Less than High School | 0 (0.0%) | 0.0 |
| High School Diploma | 12 (66.7%) | 333.0 |
| College or Associate's Degree | 6 (33.3%) | 333.0 |
| Bachelor's Degree | 0 (0.0%) | 0.0 |
| Graduate Degree | 0 (0.0%) | 0.0 |
| Total | 18 (100.0%) | 184.0 |
Fertility by Education by Marriage Status in Smith Corner
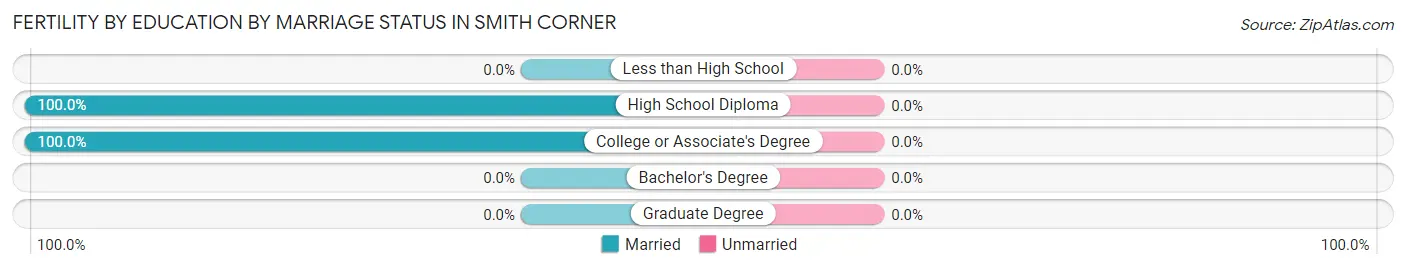
| Educational Attainment | Married | Unmarried |
| Less than High School | 0 (0.0%) | 0 (0.0%) |
| High School Diploma | 12 (100.0%) | 0 (0.0%) |
| College or Associate's Degree | 6 (100.0%) | 0 (0.0%) |
| Bachelor's Degree | 0 (0.0%) | 0 (0.0%) |
| Graduate Degree | 0 (0.0%) | 0 (0.0%) |
| Total | 18 (100.0%) | 0 (0.0%) |
Employment Characteristics in Smith Corner
Employment by Class of Employer in Smith Corner
Among the 106 employed individuals in Smith Corner, private company employees (85 | 80.2%), self-employed (incorporated) (14 | 13.2%), and local government employees (7 | 6.6%) make up the most common classes of employment.
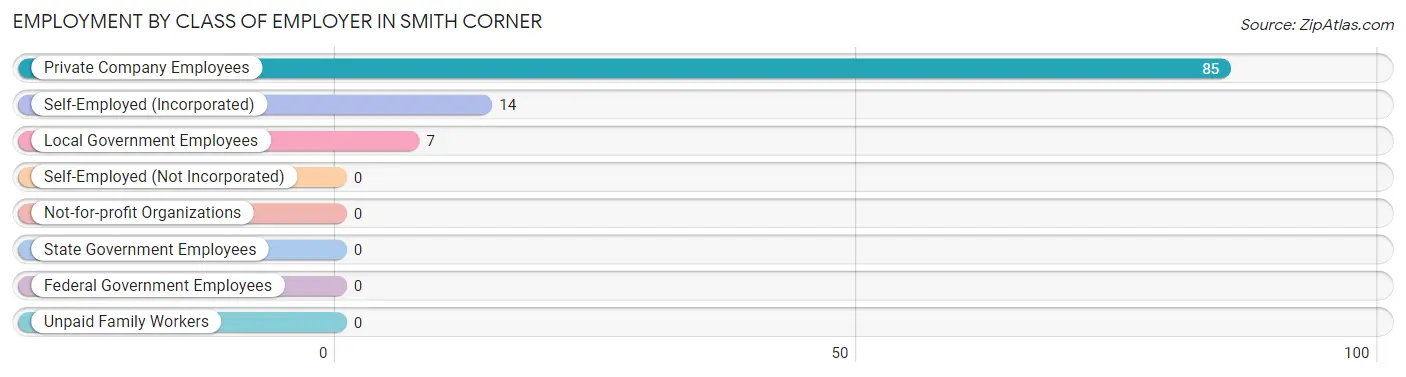
| Employer Class | # Employees | % Employees |
| Private Company Employees | 85 | 80.2% |
| Self-Employed (Incorporated) | 14 | 13.2% |
| Self-Employed (Not Incorporated) | 0 | 0.0% |
| Not-for-profit Organizations | 0 | 0.0% |
| Local Government Employees | 7 | 6.6% |
| State Government Employees | 0 | 0.0% |
| Federal Government Employees | 0 | 0.0% |
| Unpaid Family Workers | 0 | 0.0% |
| Total | 106 | 100.0% |
Employment Status by Age in Smith Corner
According to the labor force statistics for Smith Corner, out of the total population over 16 years of age (271), 50.9% or 138 individuals are in the labor force, with 13.8% or 19 of them unemployed. The age group with the highest labor force participation rate is 25 to 29 years, with 100.0% or 6 individuals in the labor force. Within the labor force, the 25 to 29 years age range has the highest percentage of unemployed individuals, with 100.0% or 6 of them being unemployed.
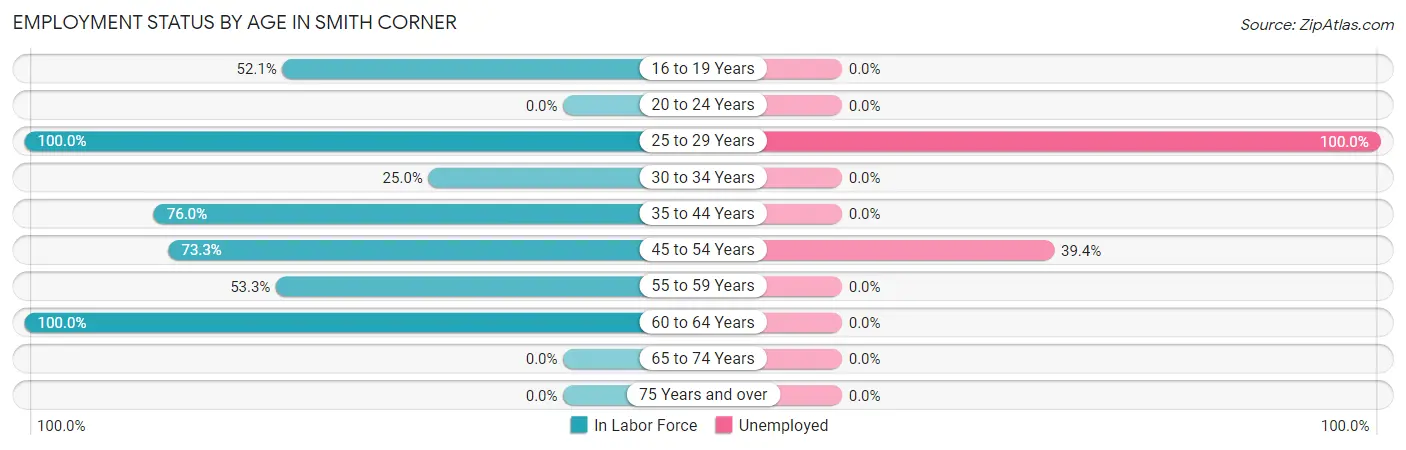
| Age Bracket | In Labor Force | Unemployed |
| 16 to 19 Years | 25 (52.1%) | 0 (0.0%) |
| 20 to 24 Years | 0 (0.0%) | 0 (0.0%) |
| 25 to 29 Years | 6 (100.0%) | 6 (100.0%) |
| 30 to 34 Years | 7 (25.0%) | 0 (0.0%) |
| 35 to 44 Years | 38 (76.0%) | 0 (0.0%) |
| 45 to 54 Years | 33 (73.3%) | 13 (39.4%) |
| 55 to 59 Years | 16 (53.3%) | 0 (0.0%) |
| 60 to 64 Years | 13 (100.0%) | 0 (0.0%) |
| 65 to 74 Years | 0 (0.0%) | 0 (0.0%) |
| 75 Years and over | 0 (0.0%) | 0 (0.0%) |
| Total | 138 (50.9%) | 19 (13.8%) |
Employment Status by Educational Attainment in Smith Corner
According to labor force statistics for Smith Corner, 65.7% of individuals (113) out of the total population between 25 and 64 years of age (172) are in the labor force, with 16.8% or 19 of them being unemployed. The group with the highest labor force participation rate are those with the educational attainment of college / associate degree, with 100.0% or 6 individuals in the labor force. Within the labor force, individuals with college / associate degree education have the highest percentage of unemployment, with 100.0% or 6 of them being unemployed.
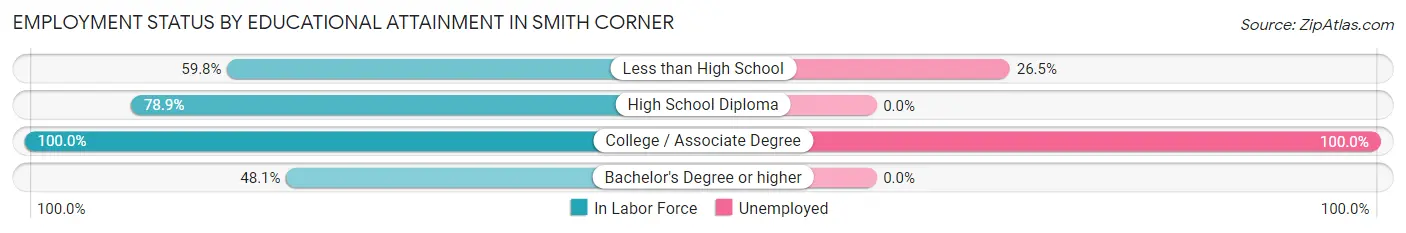
| Educational Attainment | In Labor Force | Unemployed |
| Less than High School | 49 (59.8%) | 22 (26.5%) |
| High School Diploma | 45 (78.9%) | 0 (0.0%) |
| College / Associate Degree | 6 (100.0%) | 6 (100.0%) |
| Bachelor's Degree or higher | 13 (48.1%) | 0 (0.0%) |
| Total | 113 (65.7%) | 29 (16.8%) |
Employment Occupations by Sex in Smith Corner
Management, Business, Science and Arts Occupations
The most common Management, Business, Science and Arts occupations in Smith Corner are Health Diagnosing & Treating (13 | 10.9%), Health Technologists (13 | 10.9%), Computers, Engineering & Science (7 | 5.9%), and Computers & Mathematics (7 | 5.9%).
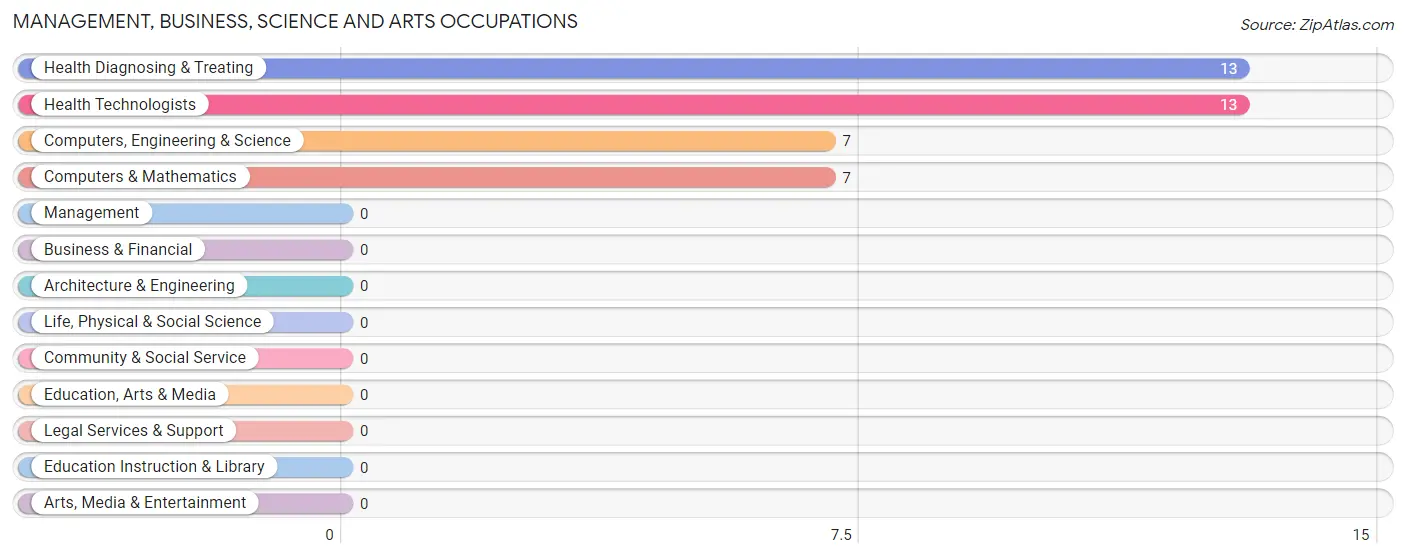
Management, Business, Science and Arts Occupations by Sex
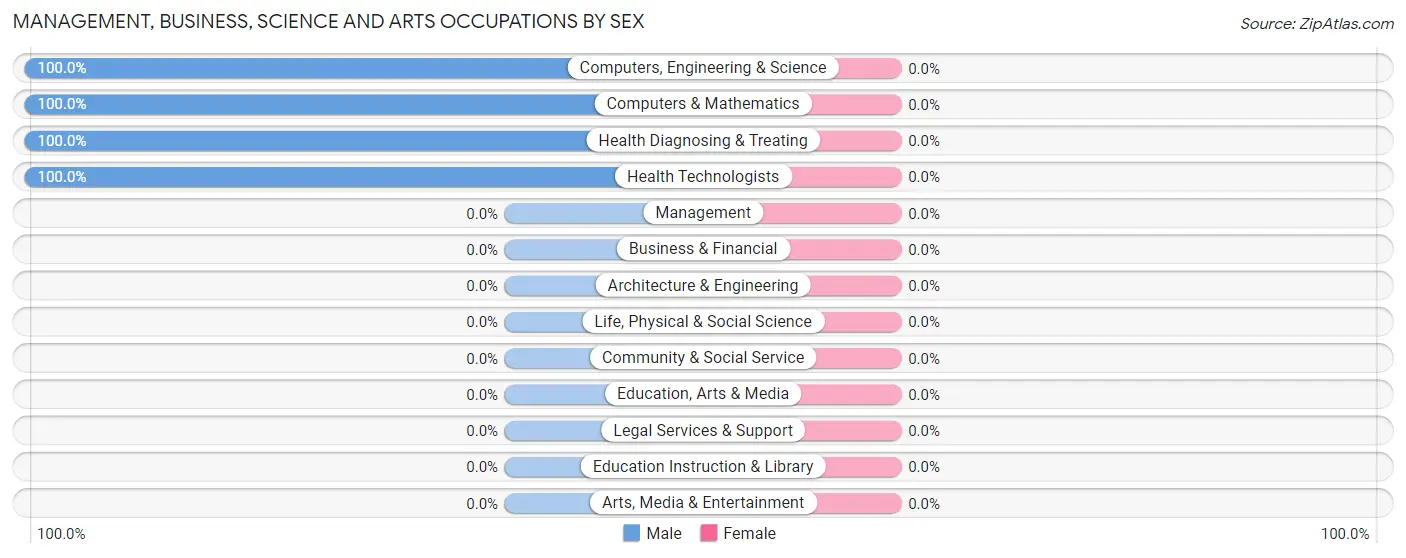
| Occupation | Male | Female |
| Management | 0 (0.0%) | 0 (0.0%) |
| Business & Financial | 0 (0.0%) | 0 (0.0%) |
| Computers, Engineering & Science | 7 (100.0%) | 0 (0.0%) |
| Computers & Mathematics | 7 (100.0%) | 0 (0.0%) |
| Architecture & Engineering | 0 (0.0%) | 0 (0.0%) |
| Life, Physical & Social Science | 0 (0.0%) | 0 (0.0%) |
| Community & Social Service | 0 (0.0%) | 0 (0.0%) |
| Education, Arts & Media | 0 (0.0%) | 0 (0.0%) |
| Legal Services & Support | 0 (0.0%) | 0 (0.0%) |
| Education Instruction & Library | 0 (0.0%) | 0 (0.0%) |
| Arts, Media & Entertainment | 0 (0.0%) | 0 (0.0%) |
| Health Diagnosing & Treating | 13 (100.0%) | 0 (0.0%) |
| Health Technologists | 13 (100.0%) | 0 (0.0%) |
| Total (Category) | 20 (100.0%) | 0 (0.0%) |
| Total (Overall) | 70 (58.8%) | 49 (41.2%) |
Services Occupations
The most common Services occupations in Smith Corner are , and Healthcare Support (16 | 13.5%).
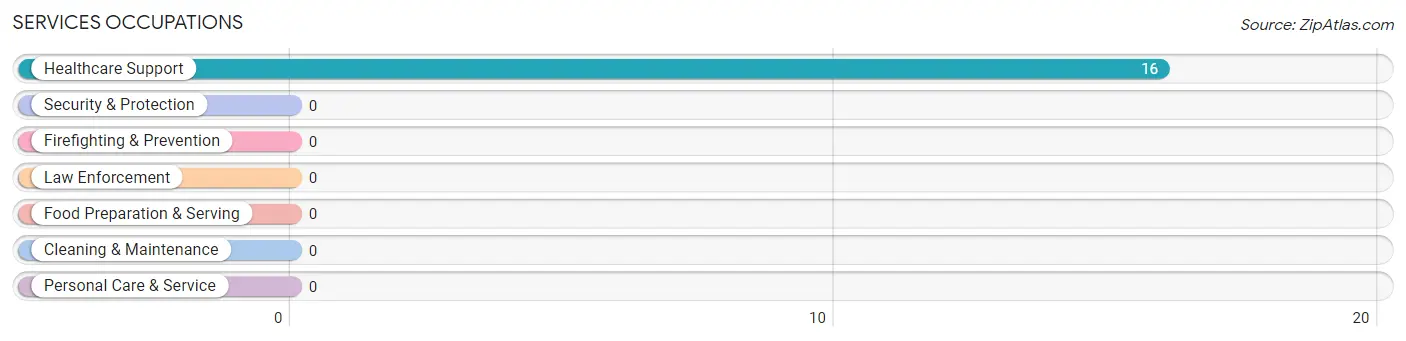
Services Occupations by Sex
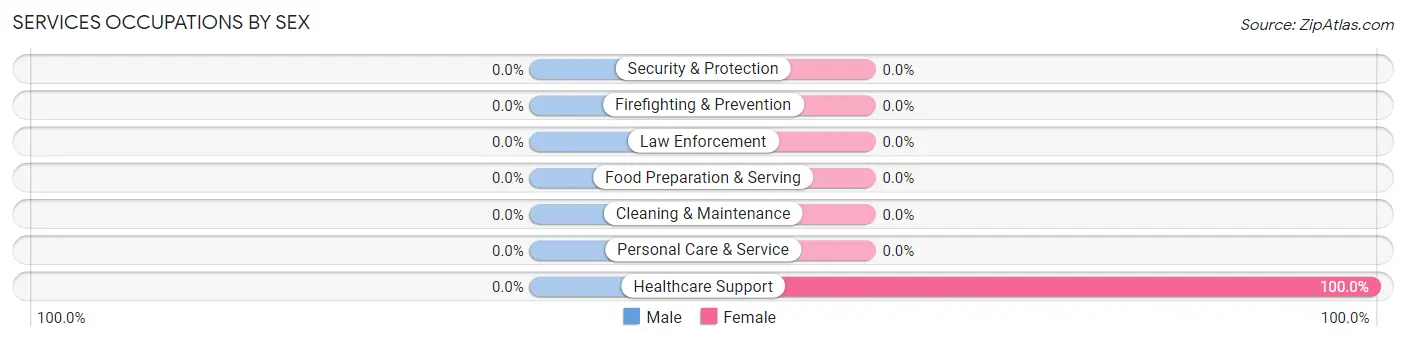
| Occupation | Male | Female |
| Healthcare Support | 0 (0.0%) | 16 (100.0%) |
| Security & Protection | 0 (0.0%) | 0 (0.0%) |
| Firefighting & Prevention | 0 (0.0%) | 0 (0.0%) |
| Law Enforcement | 0 (0.0%) | 0 (0.0%) |
| Food Preparation & Serving | 0 (0.0%) | 0 (0.0%) |
| Cleaning & Maintenance | 0 (0.0%) | 0 (0.0%) |
| Personal Care & Service | 0 (0.0%) | 0 (0.0%) |
| Total (Category) | 0 (0.0%) | 16 (100.0%) |
| Total (Overall) | 70 (58.8%) | 49 (41.2%) |
Sales and Office Occupations
The most common Sales and Office occupations in Smith Corner are , and Sales & Related (24 | 20.2%).
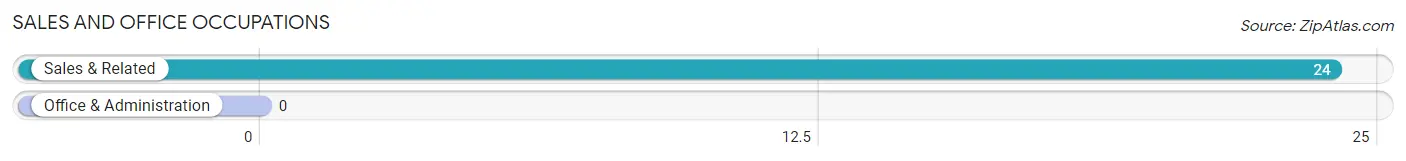
Sales and Office Occupations by Sex
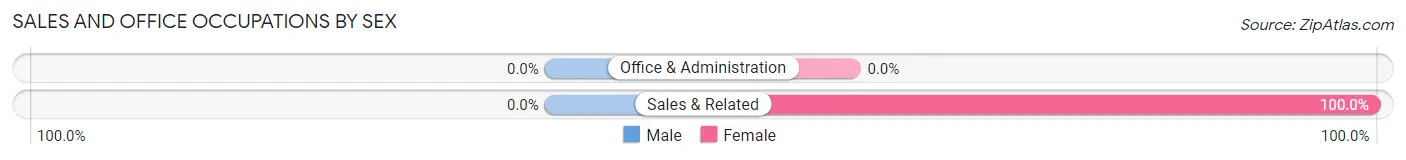
| Occupation | Male | Female |
| Sales & Related | 0 (0.0%) | 24 (100.0%) |
| Office & Administration | 0 (0.0%) | 0 (0.0%) |
| Total (Category) | 0 (0.0%) | 24 (100.0%) |
| Total (Overall) | 70 (58.8%) | 49 (41.2%) |
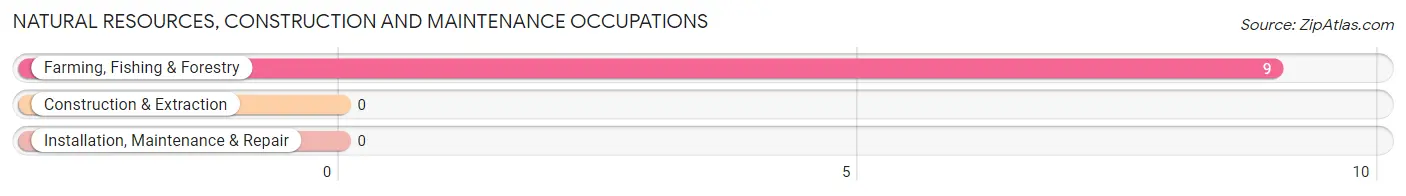
Natural Resources, Construction and Maintenance Occupations
The most common Natural Resources, Construction and Maintenance occupations in Smith Corner are , and Farming, Fishing & Forestry (9 | 7.6%).
Natural Resources, Construction and Maintenance Occupations by Sex
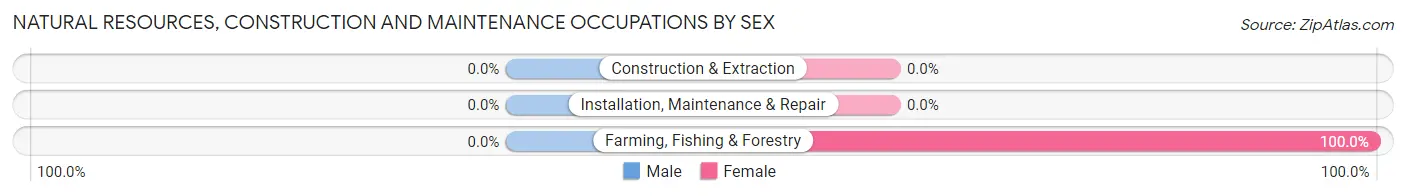
| Occupation | Male | Female |
| Farming, Fishing & Forestry | 0 (0.0%) | 9 (100.0%) |
| Construction & Extraction | 0 (0.0%) | 0 (0.0%) |
| Installation, Maintenance & Repair | 0 (0.0%) | 0 (0.0%) |
| Total (Category) | 0 (0.0%) | 9 (100.0%) |
| Total (Overall) | 70 (58.8%) | 49 (41.2%) |
Production, Transportation and Moving Occupations
The most common Production, Transportation and Moving occupations in Smith Corner are , and Material Moving (50 | 42.0%).
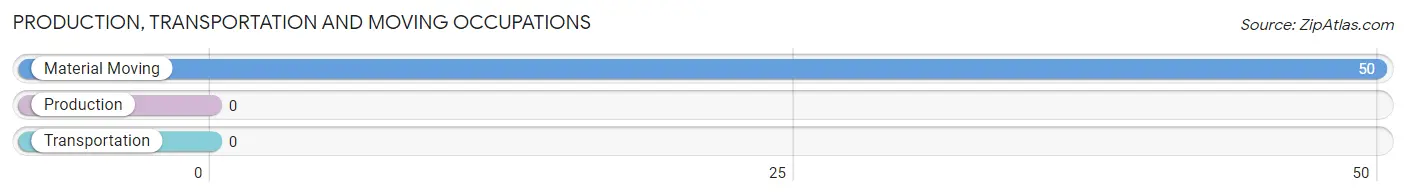
Production, Transportation and Moving Occupations by Sex
| Occupation | Male | Female |
| Production | 0 (0.0%) | 0 (0.0%) |
| Transportation | 0 (0.0%) | 0 (0.0%) |
| Material Moving | 50 (100.0%) | 0 (0.0%) |
| Total (Category) | 50 (100.0%) | 0 (0.0%) |
| Total (Overall) | 70 (58.8%) | 49 (41.2%) |
Employment Industries by Sex in Smith Corner
Employment Industries in Smith Corner
The major employment industries in Smith Corner include Retail Trade (60 | 50.4%), Health Care & Social Assistance (29 | 24.4%), Administrative & Support (14 | 11.8%), Agriculture, Fishing & Hunting (9 | 7.6%), and Public Administration (7 | 5.9%).
Employment Industries by Sex in Smith Corner
The Smith Corner industries that see more men than women are Administrative & Support (100.0%), Public Administration (100.0%), and Retail Trade (60.0%), whereas the industries that tend to have a higher number of women are Agriculture, Fishing & Hunting (100.0%), Health Care & Social Assistance (55.2%), and Retail Trade (40.0%).
| Industry | Male | Female |
| Agriculture, Fishing & Hunting | 0 (0.0%) | 9 (100.0%) |
| Mining, Quarrying, & Extraction | 0 (0.0%) | 0 (0.0%) |
| Construction | 0 (0.0%) | 0 (0.0%) |
| Manufacturing | 0 (0.0%) | 0 (0.0%) |
| Wholesale Trade | 0 (0.0%) | 0 (0.0%) |
| Retail Trade | 36 (60.0%) | 24 (40.0%) |
| Transportation & Warehousing | 0 (0.0%) | 0 (0.0%) |
| Utilities | 0 (0.0%) | 0 (0.0%) |
| Information | 0 (0.0%) | 0 (0.0%) |
| Finance & Insurance | 0 (0.0%) | 0 (0.0%) |
| Real Estate, Rental & Leasing | 0 (0.0%) | 0 (0.0%) |
| Professional & Scientific | 0 (0.0%) | 0 (0.0%) |
| Enterprise Management | 0 (0.0%) | 0 (0.0%) |
| Administrative & Support | 14 (100.0%) | 0 (0.0%) |
| Educational Services | 0 (0.0%) | 0 (0.0%) |
| Health Care & Social Assistance | 13 (44.8%) | 16 (55.2%) |
| Arts, Entertainment & Recreation | 0 (0.0%) | 0 (0.0%) |
| Accommodation & Food Services | 0 (0.0%) | 0 (0.0%) |
| Public Administration | 7 (100.0%) | 0 (0.0%) |
| Total | 70 (58.8%) | 49 (41.2%) |
Education in Smith Corner
School Enrollment in Smith Corner
The most common levels of schooling among the 61 students in Smith Corner are high school (23 | 37.7%), middle school (16 | 26.2%), and college / undergraduate (12 | 19.7%).
| School Level | # Students | % Students |
| Nursery / Preschool | 0 | 0.0% |
| Kindergarten | 0 | 0.0% |
| Elementary School | 10 | 16.4% |
| Middle School | 16 | 26.2% |
| High School | 23 | 37.7% |
| College / Undergraduate | 12 | 19.7% |
| Graduate / Professional | 0 | 0.0% |
| Total | 61 | 100.0% |
School Enrollment by Age by Funding Source in Smith Corner
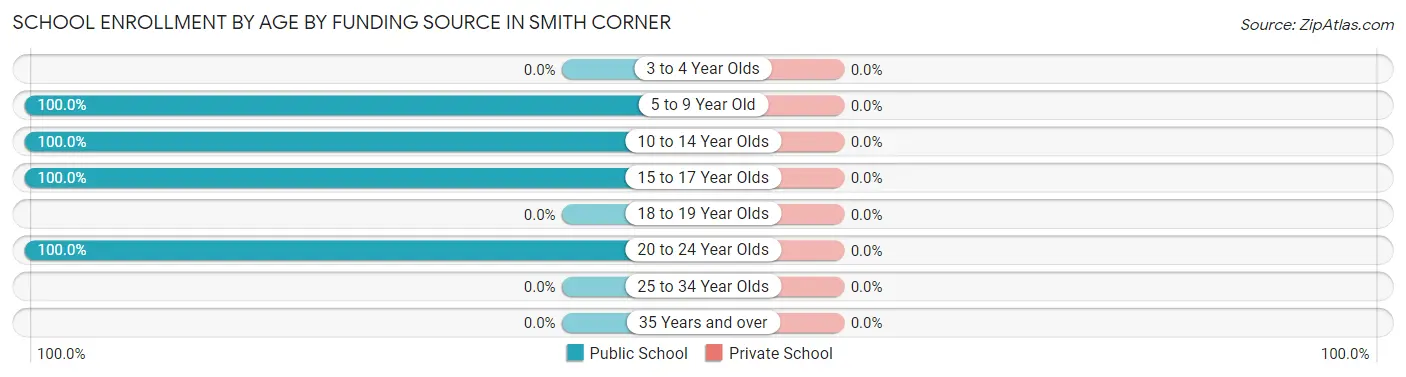
| Age Bracket | Public School | Private School |
| 3 to 4 Year Olds | 0 (0.0%) | 0 (0.0%) |
| 5 to 9 Year Old | 10 (100.0%) | 0 (0.0%) |
| 10 to 14 Year Olds | 16 (100.0%) | 0 (0.0%) |
| 15 to 17 Year Olds | 23 (100.0%) | 0 (0.0%) |
| 18 to 19 Year Olds | 0 (0.0%) | 0 (0.0%) |
| 20 to 24 Year Olds | 12 (100.0%) | 0 (0.0%) |
| 25 to 34 Year Olds | 0 (0.0%) | 0 (0.0%) |
| 35 Years and over | 0 (0.0%) | 0 (0.0%) |
| Total | 61 (100.0%) | 0 (0.0%) |
Educational Attainment by Field of Study in Smith Corner
, and bio, nature & agricultural (27 | 100.0%) are the most common fields of study among 27 individuals in Smith Corner who have obtained a bachelor's degree or higher.
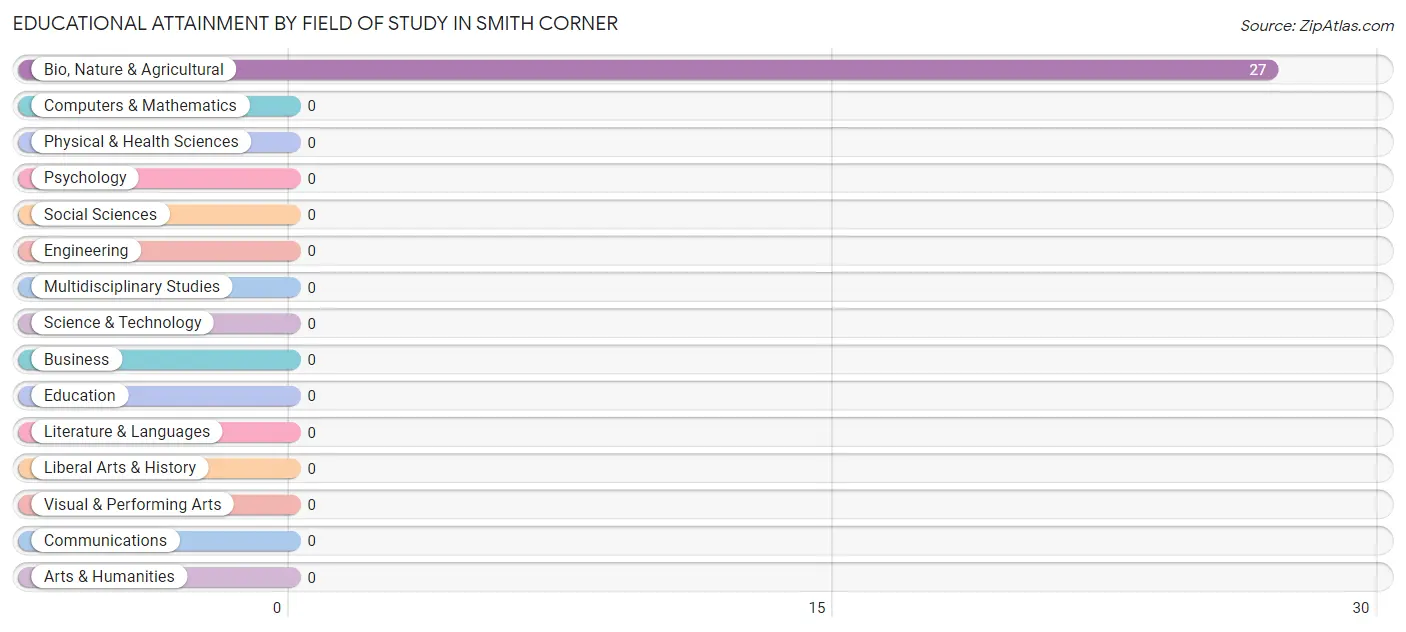
| Field of Study | # Graduates | % Graduates |
| Computers & Mathematics | 0 | 0.0% |
| Bio, Nature & Agricultural | 27 | 100.0% |
| Physical & Health Sciences | 0 | 0.0% |
| Psychology | 0 | 0.0% |
| Social Sciences | 0 | 0.0% |
| Engineering | 0 | 0.0% |
| Multidisciplinary Studies | 0 | 0.0% |
| Science & Technology | 0 | 0.0% |
| Business | 0 | 0.0% |
| Education | 0 | 0.0% |
| Literature & Languages | 0 | 0.0% |
| Liberal Arts & History | 0 | 0.0% |
| Visual & Performing Arts | 0 | 0.0% |
| Communications | 0 | 0.0% |
| Arts & Humanities | 0 | 0.0% |
| Total | 27 | 100.0% |
Transportation & Commute in Smith Corner
Vehicle Availability by Sex in Smith Corner
The most prevalent vehicle ownership categories in Smith Corner are males with 2 vehicles (32, accounting for 56.1%) and females with 2 vehicles (9, making up 65.3%).
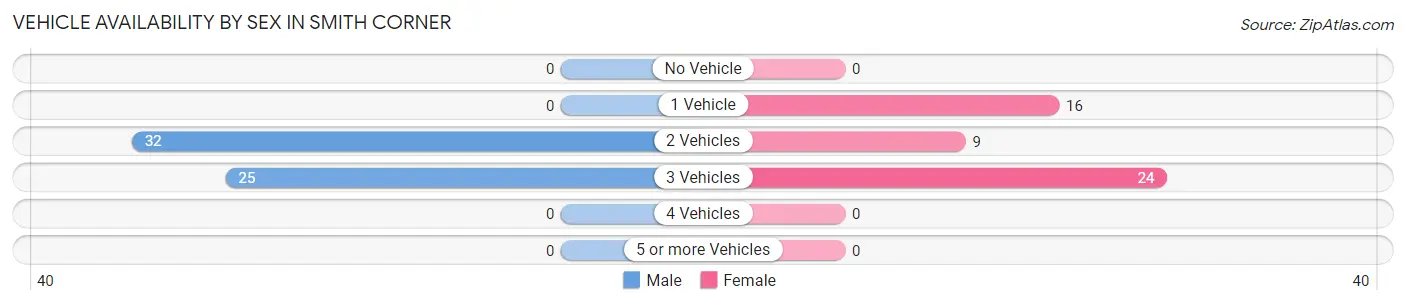
| Vehicles Available | Male | Female |
| No Vehicle | 0 (0.0%) | 0 (0.0%) |
| 1 Vehicle | 0 (0.0%) | 16 (32.7%) |
| 2 Vehicles | 32 (56.1%) | 9 (18.4%) |
| 3 Vehicles | 25 (43.9%) | 24 (49.0%) |
| 4 Vehicles | 0 (0.0%) | 0 (0.0%) |
| 5 or more Vehicles | 0 (0.0%) | 0 (0.0%) |
| Total | 57 (100.0%) | 49 (100.0%) |
Commute Time in Smith Corner
The most frequently occuring commute durations in Smith Corner are 15 to 19 minutes (45 commuters, 42.4%), 20 to 24 minutes (24 commuters, 22.6%), and 10 to 14 minutes (16 commuters, 15.1%).
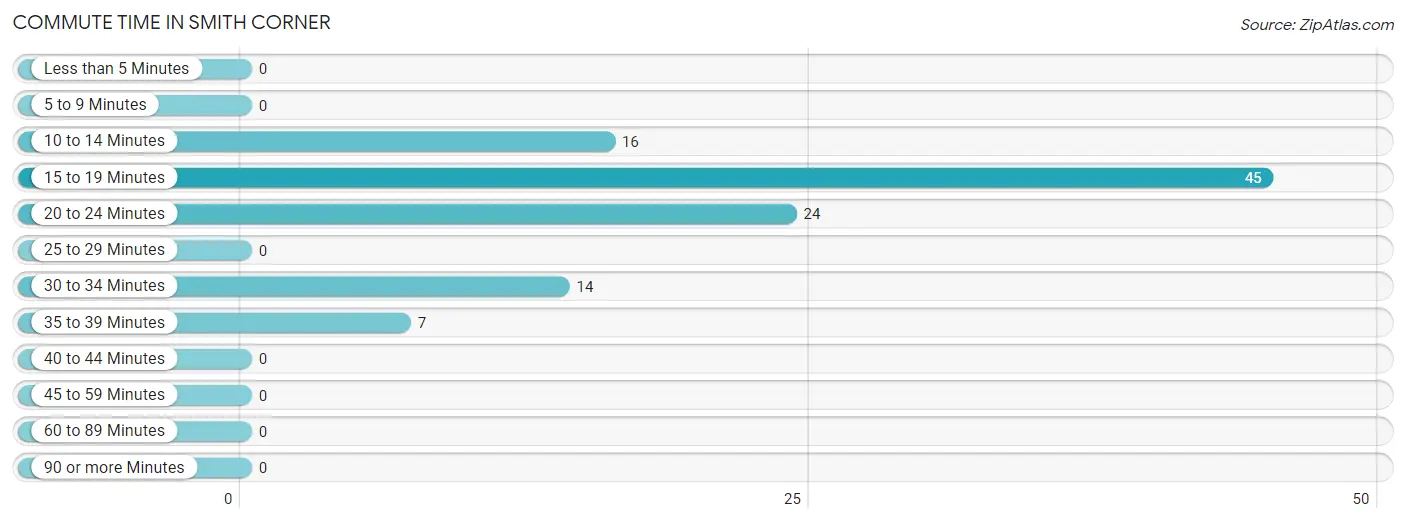
| Commute Time | # Commuters | % Commuters |
| Less than 5 Minutes | 0 | 0.0% |
| 5 to 9 Minutes | 0 | 0.0% |
| 10 to 14 Minutes | 16 | 15.1% |
| 15 to 19 Minutes | 45 | 42.4% |
| 20 to 24 Minutes | 24 | 22.6% |
| 25 to 29 Minutes | 0 | 0.0% |
| 30 to 34 Minutes | 14 | 13.2% |
| 35 to 39 Minutes | 7 | 6.6% |
| 40 to 44 Minutes | 0 | 0.0% |
| 45 to 59 Minutes | 0 | 0.0% |
| 60 to 89 Minutes | 0 | 0.0% |
| 90 or more Minutes | 0 | 0.0% |
Commute Time by Sex in Smith Corner
The most common commute times in Smith Corner are 15 to 19 minutes (36 commuters, 63.2%) for males and 20 to 24 minutes (24 commuters, 49.0%) for females.
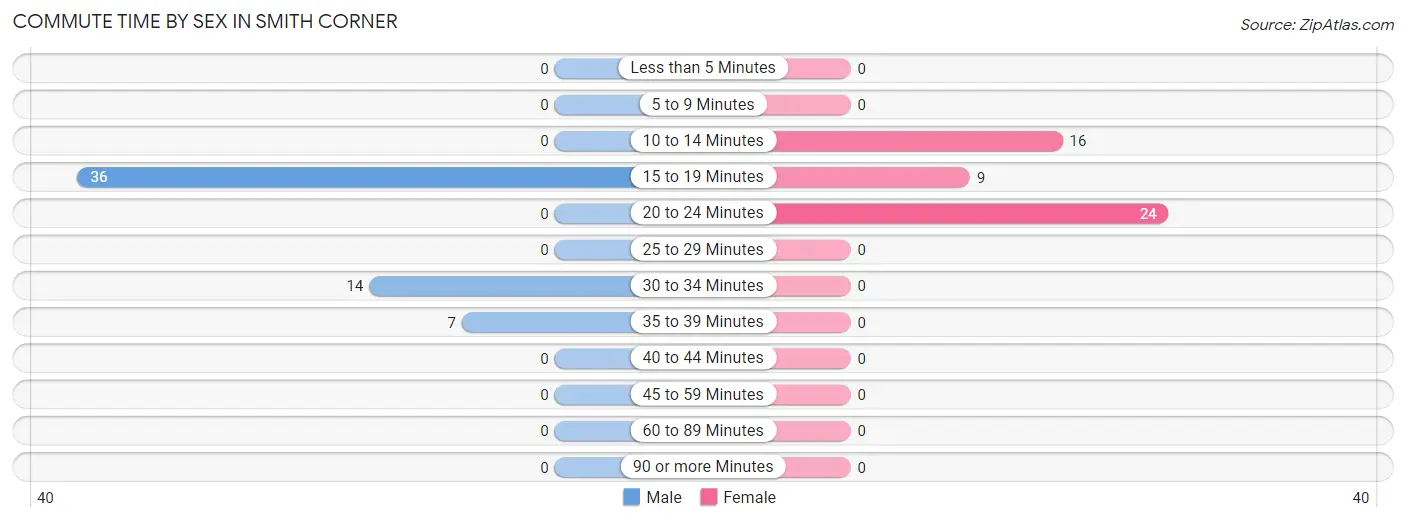
| Commute Time | Male | Female |
| Less than 5 Minutes | 0 (0.0%) | 0 (0.0%) |
| 5 to 9 Minutes | 0 (0.0%) | 0 (0.0%) |
| 10 to 14 Minutes | 0 (0.0%) | 16 (32.7%) |
| 15 to 19 Minutes | 36 (63.2%) | 9 (18.4%) |
| 20 to 24 Minutes | 0 (0.0%) | 24 (49.0%) |
| 25 to 29 Minutes | 0 (0.0%) | 0 (0.0%) |
| 30 to 34 Minutes | 14 (24.6%) | 0 (0.0%) |
| 35 to 39 Minutes | 7 (12.3%) | 0 (0.0%) |
| 40 to 44 Minutes | 0 (0.0%) | 0 (0.0%) |
| 45 to 59 Minutes | 0 (0.0%) | 0 (0.0%) |
| 60 to 89 Minutes | 0 (0.0%) | 0 (0.0%) |
| 90 or more Minutes | 0 (0.0%) | 0 (0.0%) |
Time of Departure to Work by Sex in Smith Corner
The most frequent times of departure to work in Smith Corner are 7:30 AM to 7:59 AM (36, 63.2%) for males and 6:00 AM to 6:29 AM (33, 67.3%) for females.
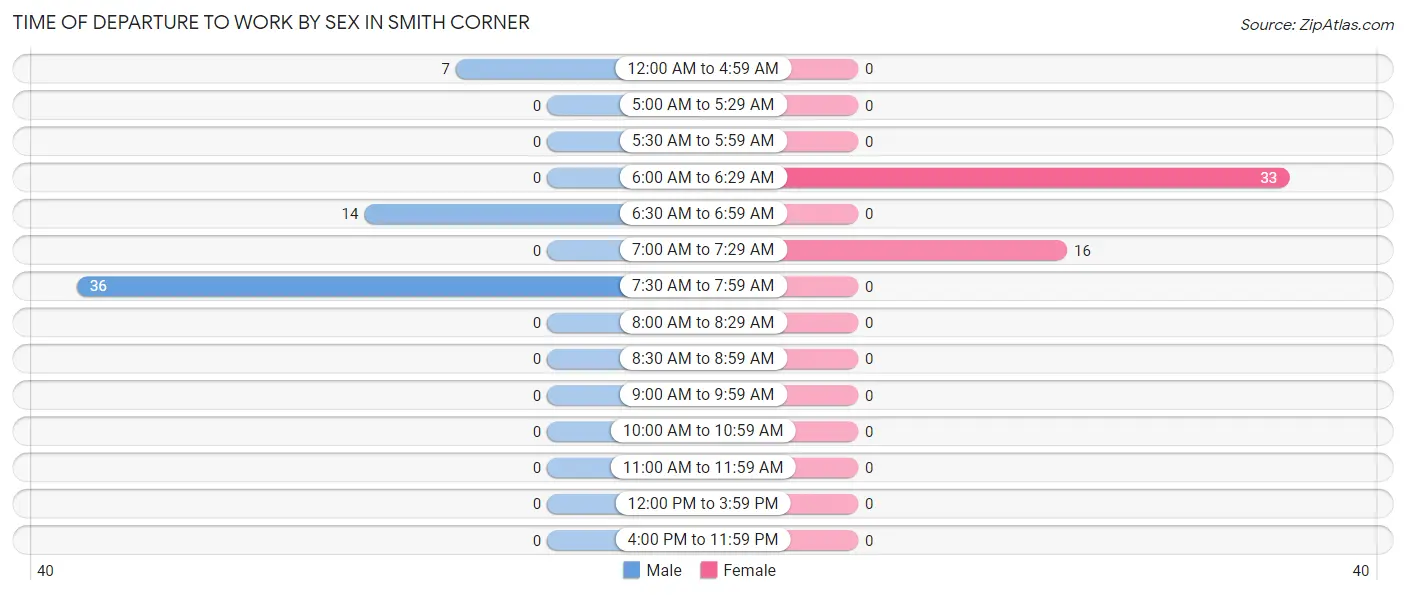
| Time of Departure | Male | Female |
| 12:00 AM to 4:59 AM | 7 (12.3%) | 0 (0.0%) |
| 5:00 AM to 5:29 AM | 0 (0.0%) | 0 (0.0%) |
| 5:30 AM to 5:59 AM | 0 (0.0%) | 0 (0.0%) |
| 6:00 AM to 6:29 AM | 0 (0.0%) | 33 (67.3%) |
| 6:30 AM to 6:59 AM | 14 (24.6%) | 0 (0.0%) |
| 7:00 AM to 7:29 AM | 0 (0.0%) | 16 (32.7%) |
| 7:30 AM to 7:59 AM | 36 (63.2%) | 0 (0.0%) |
| 8:00 AM to 8:29 AM | 0 (0.0%) | 0 (0.0%) |
| 8:30 AM to 8:59 AM | 0 (0.0%) | 0 (0.0%) |
| 9:00 AM to 9:59 AM | 0 (0.0%) | 0 (0.0%) |
| 10:00 AM to 10:59 AM | 0 (0.0%) | 0 (0.0%) |
| 11:00 AM to 11:59 AM | 0 (0.0%) | 0 (0.0%) |
| 12:00 PM to 3:59 PM | 0 (0.0%) | 0 (0.0%) |
| 4:00 PM to 11:59 PM | 0 (0.0%) | 0 (0.0%) |
| Total | 57 (100.0%) | 49 (100.0%) |
Housing Occupancy in Smith Corner
Occupancy by Ownership in Smith Corner
Of the total 93 dwellings in Smith Corner, owner-occupied units account for 63 (67.7%), while renter-occupied units make up 30 (32.3%).
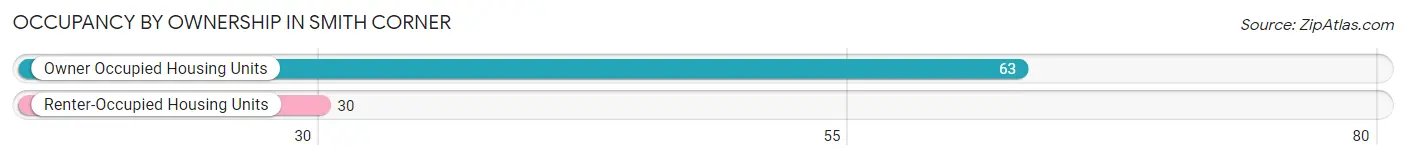
| Occupancy | # Housing Units | % Housing Units |
| Owner Occupied Housing Units | 63 | 67.7% |
| Renter-Occupied Housing Units | 30 | 32.3% |
| Total Occupied Housing Units | 93 | 100.0% |
Occupancy by Household Size in Smith Corner
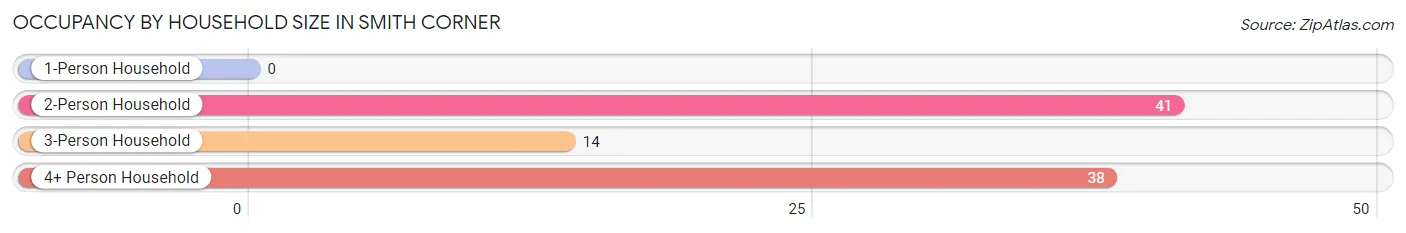
| Household Size | # Housing Units | % Housing Units |
| 1-Person Household | 0 | 0.0% |
| 2-Person Household | 41 | 44.1% |
| 3-Person Household | 14 | 15.0% |
| 4+ Person Household | 38 | 40.9% |
| Total Housing Units | 93 | 100.0% |
Occupancy by Ownership by Household Size in Smith Corner
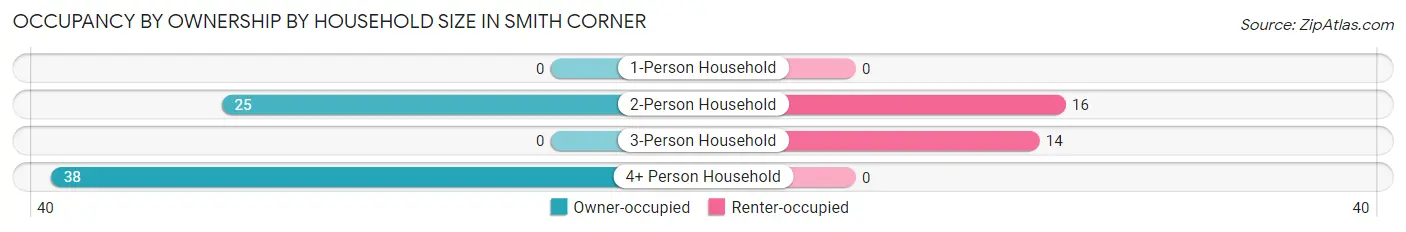
| Household Size | Owner-occupied | Renter-occupied |
| 1-Person Household | 0 (0.0%) | 0 (0.0%) |
| 2-Person Household | 25 (61.0%) | 16 (39.0%) |
| 3-Person Household | 0 (0.0%) | 14 (100.0%) |
| 4+ Person Household | 38 (100.0%) | 0 (0.0%) |
| Total Housing Units | 63 (67.7%) | 30 (32.3%) |
Occupancy by Educational Attainment in Smith Corner
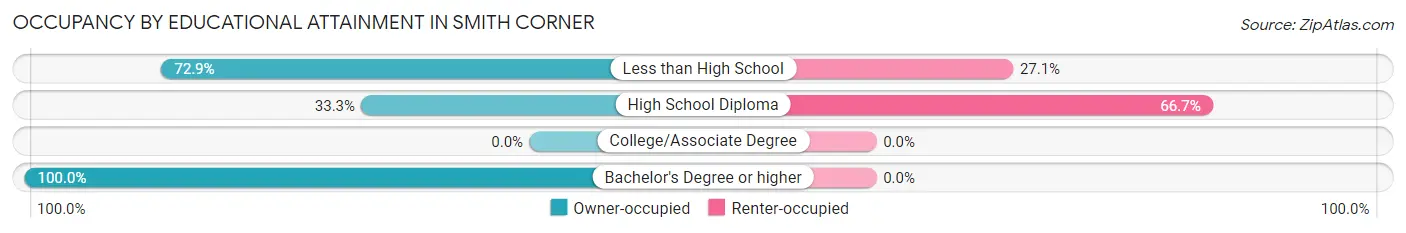
| Household Size | Owner-occupied | Renter-occupied |
| Less than High School | 43 (72.9%) | 16 (27.1%) |
| High School Diploma | 7 (33.3%) | 14 (66.7%) |
| College/Associate Degree | 0 (0.0%) | 0 (0.0%) |
| Bachelor's Degree or higher | 13 (100.0%) | 0 (0.0%) |
Occupancy by Age of Householder in Smith Corner
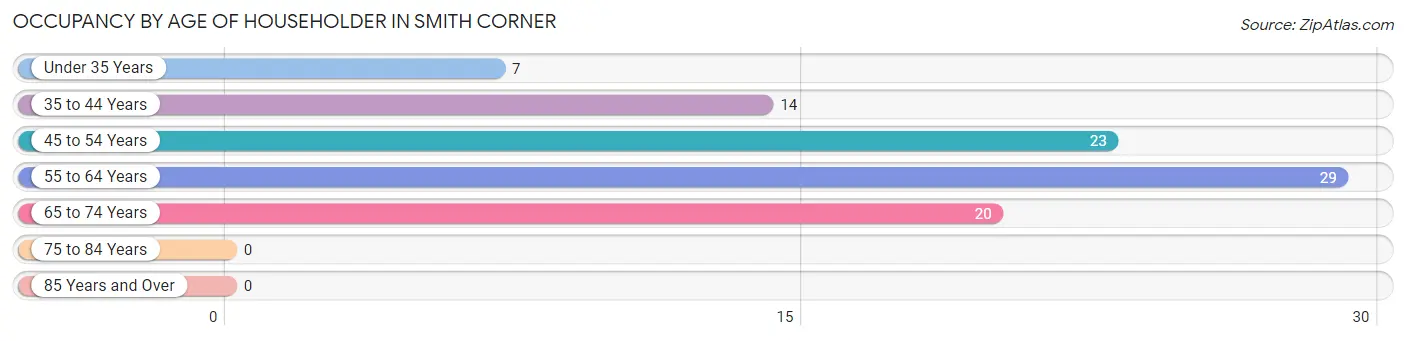
| Age Bracket | # Households | % Households |
| Under 35 Years | 7 | 7.5% |
| 35 to 44 Years | 14 | 15.0% |
| 45 to 54 Years | 23 | 24.7% |
| 55 to 64 Years | 29 | 31.2% |
| 65 to 74 Years | 20 | 21.5% |
| 75 to 84 Years | 0 | 0.0% |
| 85 Years and Over | 0 | 0.0% |
| Total | 93 | 100.0% |
Housing Finances in Smith Corner
Median Income by Occupancy in Smith Corner
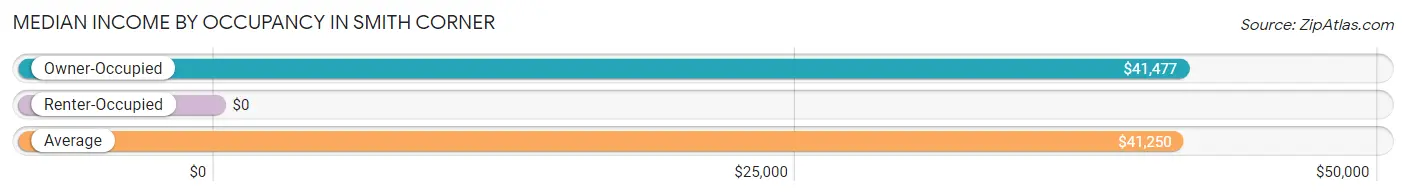
| Occupancy Type | # Households | Median Income |
| Owner-Occupied | 63 (67.7%) | $41,477 |
| Renter-Occupied | 30 (32.3%) | $0 |
| Average | 93 (100.0%) | $41,250 |
Occupancy by Householder Income Bracket in Smith Corner
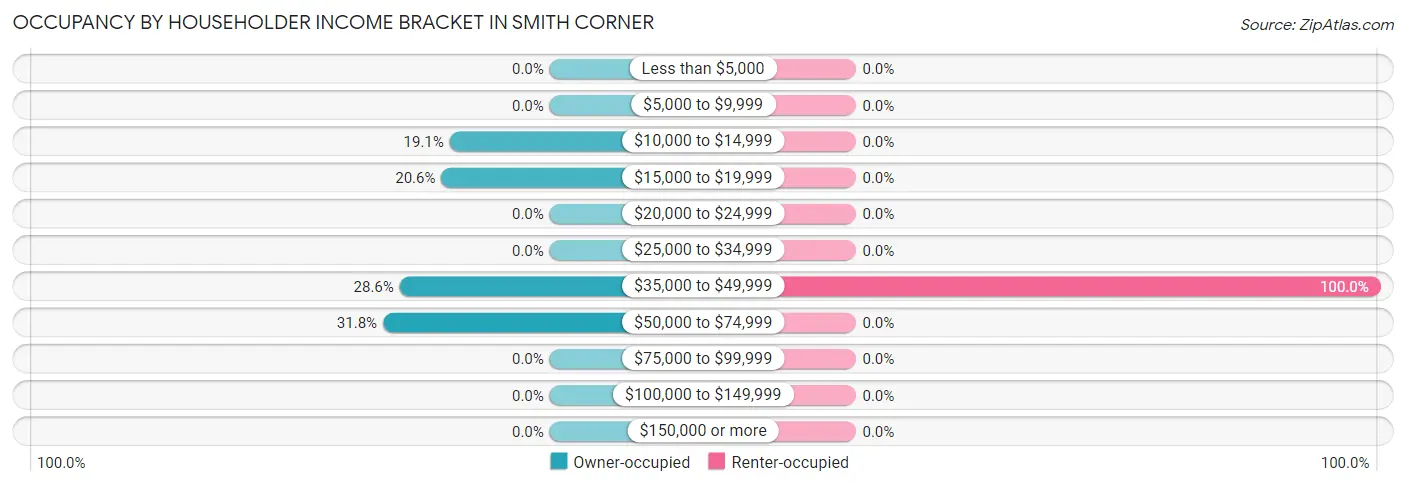
| Income Bracket | Owner-occupied | Renter-occupied |
| Less than $5,000 | 0 (0.0%) | 0 (0.0%) |
| $5,000 to $9,999 | 0 (0.0%) | 0 (0.0%) |
| $10,000 to $14,999 | 12 (19.1%) | 0 (0.0%) |
| $15,000 to $19,999 | 13 (20.6%) | 0 (0.0%) |
| $20,000 to $24,999 | 0 (0.0%) | 0 (0.0%) |
| $25,000 to $34,999 | 0 (0.0%) | 0 (0.0%) |
| $35,000 to $49,999 | 18 (28.6%) | 30 (100.0%) |
| $50,000 to $74,999 | 20 (31.8%) | 0 (0.0%) |
| $75,000 to $99,999 | 0 (0.0%) | 0 (0.0%) |
| $100,000 to $149,999 | 0 (0.0%) | 0 (0.0%) |
| $150,000 or more | 0 (0.0%) | 0 (0.0%) |
| Total | 63 (100.0%) | 30 (100.0%) |
Monthly Housing Cost Tiers in Smith Corner
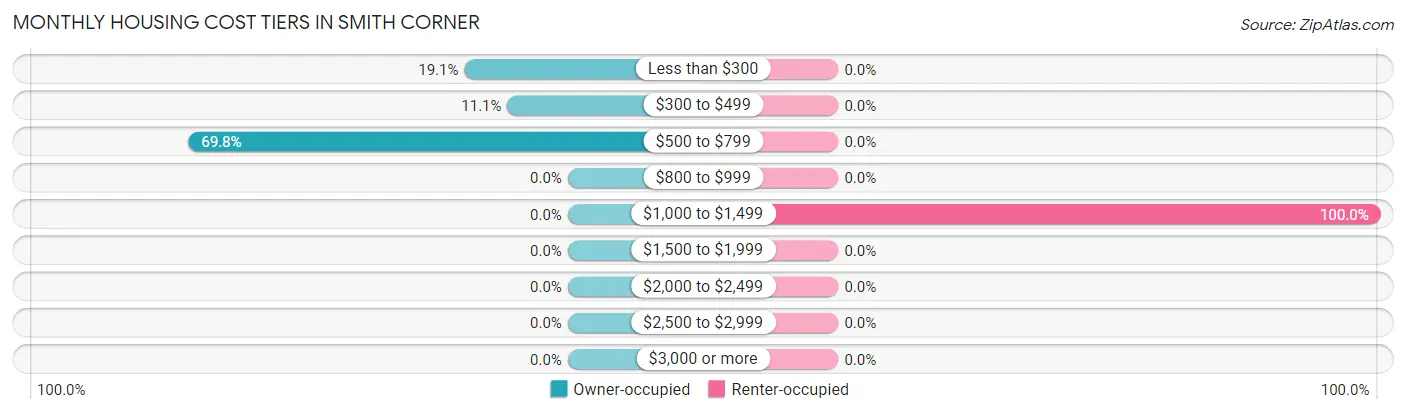
| Monthly Cost | Owner-occupied | Renter-occupied |
| Less than $300 | 12 (19.1%) | 0 (0.0%) |
| $300 to $499 | 7 (11.1%) | 0 (0.0%) |
| $500 to $799 | 44 (69.8%) | 0 (0.0%) |
| $800 to $999 | 0 (0.0%) | 0 (0.0%) |
| $1,000 to $1,499 | 0 (0.0%) | 30 (100.0%) |
| $1,500 to $1,999 | 0 (0.0%) | 0 (0.0%) |
| $2,000 to $2,499 | 0 (0.0%) | 0 (0.0%) |
| $2,500 to $2,999 | 0 (0.0%) | 0 (0.0%) |
| $3,000 or more | 0 (0.0%) | 0 (0.0%) |
| Total | 63 (100.0%) | 30 (100.0%) |
Physical Housing Characteristics in Smith Corner
Housing Structures in Smith Corner
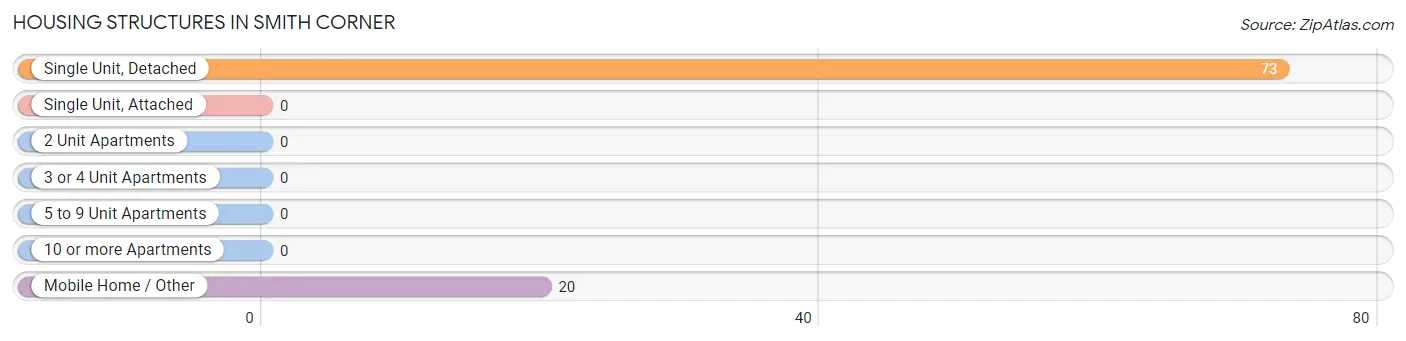
| Structure Type | # Housing Units | % Housing Units |
| Single Unit, Detached | 73 | 78.5% |
| Single Unit, Attached | 0 | 0.0% |
| 2 Unit Apartments | 0 | 0.0% |
| 3 or 4 Unit Apartments | 0 | 0.0% |
| 5 to 9 Unit Apartments | 0 | 0.0% |
| 10 or more Apartments | 0 | 0.0% |
| Mobile Home / Other | 20 | 21.5% |
| Total | 93 | 100.0% |
Housing Structures by Occupancy in Smith Corner
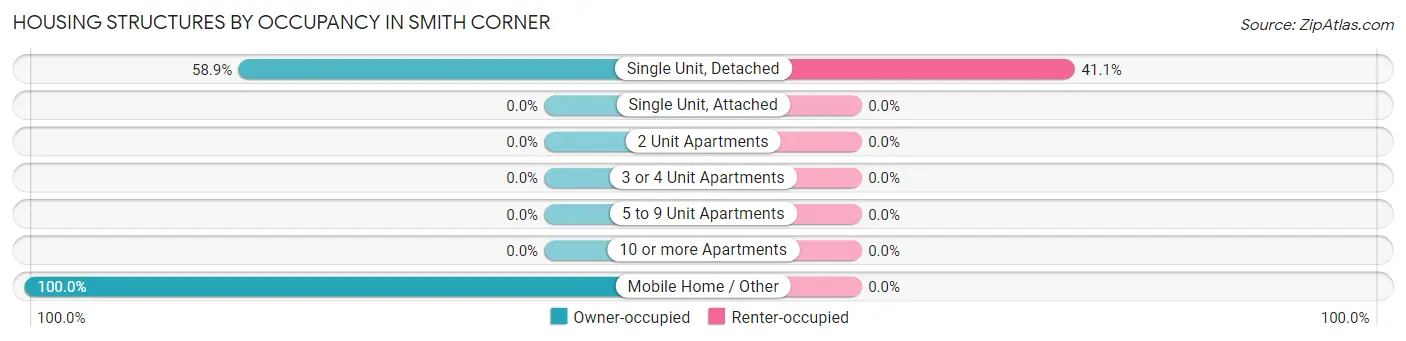
| Structure Type | Owner-occupied | Renter-occupied |
| Single Unit, Detached | 43 (58.9%) | 30 (41.1%) |
| Single Unit, Attached | 0 (0.0%) | 0 (0.0%) |
| 2 Unit Apartments | 0 (0.0%) | 0 (0.0%) |
| 3 or 4 Unit Apartments | 0 (0.0%) | 0 (0.0%) |
| 5 to 9 Unit Apartments | 0 (0.0%) | 0 (0.0%) |
| 10 or more Apartments | 0 (0.0%) | 0 (0.0%) |
| Mobile Home / Other | 20 (100.0%) | 0 (0.0%) |
| Total | 63 (67.7%) | 30 (32.3%) |
Housing Structures by Number of Rooms in Smith Corner
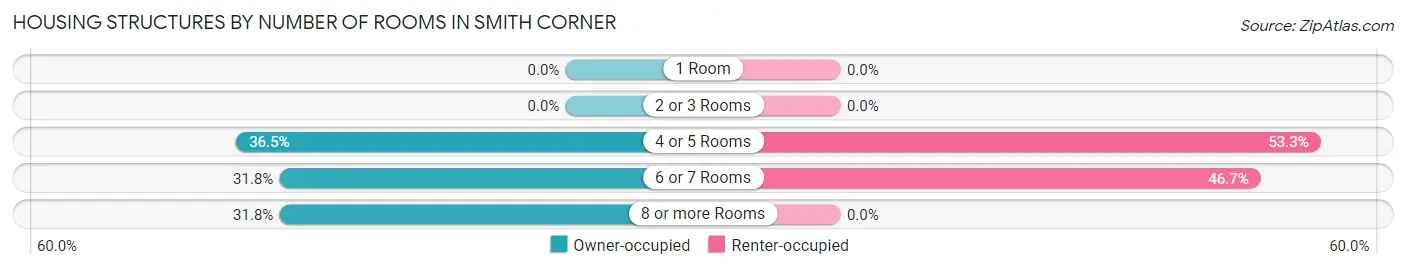
| Number of Rooms | Owner-occupied | Renter-occupied |
| 1 Room | 0 (0.0%) | 0 (0.0%) |
| 2 or 3 Rooms | 0 (0.0%) | 0 (0.0%) |
| 4 or 5 Rooms | 23 (36.5%) | 16 (53.3%) |
| 6 or 7 Rooms | 20 (31.8%) | 14 (46.7%) |
| 8 or more Rooms | 20 (31.8%) | 0 (0.0%) |
| Total | 63 (100.0%) | 30 (100.0%) |
Housing Structure by Heating Type in Smith Corner
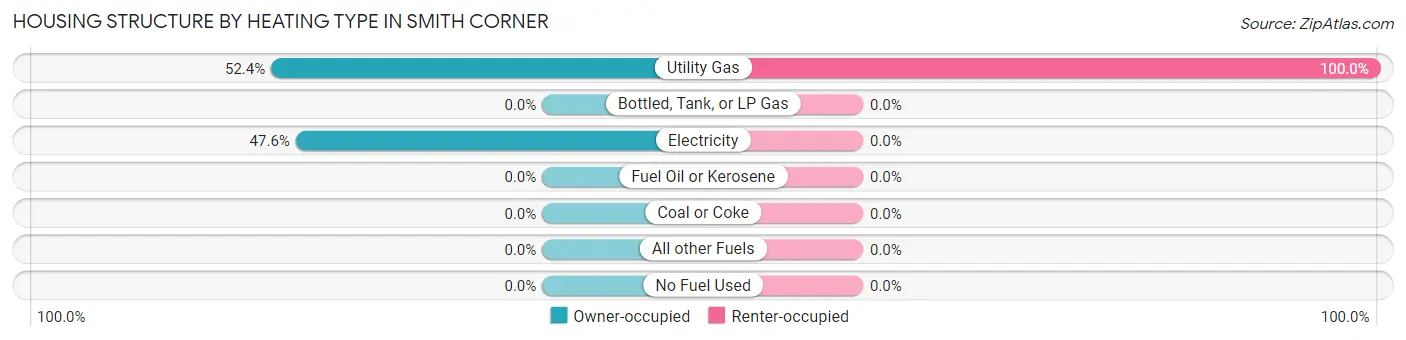
| Heating Type | Owner-occupied | Renter-occupied |
| Utility Gas | 33 (52.4%) | 30 (100.0%) |
| Bottled, Tank, or LP Gas | 0 (0.0%) | 0 (0.0%) |
| Electricity | 30 (47.6%) | 0 (0.0%) |
| Fuel Oil or Kerosene | 0 (0.0%) | 0 (0.0%) |
| Coal or Coke | 0 (0.0%) | 0 (0.0%) |
| All other Fuels | 0 (0.0%) | 0 (0.0%) |
| No Fuel Used | 0 (0.0%) | 0 (0.0%) |
| Total | 63 (100.0%) | 30 (100.0%) |
Household Vehicle Usage in Smith Corner
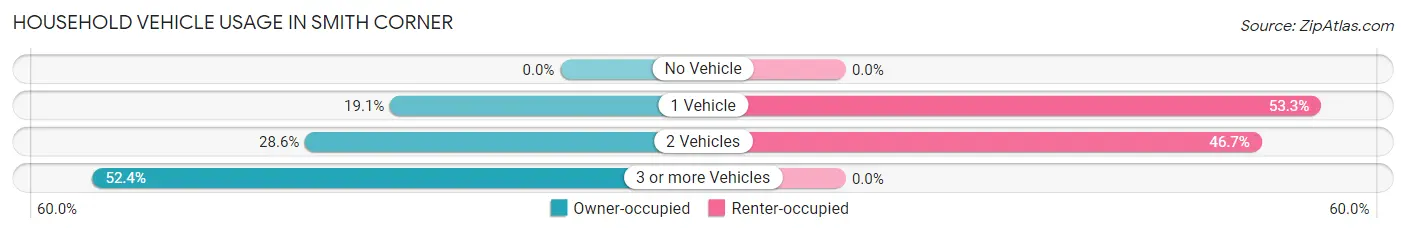
| Vehicles per Household | Owner-occupied | Renter-occupied |
| No Vehicle | 0 (0.0%) | 0 (0.0%) |
| 1 Vehicle | 12 (19.1%) | 16 (53.3%) |
| 2 Vehicles | 18 (28.6%) | 14 (46.7%) |
| 3 or more Vehicles | 33 (52.4%) | 0 (0.0%) |
| Total | 63 (100.0%) | 30 (100.0%) |
Real Estate & Mortgages in Smith Corner
Real Estate and Mortgage Overview in Smith Corner
| Characteristic | Without Mortgage | With Mortgage |
| Housing Units | 52 | 11 |
| Median Property Value | $95,000 | $0 |
| Median Household Income | - | - |
| Monthly Housing Costs | $554 | $0 |
| Real Estate Taxes | $1,675 | $0 |
Property Value by Mortgage Status in Smith Corner
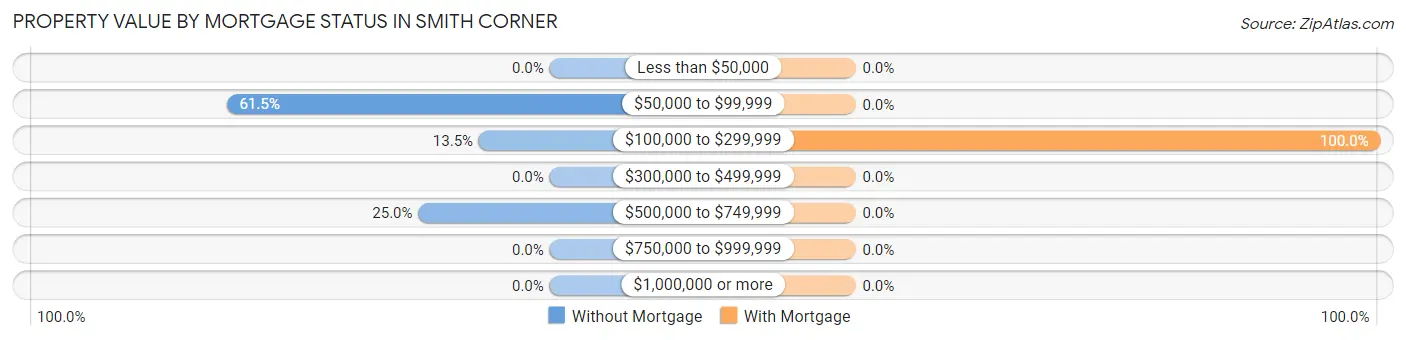
| Property Value | Without Mortgage | With Mortgage |
| Less than $50,000 | 0 (0.0%) | 0 (0.0%) |
| $50,000 to $99,999 | 32 (61.5%) | 0 (0.0%) |
| $100,000 to $299,999 | 7 (13.5%) | 11 (100.0%) |
| $300,000 to $499,999 | 0 (0.0%) | 0 (0.0%) |
| $500,000 to $749,999 | 13 (25.0%) | 0 (0.0%) |
| $750,000 to $999,999 | 0 (0.0%) | 0 (0.0%) |
| $1,000,000 or more | 0 (0.0%) | 0 (0.0%) |
| Total | 52 (100.0%) | 11 (100.0%) |
Household Income by Mortgage Status in Smith Corner
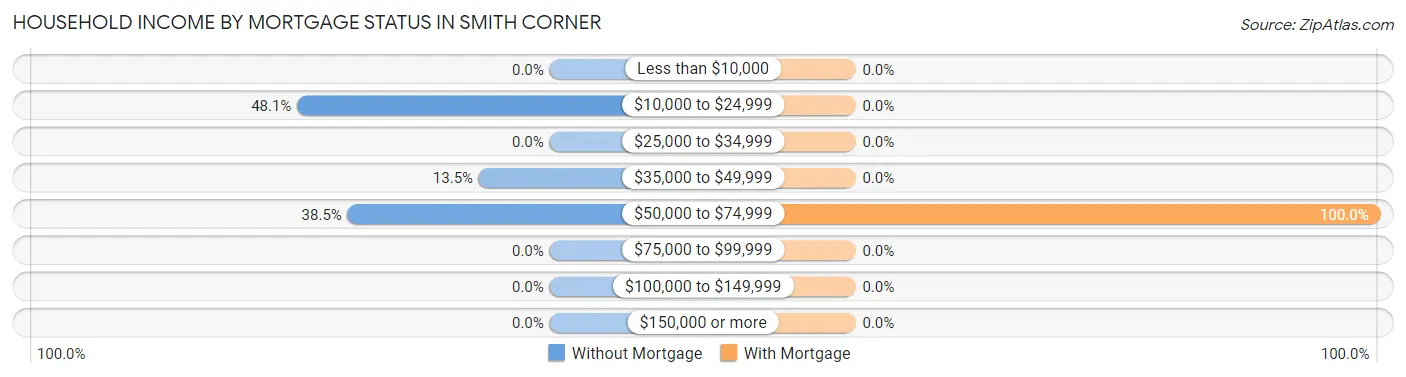
| Household Income | Without Mortgage | With Mortgage |
| Less than $10,000 | 0 (0.0%) | 0 (0.0%) |
| $10,000 to $24,999 | 25 (48.1%) | 0 (0.0%) |
| $25,000 to $34,999 | 0 (0.0%) | 0 (0.0%) |
| $35,000 to $49,999 | 7 (13.5%) | 0 (0.0%) |
| $50,000 to $74,999 | 20 (38.5%) | 11 (100.0%) |
| $75,000 to $99,999 | 0 (0.0%) | 0 (0.0%) |
| $100,000 to $149,999 | 0 (0.0%) | 0 (0.0%) |
| $150,000 or more | 0 (0.0%) | 0 (0.0%) |
| Total | 52 (100.0%) | 11 (100.0%) |
Property Value to Household Income Ratio in Smith Corner
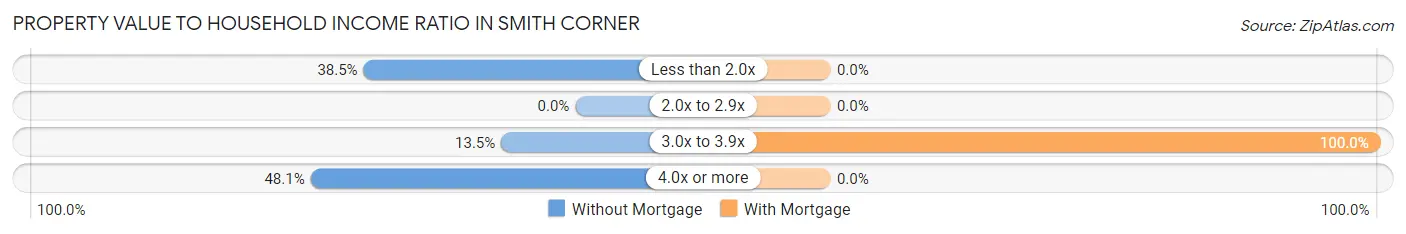
| Value-to-Income Ratio | Without Mortgage | With Mortgage |
| Less than 2.0x | 20 (38.5%) | 0 (0.0%) |
| 2.0x to 2.9x | 0 (0.0%) | 0 (0.0%) |
| 3.0x to 3.9x | 7 (13.5%) | 11 (100.0%) |
| 4.0x or more | 25 (48.1%) | 0 (0.0%) |
| Total | 52 (100.0%) | 11 (100.0%) |
Real Estate Taxes by Mortgage Status in Smith Corner
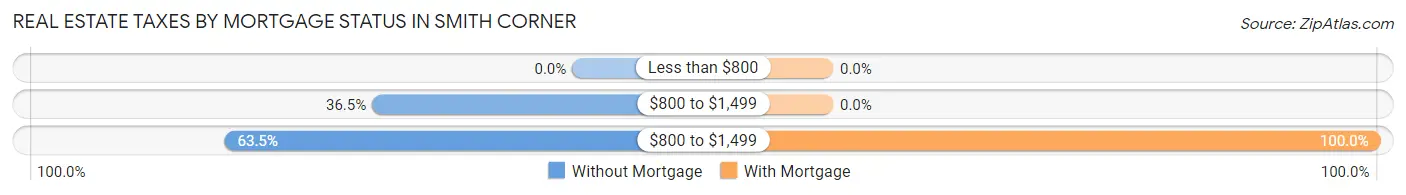
| Property Taxes | Without Mortgage | With Mortgage |
| Less than $800 | 0 (0.0%) | 0 (0.0%) |
| $800 to $1,499 | 19 (36.5%) | 0 (0.0%) |
| $800 to $1,499 | 33 (63.5%) | 11 (100.0%) |
| Total | 52 (100.0%) | 11 (100.0%) |
Health & Disability in Smith Corner
Health Insurance Coverage by Age in Smith Corner
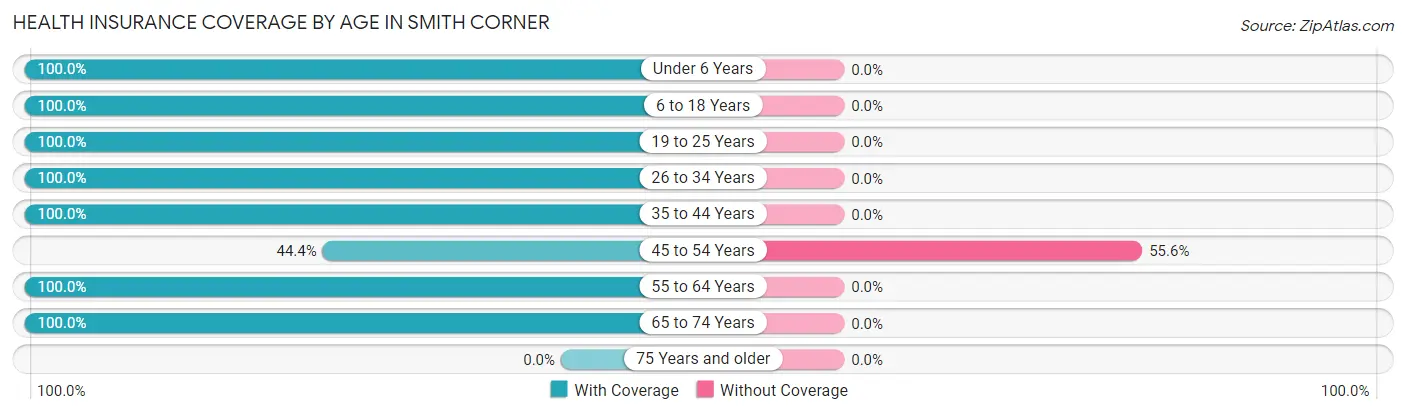
| Age Bracket | With Coverage | Without Coverage |
| Under 6 Years | 19 (100.0%) | 0 (0.0%) |
| 6 to 18 Years | 49 (100.0%) | 0 (0.0%) |
| 19 to 25 Years | 37 (100.0%) | 0 (0.0%) |
| 26 to 34 Years | 34 (100.0%) | 0 (0.0%) |
| 35 to 44 Years | 50 (100.0%) | 0 (0.0%) |
| 45 to 54 Years | 20 (44.4%) | 25 (55.6%) |
| 55 to 64 Years | 43 (100.0%) | 0 (0.0%) |
| 65 to 74 Years | 39 (100.0%) | 0 (0.0%) |
| 75 Years and older | 0 (0.0%) | 0 (0.0%) |
| Total | 291 (92.1%) | 25 (7.9%) |
Health Insurance Coverage by Citizenship Status in Smith Corner
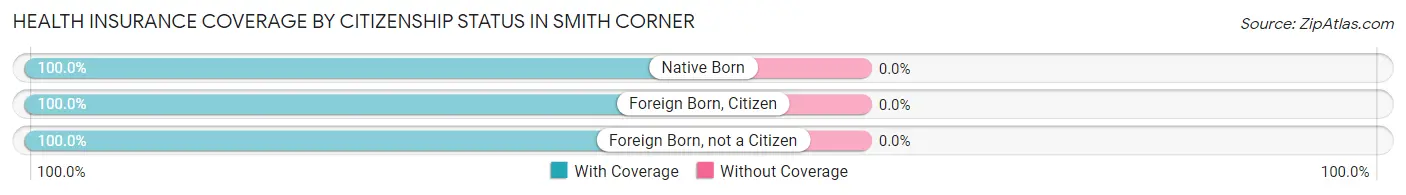
| Citizenship Status | With Coverage | Without Coverage |
| Native Born | 19 (100.0%) | 0 (0.0%) |
| Foreign Born, Citizen | 49 (100.0%) | 0 (0.0%) |
| Foreign Born, not a Citizen | 37 (100.0%) | 0 (0.0%) |
Health Insurance Coverage by Household Income in Smith Corner
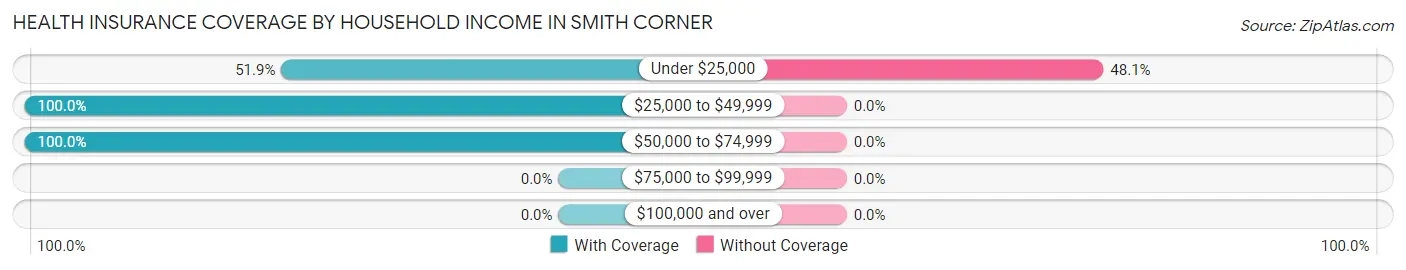
| Household Income | With Coverage | Without Coverage |
| Under $25,000 | 27 (51.9%) | 25 (48.1%) |
| $25,000 to $49,999 | 153 (100.0%) | 0 (0.0%) |
| $50,000 to $74,999 | 111 (100.0%) | 0 (0.0%) |
| $75,000 to $99,999 | 0 (0.0%) | 0 (0.0%) |
| $100,000 and over | 0 (0.0%) | 0 (0.0%) |
Public vs Private Health Insurance Coverage by Age in Smith Corner
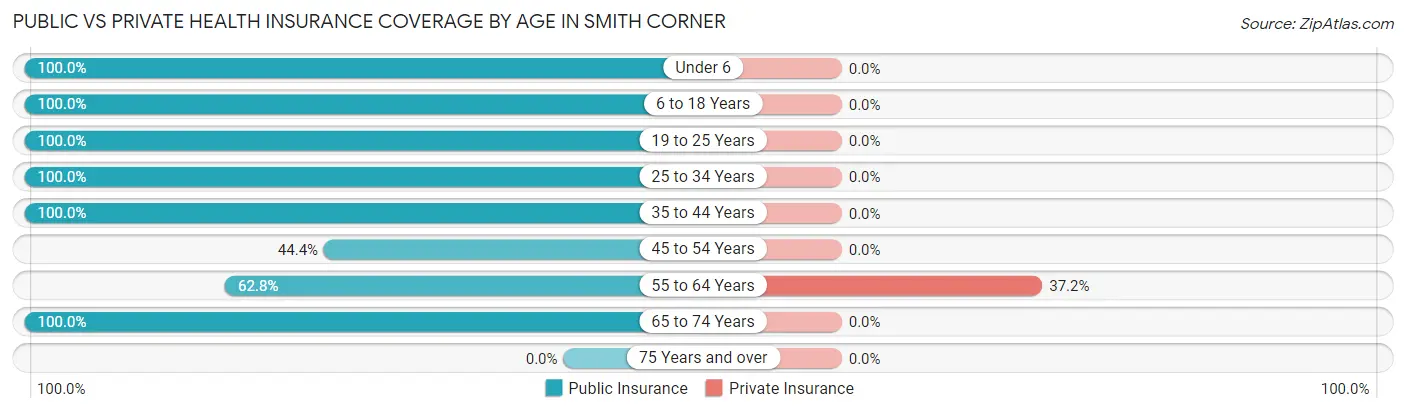
| Age Bracket | Public Insurance | Private Insurance |
| Under 6 | 19 (100.0%) | 0 (0.0%) |
| 6 to 18 Years | 49 (100.0%) | 0 (0.0%) |
| 19 to 25 Years | 37 (100.0%) | 0 (0.0%) |
| 25 to 34 Years | 34 (100.0%) | 0 (0.0%) |
| 35 to 44 Years | 50 (100.0%) | 0 (0.0%) |
| 45 to 54 Years | 20 (44.4%) | 0 (0.0%) |
| 55 to 64 Years | 27 (62.8%) | 16 (37.2%) |
| 65 to 74 Years | 39 (100.0%) | 0 (0.0%) |
| 75 Years and over | 0 (0.0%) | 0 (0.0%) |
| Total | 275 (87.0%) | 16 (5.1%) |
Disability Status by Sex by Age in Smith Corner
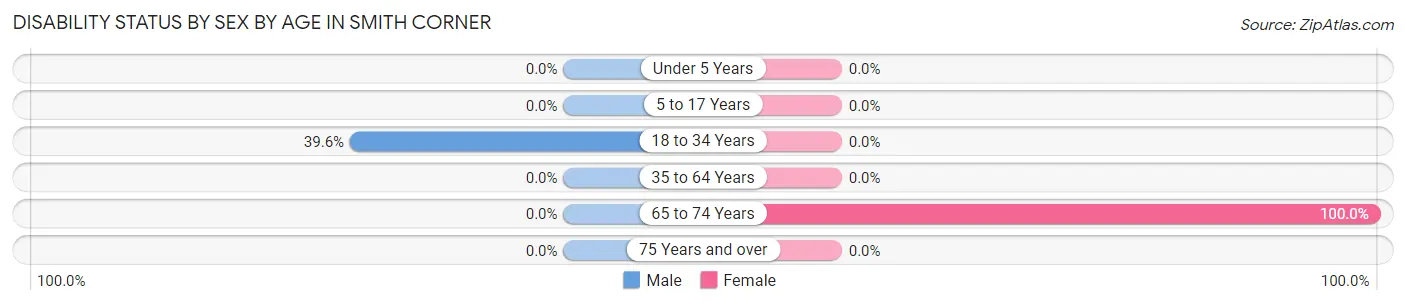
| Age Bracket | Male | Female |
| Under 5 Years | 0 (0.0%) | 0 (0.0%) |
| 5 to 17 Years | 0 (0.0%) | 0 (0.0%) |
| 18 to 34 Years | 21 (39.6%) | 0 (0.0%) |
| 35 to 64 Years | 0 (0.0%) | 0 (0.0%) |
| 65 to 74 Years | 0 (0.0%) | 19 (100.0%) |
| 75 Years and over | 0 (0.0%) | 0 (0.0%) |
Disability Class by Sex by Age in Smith Corner
Disability Class: Hearing Difficulty
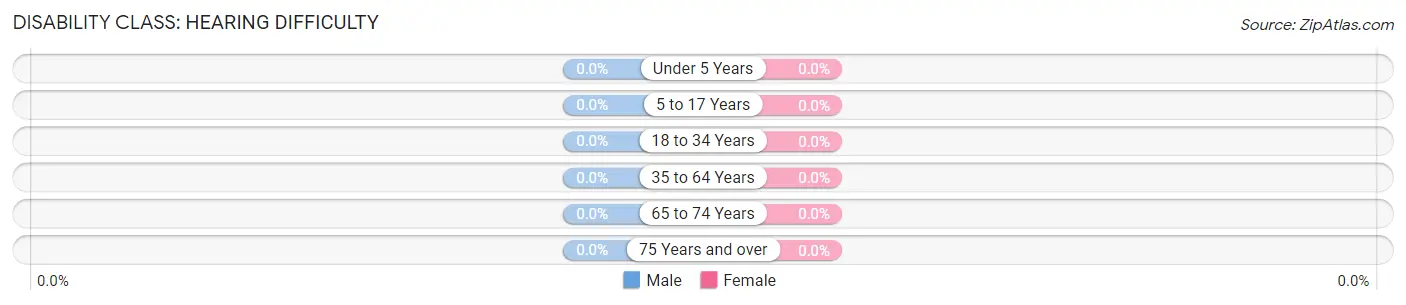
| Age Bracket | Male | Female |
| Under 5 Years | 0 (0.0%) | 0 (0.0%) |
| 5 to 17 Years | 0 (0.0%) | 0 (0.0%) |
| 18 to 34 Years | 0 (0.0%) | 0 (0.0%) |
| 35 to 64 Years | 0 (0.0%) | 0 (0.0%) |
| 65 to 74 Years | 0 (0.0%) | 0 (0.0%) |
| 75 Years and over | 0 (0.0%) | 0 (0.0%) |
Disability Class: Vision Difficulty
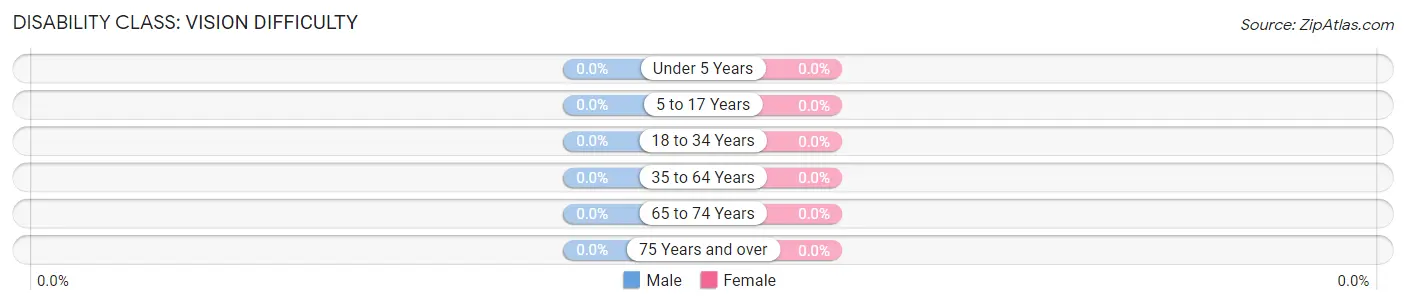
| Age Bracket | Male | Female |
| Under 5 Years | 0 (0.0%) | 0 (0.0%) |
| 5 to 17 Years | 0 (0.0%) | 0 (0.0%) |
| 18 to 34 Years | 0 (0.0%) | 0 (0.0%) |
| 35 to 64 Years | 0 (0.0%) | 0 (0.0%) |
| 65 to 74 Years | 0 (0.0%) | 0 (0.0%) |
| 75 Years and over | 0 (0.0%) | 0 (0.0%) |
Disability Class: Cognitive Difficulty
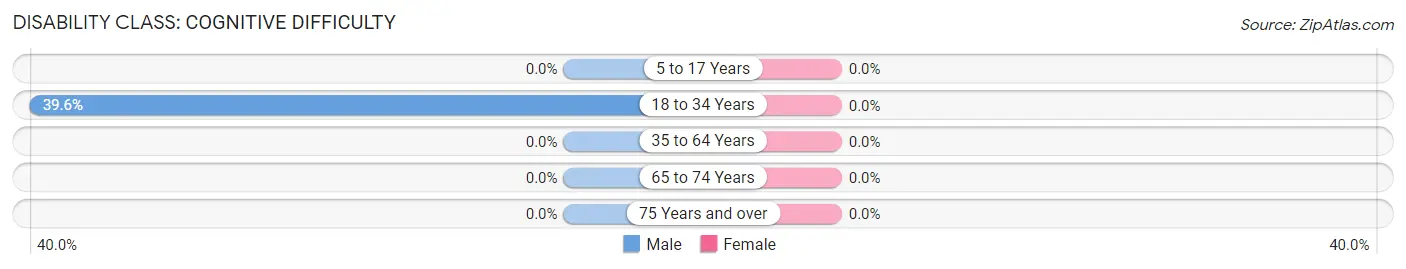
| Age Bracket | Male | Female |
| 5 to 17 Years | 0 (0.0%) | 0 (0.0%) |
| 18 to 34 Years | 21 (39.6%) | 0 (0.0%) |
| 35 to 64 Years | 0 (0.0%) | 0 (0.0%) |
| 65 to 74 Years | 0 (0.0%) | 0 (0.0%) |
| 75 Years and over | 0 (0.0%) | 0 (0.0%) |
Disability Class: Ambulatory Difficulty
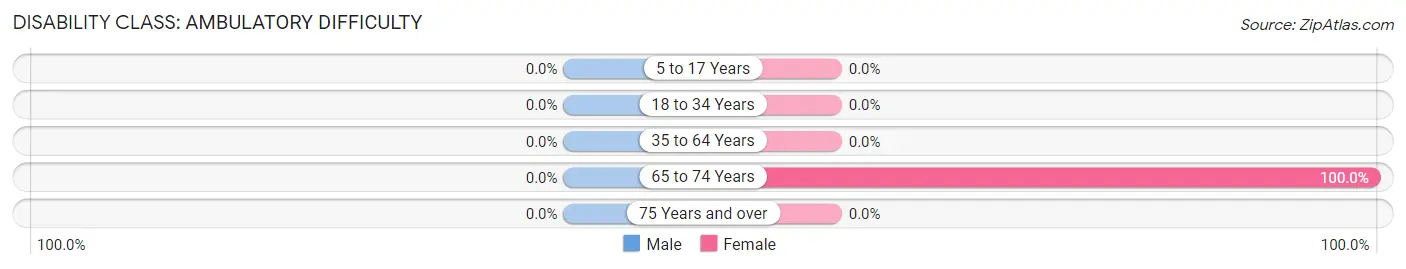
| Age Bracket | Male | Female |
| 5 to 17 Years | 0 (0.0%) | 0 (0.0%) |
| 18 to 34 Years | 0 (0.0%) | 0 (0.0%) |
| 35 to 64 Years | 0 (0.0%) | 0 (0.0%) |
| 65 to 74 Years | 0 (0.0%) | 19 (100.0%) |
| 75 Years and over | 0 (0.0%) | 0 (0.0%) |
Disability Class: Self-Care Difficulty

| Age Bracket | Male | Female |
| 5 to 17 Years | 0 (0.0%) | 0 (0.0%) |
| 18 to 34 Years | 0 (0.0%) | 0 (0.0%) |
| 35 to 64 Years | 0 (0.0%) | 0 (0.0%) |
| 65 to 74 Years | 0 (0.0%) | 19 (100.0%) |
| 75 Years and over | 0 (0.0%) | 0 (0.0%) |
Technology Access in Smith Corner
Computing Device Access in Smith Corner
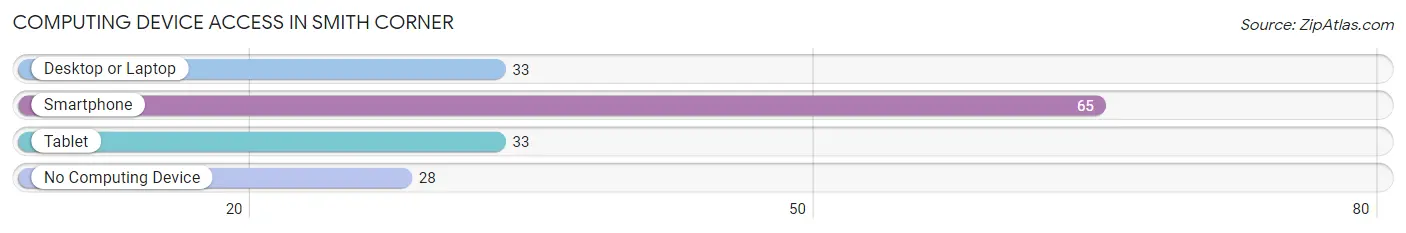
| Device Type | # Households | % Households |
| Desktop or Laptop | 33 | 35.5% |
| Smartphone | 65 | 69.9% |
| Tablet | 33 | 35.5% |
| No Computing Device | 28 | 30.1% |
| Total | 93 | 100.0% |
Internet Access in Smith Corner
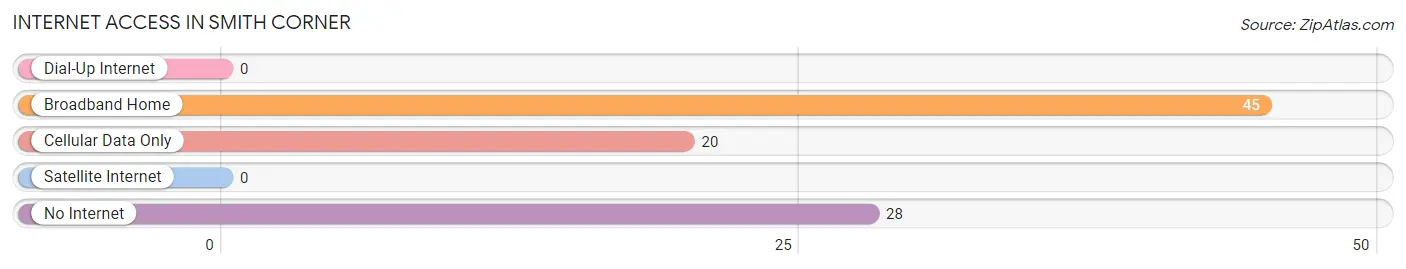
| Internet Type | # Households | % Households |
| Dial-Up Internet | 0 | 0.0% |
| Broadband Home | 45 | 48.4% |
| Cellular Data Only | 20 | 21.5% |
| Satellite Internet | 0 | 0.0% |
| No Internet | 28 | 30.1% |
| Total | 93 | 100.0% |
Smith Corner Summary
Corner, California is a small unincorporated community located in the foothills of the Sierra Nevada Mountains in El Dorado County. It is situated at an elevation of 2,845 feet (867 m) and is located approximately 25 miles (40 km) east of Placerville, California. The population of the community was estimated to be around 200 people in 2020.
History
The area that is now known as Smith Corner was originally inhabited by the Miwok Native American tribe. The first European settlers arrived in the area in the mid-1800s and established a small farming community. The community was named after the Smith family, who were among the first settlers.
The town of Smith Corner was officially established in 1876. It was initially a small farming community, but it soon grew to become a popular tourist destination. The town was known for its beautiful scenery and its proximity to the Sierra Nevada Mountains.
In the early 1900s, the town began to experience a decline in population as people moved away to larger cities. However, the town was able to remain a popular tourist destination due to its proximity to the mountains and its beautiful scenery.
Geography
Smith Corner is located in the foothills of the Sierra Nevada Mountains in El Dorado County. It is situated at an elevation of 2,845 feet (867 m) and is located approximately 25 miles (40 km) east of Placerville, California. The town is surrounded by the Eldorado National Forest and is located near the South Fork of the American River.
The climate in Smith Corner is generally mild, with temperatures ranging from the mid-30s in the winter to the mid-90s in the summer. The area receives an average of 20 inches (51 cm) of precipitation per year.
Economy
The economy of Smith Corner is largely based on tourism. The town is a popular destination for outdoor activities such as hiking, camping, fishing, and hunting. The town is also home to several small businesses, including restaurants, shops, and lodging.
Demographics
The population of Smith Corner was estimated to be around 200 people in 2020. The racial makeup of the town is predominantly white (90%), with the remaining 10% being made up of other races. The median household income in Smith Corner is $50,000, and the median age is 44 years.
Conclusion
Smith Corner is a small unincorporated community located in the foothills of the Sierra Nevada Mountains in El Dorado County. It is a popular tourist destination due to its proximity to the mountains and its beautiful scenery. The economy of the town is largely based on tourism, and the population is estimated to be around 200 people. The racial makeup of the town is predominantly white, and the median household income is $50,000.
Common Questions
What is Per Capita Income in Smith Corner?
Per Capita income in Smith Corner is $11,617.
What is the Median Family Income in Smith Corner?
Median Family Income in Smith Corner is $41,250.
What is the Median Household income in Smith Corner?
Median Household Income in Smith Corner is $41,250.
What is Inequality or Gini Index in Smith Corner?
Inequality or Gini Index in Smith Corner is 0.22.
What is the Total Population of Smith Corner?
Total Population of Smith Corner is 316.
What is the Total Male Population of Smith Corner?
Total Male Population of Smith Corner is 148.
What is the Total Female Population of Smith Corner?
Total Female Population of Smith Corner is 168.
What is the Ratio of Males per 100 Females in Smith Corner?
There are 88.10 Males per 100 Females in Smith Corner.
What is the Ratio of Females per 100 Males in Smith Corner?
There are 113.51 Females per 100 Males in Smith Corner.
What is the Median Population Age in Smith Corner?
Median Population Age in Smith Corner is 35.7 Years.
What is the Average Family Size in Smith Corner
Average Family Size in Smith Corner is 3.4 People.
What is the Average Household Size in Smith Corner
Average Household Size in Smith Corner is 3.4 People.
How Large is the Labor Force in Smith Corner?
There are 138 People in the Labor Forcein in Smith Corner.
What is the Percentage of People in the Labor Force in Smith Corner?
50.9% of People are in the Labor Force in Smith Corner.
What is the Unemployment Rate in Smith Corner?
Unemployment Rate in Smith Corner is 13.8%.