Cities with the Highest Percentage of Population Employed in Material Moving in South Dakota
RELATED REPORTS & OPTIONS
Material Moving
South Dakota
Compare Cities
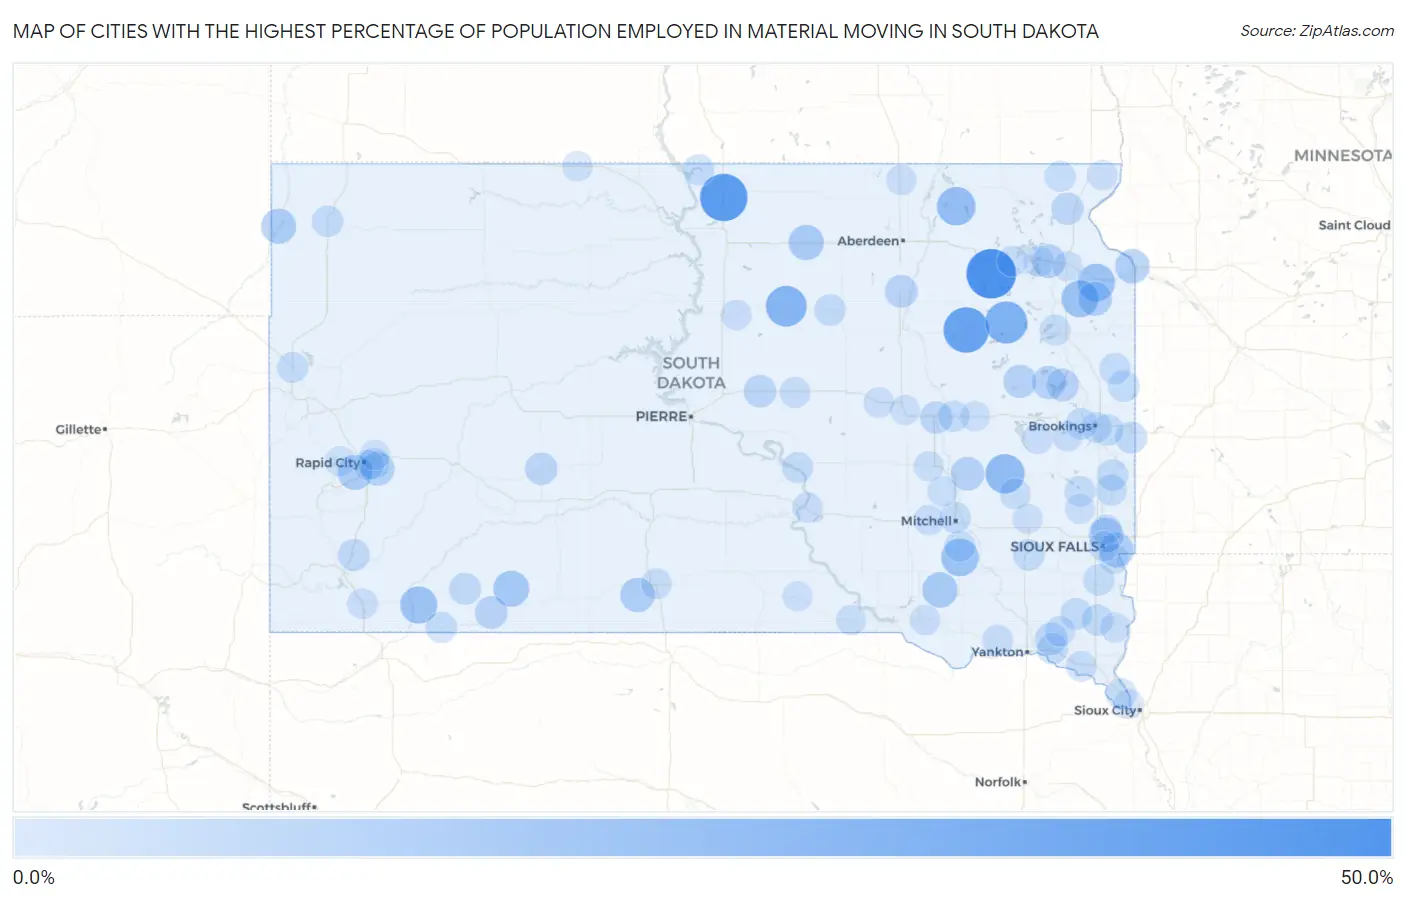
Map of Cities with the Highest Percentage of Population Employed in Material Moving in South Dakota
0.0%
50.0%
Cities with the Highest Percentage of Population Employed in Material Moving in South Dakota
| City | % Employed | vs State | vs National | |
| 1. | Butler | 50.0% | 3.6%(+46.4)#1 | 3.8%(+46.2)#110 |
| 2. | Mound City | 44.7% | 3.6%(+41.1)#2 | 3.8%(+40.9)#126 |
| 3. | Raymond | 40.0% | 3.6%(+36.4)#3 | 3.8%(+36.2)#168 |
| 4. | Garden City | 31.8% | 3.6%(+28.2)#4 | 3.8%(+28.0)#270 |
| 5. | Seneca | 28.6% | 3.6%(+24.9)#5 | 3.8%(+24.7)#338 |
| 6. | Vilas | 25.0% | 3.6%(+21.4)#6 | 3.8%(+21.2)#455 |
| 7. | Claremont | 23.5% | 3.6%(+19.9)#7 | 3.8%(+19.7)#506 |
| 8. | West Brule | 21.1% | 3.6%(+17.4)#8 | 3.8%(+17.2)#654 |
| 9. | Dimock | 21.1% | 3.6%(+17.4)#9 | 3.8%(+17.2)#655 |
| 10. | Twin Brooks | 21.1% | 3.6%(+17.4)#10 | 3.8%(+17.2)#657 |
| 11. | Oglala | 20.0% | 3.6%(+16.4)#11 | 3.8%(+16.2)#719 |
| 12. | South Shore | 20.0% | 3.6%(+16.4)#12 | 3.8%(+16.2)#722 |
| 13. | Allen | 17.1% | 3.6%(+13.4)#13 | 3.8%(+13.3)#1,028 |
| 14. | Delmont | 15.9% | 3.6%(+12.3)#14 | 3.8%(+12.1)#1,208 |
| 15. | Roscoe | 15.5% | 3.6%(+11.9)#15 | 3.8%(+11.7)#1,273 |
| 16. | Colonial Pine Hills | 15.1% | 3.6%(+11.4)#16 | 3.8%(+11.2)#1,364 |
| 17. | Camp Crook | 15.0% | 3.6%(+11.4)#17 | 3.8%(+11.2)#1,383 |
| 18. | Anderson | 14.6% | 3.6%(+11.0)#18 | 3.8%(+10.8)#1,462 |
| 19. | Meadow View Addition | 14.2% | 3.6%(+10.6)#19 | 3.8%(+10.4)#1,561 |
| 20. | Rosebud | 13.9% | 3.6%(+10.2)#20 | 3.8%(+10.0)#1,652 |
| 21. | Big Stone City | 13.8% | 3.6%(+10.1)#21 | 3.8%(+9.92)#1,682 |
| 22. | Stockholm | 12.9% | 3.6%(+9.21)#22 | 3.8%(+9.03)#1,979 |
| 23. | Green Valley | 12.6% | 3.6%(+8.97)#23 | 3.8%(+8.79)#2,054 |
| 24. | Ortley | 11.8% | 3.6%(+8.12)#24 | 3.8%(+7.93)#2,400 |
| 25. | Artesian | 11.5% | 3.6%(+7.89)#25 | 3.8%(+7.71)#2,480 |
| 26. | Lake Norden | 11.1% | 3.6%(+7.50)#26 | 3.8%(+7.31)#2,658 |
| 27. | Bryant | 10.9% | 3.6%(+7.20)#27 | 3.8%(+7.02)#2,800 |
| 28. | Lake Poinsett | 10.2% | 3.6%(+6.58)#28 | 3.8%(+6.40)#3,141 |
| 29. | Mellette | 10.1% | 3.6%(+6.48)#29 | 3.8%(+6.30)#3,207 |
| 30. | Batesland | 10.0% | 3.6%(+6.35)#30 | 3.8%(+6.17)#3,311 |
| 31. | Harrold | 9.4% | 3.6%(+5.78)#31 | 3.8%(+5.60)#3,729 |
| 32. | Philip | 9.2% | 3.6%(+5.52)#32 | 3.8%(+5.34)#3,930 |
| 33. | Huron | 9.1% | 3.6%(+5.44)#33 | 3.8%(+5.26)#3,986 |
| 34. | Volin | 8.9% | 3.6%(+5.26)#34 | 3.8%(+5.08)#4,140 |
| 35. | Sisseton | 8.7% | 3.6%(+5.02)#35 | 3.8%(+4.84)#4,343 |
| 36. | Porcupine | 8.1% | 3.6%(+4.46)#36 | 3.8%(+4.28)#4,920 |
| 37. | Elkton | 7.9% | 3.6%(+4.30)#37 | 3.8%(+4.12)#5,097 |
| 38. | Buffalo Gap | 7.8% | 3.6%(+4.19)#38 | 3.8%(+4.01)#5,245 |
| 39. | Aurora | 7.5% | 3.6%(+3.80)#39 | 3.8%(+3.62)#5,736 |
| 40. | Centerville | 7.3% | 3.6%(+3.60)#40 | 3.8%(+3.42)#6,018 |
| 41. | Faulkton | 7.1% | 3.6%(+3.47)#41 | 3.8%(+3.29)#6,205 |
| 42. | Rapid Valley | 7.0% | 3.6%(+3.30)#42 | 3.8%(+3.12)#6,456 |
| 43. | Egan | 6.9% | 3.6%(+3.28)#43 | 3.8%(+3.10)#6,491 |
| 44. | Buffalo | 6.9% | 3.6%(+3.21)#44 | 3.8%(+3.03)#6,597 |
| 45. | Volga | 6.7% | 3.6%(+3.08)#45 | 3.8%(+2.90)#6,805 |
| 46. | Beresford | 6.7% | 3.6%(+3.08)#46 | 3.8%(+2.90)#6,817 |
| 47. | Ethan | 6.7% | 3.6%(+3.06)#47 | 3.8%(+2.88)#6,855 |
| 48. | Mitchell | 6.7% | 3.6%(+3.03)#48 | 3.8%(+2.85)#6,878 |
| 49. | Worthing | 6.7% | 3.6%(+3.03)#49 | 3.8%(+2.85)#6,882 |
| 50. | Astoria | 6.7% | 3.6%(+3.02)#50 | 3.8%(+2.84)#6,923 |
| 51. | Brandt | 6.7% | 3.6%(+3.02)#51 | 3.8%(+2.84)#6,926 |
| 52. | Dolton | 6.7% | 3.6%(+3.02)#52 | 3.8%(+2.84)#6,936 |
| 53. | Trent | 6.6% | 3.6%(+2.98)#53 | 3.8%(+2.80)#6,991 |
| 54. | Cavour | 6.5% | 3.6%(+2.83)#54 | 3.8%(+2.65)#7,209 |
| 55. | Pine Ridge | 6.5% | 3.6%(+2.81)#55 | 3.8%(+2.63)#7,236 |
| 56. | Pollock | 6.3% | 3.6%(+2.69)#56 | 3.8%(+2.51)#7,452 |
| 57. | Fort Thompson | 6.2% | 3.6%(+2.58)#57 | 3.8%(+2.40)#7,619 |
| 58. | Gayville | 6.2% | 3.6%(+2.58)#58 | 3.8%(+2.40)#7,626 |
| 59. | Belle Fourche | 6.0% | 3.6%(+2.35)#59 | 3.8%(+2.17)#8,046 |
| 60. | Claire City | 5.9% | 3.6%(+2.23)#60 | 3.8%(+2.05)#8,289 |
| 61. | Watertown | 5.8% | 3.6%(+2.13)#61 | 3.8%(+1.95)#8,469 |
| 62. | Waubay | 5.6% | 3.6%(+1.95)#62 | 3.8%(+1.76)#8,865 |
| 63. | Chester | 5.6% | 3.6%(+1.91)#63 | 3.8%(+1.73)#8,947 |
| 64. | Webster | 5.5% | 3.6%(+1.87)#64 | 3.8%(+1.69)#9,025 |
| 65. | Highmore | 5.5% | 3.6%(+1.86)#65 | 3.8%(+1.68)#9,035 |
| 66. | Mission | 5.4% | 3.6%(+1.75)#66 | 3.8%(+1.57)#9,252 |
| 67. | Brookings | 5.4% | 3.6%(+1.73)#67 | 3.8%(+1.55)#9,293 |
| 68. | Canova | 5.4% | 3.6%(+1.71)#68 | 3.8%(+1.53)#9,354 |
| 69. | Renner Corner | 5.3% | 3.6%(+1.69)#69 | 3.8%(+1.51)#9,394 |
| 70. | Tabor | 5.3% | 3.6%(+1.61)#70 | 3.8%(+1.43)#9,556 |
| 71. | Vermillion | 5.2% | 3.6%(+1.58)#71 | 3.8%(+1.40)#9,657 |
| 72. | Jefferson | 5.2% | 3.6%(+1.58)#72 | 3.8%(+1.40)#9,658 |
| 73. | Mount Vernon | 5.1% | 3.6%(+1.49)#73 | 3.8%(+1.31)#9,857 |
| 74. | Oldham | 5.1% | 3.6%(+1.44)#74 | 3.8%(+1.25)#9,970 |
| 75. | Gettysburg | 5.0% | 3.6%(+1.35)#75 | 3.8%(+1.17)#10,133 |
| 76. | Oelrichs | 4.9% | 3.6%(+1.25)#76 | 3.8%(+1.07)#10,380 |
| 77. | Wakonda | 4.9% | 3.6%(+1.23)#77 | 3.8%(+1.05)#10,446 |
| 78. | Sinai | 4.8% | 3.6%(+1.17)#78 | 3.8%(+0.989)#10,590 |
| 79. | Frederick | 4.7% | 3.6%(+1.07)#79 | 3.8%(+0.887)#10,886 |
| 80. | Letcher | 4.7% | 3.6%(+1.00)#80 | 3.8%(+0.821)#11,070 |
| 81. | Wessington | 4.6% | 3.6%(+0.938)#81 | 3.8%(+0.757)#11,242 |
| 82. | Chamberlain | 4.6% | 3.6%(+0.917)#82 | 3.8%(+0.736)#11,277 |
| 83. | Woonsocket | 4.5% | 3.6%(+0.882)#83 | 3.8%(+0.701)#11,382 |
| 84. | Bonesteel | 4.5% | 3.6%(+0.845)#84 | 3.8%(+0.664)#11,480 |
| 85. | Wagner | 4.5% | 3.6%(+0.838)#85 | 3.8%(+0.657)#11,504 |
| 86. | North Sioux City | 4.4% | 3.6%(+0.768)#86 | 3.8%(+0.587)#11,683 |
| 87. | Ashland Heights | 4.4% | 3.6%(+0.741)#87 | 3.8%(+0.560)#11,745 |
| 88. | Johnson Siding | 4.4% | 3.6%(+0.726)#88 | 3.8%(+0.545)#11,783 |
| 89. | Mcintosh | 4.3% | 3.6%(+0.698)#89 | 3.8%(+0.518)#11,877 |
| 90. | Summit | 4.3% | 3.6%(+0.672)#90 | 3.8%(+0.491)#11,950 |
| 91. | Wolsey | 4.3% | 3.6%(+0.649)#91 | 3.8%(+0.468)#12,026 |
| 92. | Shindler | 4.3% | 3.6%(+0.606)#92 | 3.8%(+0.425)#12,142 |
| 93. | Iroquois | 4.2% | 3.6%(+0.596)#93 | 3.8%(+0.415)#12,171 |
| 94. | Rosholt | 4.2% | 3.6%(+0.568)#94 | 3.8%(+0.387)#12,255 |
| 95. | Alcester | 4.2% | 3.6%(+0.561)#95 | 3.8%(+0.380)#12,274 |
| 96. | Rapid City | 4.2% | 3.6%(+0.560)#96 | 3.8%(+0.379)#12,281 |
| 97. | Colton | 4.2% | 3.6%(+0.538)#97 | 3.8%(+0.357)#12,348 |
| 98. | Gregory | 4.2% | 3.6%(+0.517)#98 | 3.8%(+0.336)#12,393 |
| 99. | Salem | 4.0% | 3.6%(+0.400)#99 | 3.8%(+0.219)#12,744 |
| 100. | Sioux Falls | 4.0% | 3.6%(+0.390)#100 | 3.8%(+0.209)#12,774 |
Common Questions
What are the Top 10 Cities with the Highest Percentage of Population Employed in Material Moving in South Dakota?
Top 10 Cities with the Highest Percentage of Population Employed in Material Moving in South Dakota are:
#1
50.0%
#2
44.7%
#3
40.0%
#4
31.8%
#5
28.6%
#6
25.0%
#7
23.5%
#8
21.1%
#9
21.1%
#10
20.0%
What city has the Highest Percentage of Population Employed in Material Moving in South Dakota?
Butler has the Highest Percentage of Population Employed in Material Moving in South Dakota with 50.0%.
What is the Percentage of Population Employed in Material Moving in the State of South Dakota?
Percentage of Population Employed in Material Moving in South Dakota is 3.6%.
What is the Percentage of Population Employed in Material Moving in the United States?
Percentage of Population Employed in Material Moving in the United States is 3.8%.