Cities with the Highest Percentage of Population Employed in Material Moving in Georgia
RELATED REPORTS & OPTIONS
Material Moving
Georgia
Compare Cities
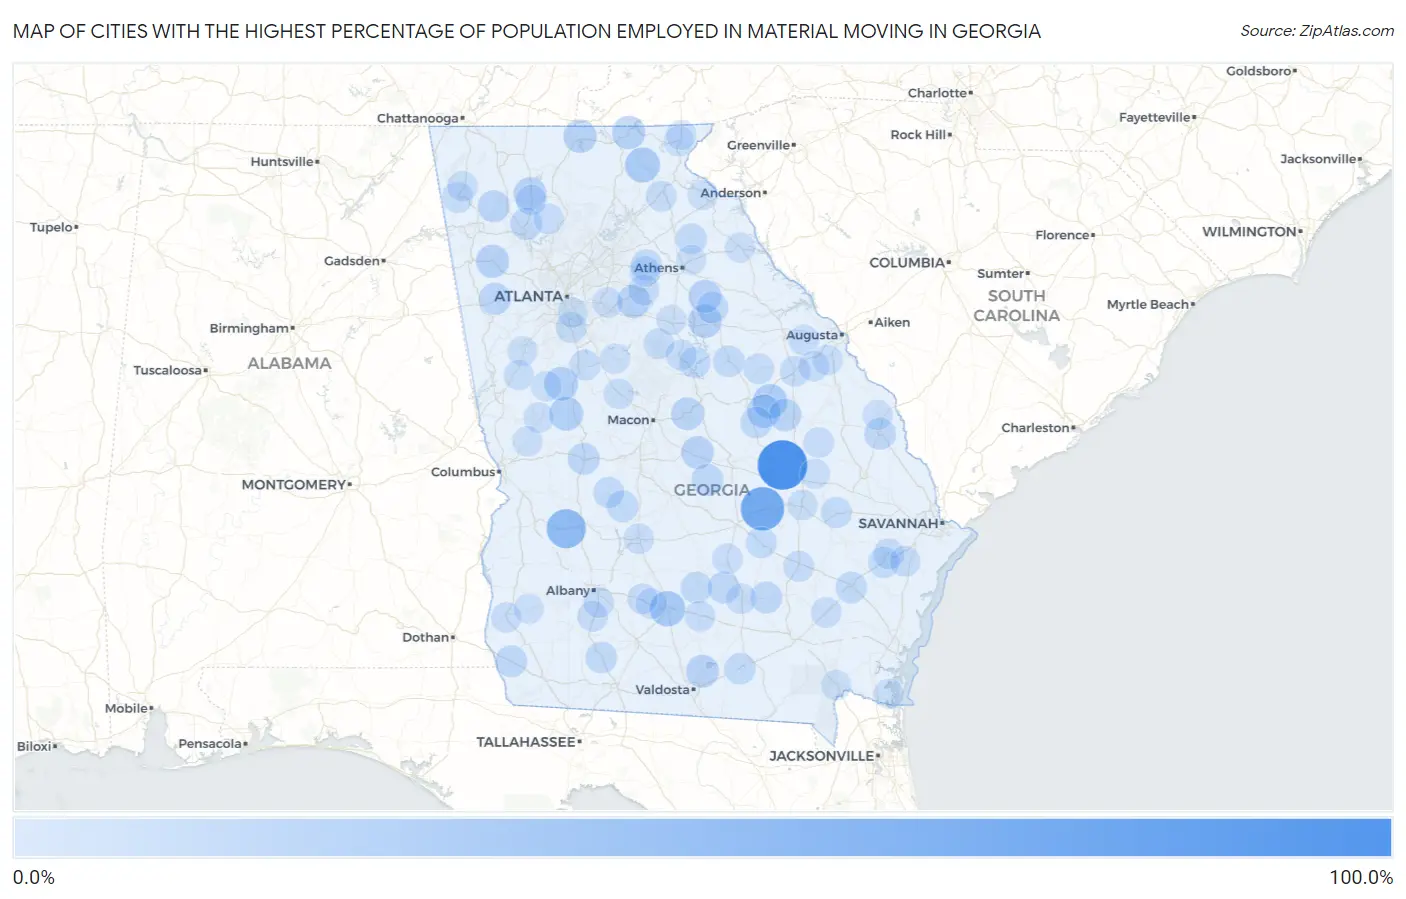
Map of Cities with the Highest Percentage of Population Employed in Material Moving in Georgia
0.0%
100.0%
Cities with the Highest Percentage of Population Employed in Material Moving in Georgia
| City | % Employed | vs State | vs National | |
| 1. | Norristown | 100.0% | 4.5%(+95.5)#1 | 3.8%(+96.2)#26 |
| 2. | Glenwood | 70.9% | 4.5%(+66.4)#2 | 3.8%(+67.1)#46 |
| 3. | Plains | 51.1% | 4.5%(+46.6)#3 | 3.8%(+47.2)#96 |
| 4. | Unionville | 33.2% | 4.5%(+28.7)#4 | 3.8%(+29.4)#252 |
| 5. | Helen | 31.9% | 4.5%(+27.4)#5 | 3.8%(+28.0)#269 |
| 6. | Davisboro | 29.3% | 4.5%(+24.8)#6 | 3.8%(+25.5)#325 |
| 7. | Sunset Village | 26.6% | 4.5%(+22.1)#7 | 3.8%(+22.8)#389 |
| 8. | Hilltop | 26.5% | 4.5%(+22.0)#8 | 3.8%(+22.7)#393 |
| 9. | Mineral Bluff | 24.3% | 4.5%(+19.8)#9 | 3.8%(+20.5)#472 |
| 10. | Riddleville | 24.2% | 4.5%(+19.8)#10 | 3.8%(+20.4)#478 |
| 11. | Greensboro | 23.9% | 4.5%(+19.4)#11 | 3.8%(+20.1)#496 |
| 12. | Young Harris | 23.8% | 4.5%(+19.3)#12 | 3.8%(+20.0)#499 |
| 13. | Rockmart | 23.5% | 4.5%(+19.0)#13 | 3.8%(+19.7)#509 |
| 14. | Jersey | 23.3% | 4.5%(+18.8)#14 | 3.8%(+19.5)#521 |
| 15. | Ranger | 22.9% | 4.5%(+18.4)#15 | 3.8%(+19.0)#547 |
| 16. | Maxeys | 22.4% | 4.5%(+17.9)#16 | 3.8%(+18.6)#573 |
| 17. | Moody Afb | 22.0% | 4.5%(+17.5)#17 | 3.8%(+18.1)#593 |
| 18. | Danville | 21.7% | 4.5%(+17.2)#18 | 3.8%(+17.9)#610 |
| 19. | Gordon | 20.8% | 4.5%(+16.3)#19 | 3.8%(+17.0)#669 |
| 20. | Bartow | 20.6% | 4.5%(+16.1)#20 | 3.8%(+16.8)#685 |
| 21. | Temple | 18.9% | 4.5%(+14.4)#21 | 3.8%(+15.1)#812 |
| 22. | Plainville | 18.6% | 4.5%(+14.1)#22 | 3.8%(+14.8)#839 |
| 23. | Chester | 18.4% | 4.5%(+13.9)#23 | 3.8%(+14.6)#859 |
| 24. | Butler | 18.4% | 4.5%(+13.9)#24 | 3.8%(+14.6)#864 |
| 25. | White | 18.4% | 4.5%(+13.9)#25 | 3.8%(+14.5)#869 |
| 26. | Nicholls | 18.1% | 4.5%(+13.6)#26 | 3.8%(+14.3)#899 |
| 27. | Ambrose | 18.1% | 4.5%(+13.6)#27 | 3.8%(+14.3)#906 |
| 28. | Donalsonville | 17.6% | 4.5%(+13.1)#28 | 3.8%(+13.8)#958 |
| 29. | Sylvania | 17.4% | 4.5%(+12.9)#29 | 3.8%(+13.6)#985 |
| 30. | Jesup | 17.1% | 4.5%(+12.6)#30 | 3.8%(+13.3)#1,029 |
| 31. | Byromville | 17.0% | 4.5%(+12.5)#31 | 3.8%(+13.2)#1,036 |
| 32. | Sparta | 17.0% | 4.5%(+12.5)#32 | 3.8%(+13.1)#1,042 |
| 33. | Harrison | 17.0% | 4.5%(+12.5)#33 | 3.8%(+13.1)#1,043 |
| 34. | Ocilla | 16.9% | 4.5%(+12.4)#34 | 3.8%(+13.1)#1,052 |
| 35. | Woodville | 16.7% | 4.5%(+12.2)#35 | 3.8%(+12.8)#1,075 |
| 36. | Meigs | 16.0% | 4.5%(+11.5)#36 | 3.8%(+12.2)#1,187 |
| 37. | Du Pont | 15.8% | 4.5%(+11.3)#37 | 3.8%(+12.0)#1,227 |
| 38. | New England | 15.6% | 4.5%(+11.1)#38 | 3.8%(+11.8)#1,252 |
| 39. | Russell | 15.5% | 4.5%(+11.1)#39 | 3.8%(+11.7)#1,270 |
| 40. | Allenhurst | 15.4% | 4.5%(+10.9)#40 | 3.8%(+11.5)#1,315 |
| 41. | Crooked Creek | 15.0% | 4.5%(+10.5)#41 | 3.8%(+11.2)#1,376 |
| 42. | Ila | 14.8% | 4.5%(+10.3)#42 | 3.8%(+11.0)#1,415 |
| 43. | Lumber City | 14.8% | 4.5%(+10.3)#43 | 3.8%(+11.0)#1,420 |
| 44. | Manassas | 14.6% | 4.5%(+10.1)#44 | 3.8%(+10.8)#1,477 |
| 45. | Montezuma | 14.5% | 4.5%(+10.0)#45 | 3.8%(+10.7)#1,483 |
| 46. | Piney Grove | 14.3% | 4.5%(+9.79)#46 | 3.8%(+10.5)#1,531 |
| 47. | Flemington | 13.9% | 4.5%(+9.45)#47 | 3.8%(+10.1)#1,630 |
| 48. | Midway | 13.8% | 4.5%(+9.35)#48 | 3.8%(+10.0)#1,656 |
| 49. | East Griffin | 13.8% | 4.5%(+9.34)#49 | 3.8%(+10.0)#1,658 |
| 50. | Bristol | 13.8% | 4.5%(+9.30)#50 | 3.8%(+9.96)#1,669 |
| 51. | Baxley | 13.7% | 4.5%(+9.25)#51 | 3.8%(+9.91)#1,686 |
| 52. | Monroe | 13.7% | 4.5%(+9.24)#52 | 3.8%(+9.90)#1,689 |
| 53. | Summerville | 13.6% | 4.5%(+9.13)#53 | 3.8%(+9.80)#1,727 |
| 54. | Jonesboro | 13.6% | 4.5%(+9.11)#54 | 3.8%(+9.78)#1,733 |
| 55. | Eatonton | 13.4% | 4.5%(+8.89)#55 | 3.8%(+9.55)#1,793 |
| 56. | Alapaha | 13.2% | 4.5%(+8.73)#56 | 3.8%(+9.39)#1,843 |
| 57. | Baldwin | 13.2% | 4.5%(+8.70)#57 | 3.8%(+9.36)#1,859 |
| 58. | Baconton | 12.8% | 4.5%(+8.32)#58 | 3.8%(+8.98)#1,997 |
| 59. | Bethlehem | 12.8% | 4.5%(+8.30)#59 | 3.8%(+8.96)#2,001 |
| 60. | Shady Dale | 12.8% | 4.5%(+8.29)#60 | 3.8%(+8.95)#2,004 |
| 61. | Georgetown Quitman County Unified Government | 12.8% | 4.5%(+8.27)#61 | 3.8%(+8.93)#2,012 |
| 62. | Wrens | 12.7% | 4.5%(+8.21)#62 | 3.8%(+8.87)#2,025 |
| 63. | Fairmount | 12.7% | 4.5%(+8.18)#63 | 3.8%(+8.85)#2,035 |
| 64. | Mitchell | 12.7% | 4.5%(+8.18)#64 | 3.8%(+8.85)#2,037 |
| 65. | Ty Ty | 12.3% | 4.5%(+7.79)#65 | 3.8%(+8.45)#2,188 |
| 66. | Harlem | 12.3% | 4.5%(+7.78)#66 | 3.8%(+8.44)#2,195 |
| 67. | Canoochee | 12.2% | 4.5%(+7.75)#67 | 3.8%(+8.41)#2,204 |
| 68. | Putney | 12.2% | 4.5%(+7.71)#68 | 3.8%(+8.37)#2,218 |
| 69. | Manchester | 12.2% | 4.5%(+7.69)#69 | 3.8%(+8.35)#2,228 |
| 70. | Offerman | 12.1% | 4.5%(+7.65)#70 | 3.8%(+8.31)#2,239 |
| 71. | Cordele | 12.1% | 4.5%(+7.62)#71 | 3.8%(+8.29)#2,253 |
| 72. | Douglas | 12.0% | 4.5%(+7.55)#72 | 3.8%(+8.21)#2,274 |
| 73. | Jacksonville | 12.0% | 4.5%(+7.51)#73 | 3.8%(+8.17)#2,293 |
| 74. | Keysville | 11.9% | 4.5%(+7.44)#74 | 3.8%(+8.10)#2,317 |
| 75. | Waleska | 11.9% | 4.5%(+7.37)#75 | 3.8%(+8.03)#2,346 |
| 76. | Lyons | 11.7% | 4.5%(+7.25)#76 | 3.8%(+7.91)#2,407 |
| 77. | Blakely | 11.7% | 4.5%(+7.17)#77 | 3.8%(+7.83)#2,435 |
| 78. | Lakeview Estates | 11.6% | 4.5%(+7.12)#78 | 3.8%(+7.78)#2,454 |
| 79. | Sumner | 11.6% | 4.5%(+7.09)#79 | 3.8%(+7.76)#2,465 |
| 80. | Forsyth | 11.5% | 4.5%(+7.04)#80 | 3.8%(+7.70)#2,490 |
| 81. | Hephzibah | 11.5% | 4.5%(+7.01)#81 | 3.8%(+7.67)#2,499 |
| 82. | Lone Oak | 11.4% | 4.5%(+6.94)#82 | 3.8%(+7.60)#2,527 |
| 83. | Trion | 11.2% | 4.5%(+6.67)#83 | 3.8%(+7.33)#2,652 |
| 84. | Waverly Hall | 11.1% | 4.5%(+6.62)#84 | 3.8%(+7.28)#2,667 |
| 85. | Gay | 11.1% | 4.5%(+6.62)#85 | 3.8%(+7.28)#2,685 |
| 86. | Clayton | 11.0% | 4.5%(+6.50)#86 | 3.8%(+7.16)#2,733 |
| 87. | Jackson | 11.0% | 4.5%(+6.48)#87 | 3.8%(+7.14)#2,744 |
| 88. | Hull | 10.9% | 4.5%(+6.45)#88 | 3.8%(+7.11)#2,764 |
| 89. | Conley | 10.9% | 4.5%(+6.43)#89 | 3.8%(+7.09)#2,771 |
| 90. | Elberton | 10.8% | 4.5%(+6.34)#90 | 3.8%(+7.00)#2,812 |
| 91. | Arlington | 10.8% | 4.5%(+6.30)#91 | 3.8%(+6.96)#2,829 |
| 92. | Faceville | 10.8% | 4.5%(+6.28)#92 | 3.8%(+6.94)#2,835 |
| 93. | Mountain City | 10.7% | 4.5%(+6.18)#93 | 3.8%(+6.84)#2,889 |
| 94. | Kings Bay Base | 10.7% | 4.5%(+6.16)#94 | 3.8%(+6.82)#2,903 |
| 95. | Martin | 10.6% | 4.5%(+6.15)#95 | 3.8%(+6.81)#2,911 |
| 96. | Madison | 10.6% | 4.5%(+6.08)#96 | 3.8%(+6.75)#2,939 |
| 97. | East Newnan | 10.6% | 4.5%(+6.07)#97 | 3.8%(+6.73)#2,949 |
| 98. | Stillmore | 10.4% | 4.5%(+5.94)#98 | 3.8%(+6.60)#3,023 |
| 99. | Homeland | 10.4% | 4.5%(+5.91)#99 | 3.8%(+6.57)#3,047 |
| 100. | Hiltonia | 10.4% | 4.5%(+5.89)#100 | 3.8%(+6.55)#3,056 |
Common Questions
What are the Top 10 Cities with the Highest Percentage of Population Employed in Material Moving in Georgia?
Top 10 Cities with the Highest Percentage of Population Employed in Material Moving in Georgia are:
#1
100.0%
#2
70.9%
#3
51.1%
#4
33.2%
#5
31.9%
#6
29.3%
#7
26.6%
#8
26.5%
#9
24.3%
#10
24.2%
What city has the Highest Percentage of Population Employed in Material Moving in Georgia?
Norristown has the Highest Percentage of Population Employed in Material Moving in Georgia with 100.0%.
What is the Percentage of Population Employed in Material Moving in the State of Georgia?
Percentage of Population Employed in Material Moving in Georgia is 4.5%.
What is the Percentage of Population Employed in Material Moving in the United States?
Percentage of Population Employed in Material Moving in the United States is 3.8%.