Cities with the Highest Percentage of Population Employed in Material Moving in Indiana
RELATED REPORTS & OPTIONS
Material Moving
Indiana
Compare Cities
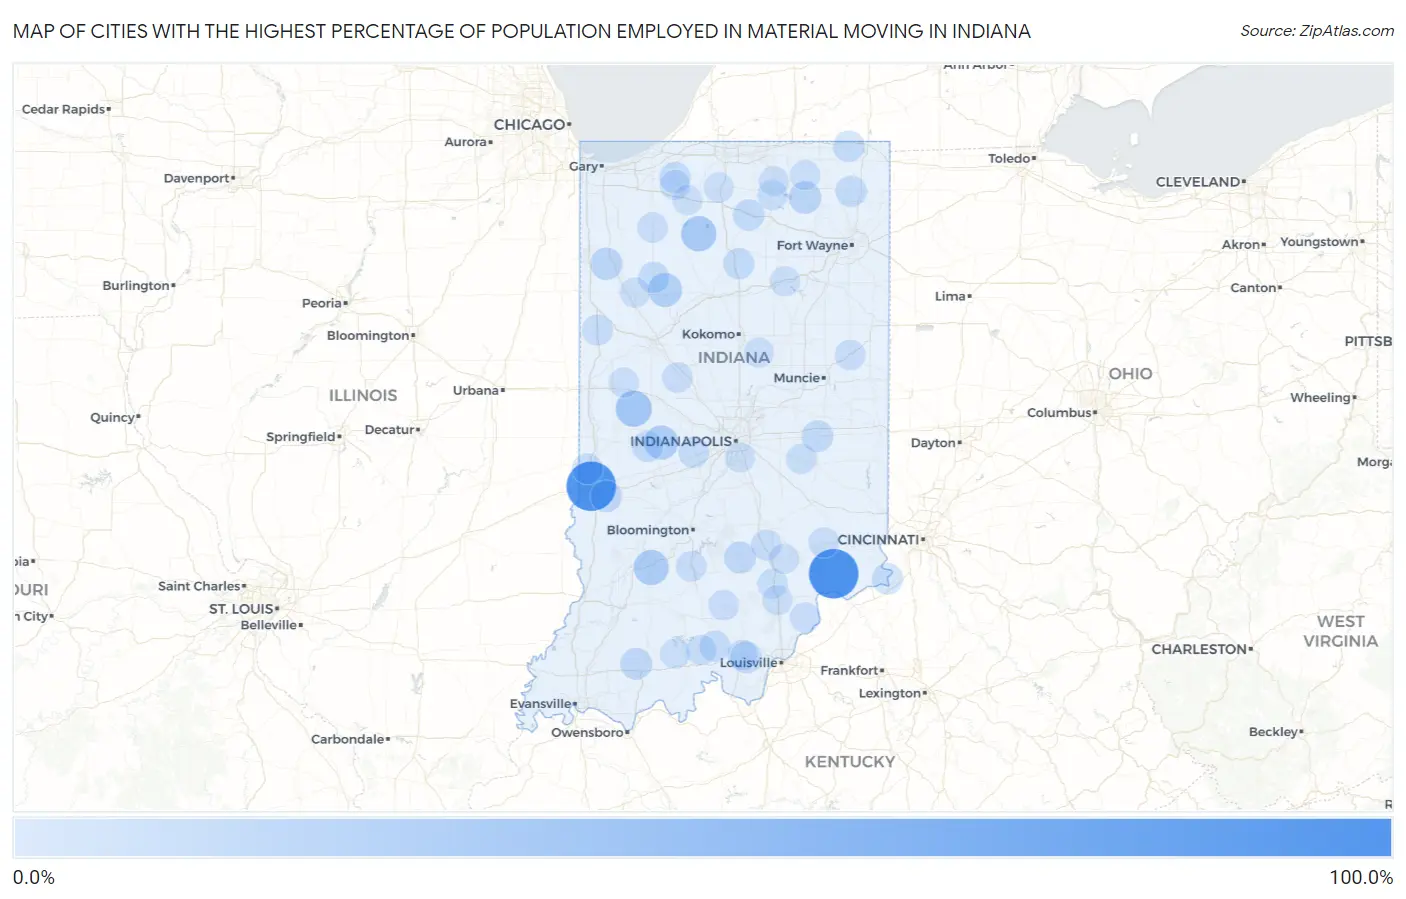
Map of Cities with the Highest Percentage of Population Employed in Material Moving in Indiana
0.0%
100.0%
Cities with the Highest Percentage of Population Employed in Material Moving in Indiana
| City | % Employed | vs State | vs National | |
| 1. | Canaan | 100.0% | 5.4%(+94.6)#1 | 3.8%(+96.2)#5 |
| 2. | Boxley | 100.0% | 5.4%(+94.6)#2 | 3.8%(+96.2)#8 |
| 3. | Cortland | 100.0% | 5.4%(+94.6)#3 | 3.8%(+96.2)#9 |
| 4. | Eckerty | 100.0% | 5.4%(+94.6)#4 | 3.8%(+96.2)#16 |
| 5. | Dresser | 100.0% | 5.4%(+94.6)#5 | 3.8%(+96.2)#17 |
| 6. | Linn Grove | 84.4% | 5.4%(+79.0)#6 | 3.8%(+80.6)#36 |
| 7. | Forest | 63.6% | 5.4%(+58.2)#7 | 3.8%(+59.8)#55 |
| 8. | Wawaka | 55.4% | 5.4%(+50.0)#8 | 3.8%(+51.6)#81 |
| 9. | Alford | 55.3% | 5.4%(+49.9)#9 | 3.8%(+51.5)#82 |
| 10. | Lake Holiday Hideaway | 47.7% | 5.4%(+42.3)#10 | 3.8%(+43.9)#113 |
| 11. | Linnsburg | 47.4% | 5.4%(+42.0)#11 | 3.8%(+43.5)#116 |
| 12. | Wall Lake | 39.5% | 5.4%(+34.1)#12 | 3.8%(+35.7)#174 |
| 13. | Alamo | 39.1% | 5.4%(+33.7)#13 | 3.8%(+35.3)#175 |
| 14. | Lincoln | 38.0% | 5.4%(+32.6)#14 | 3.8%(+34.2)#184 |
| 15. | Sardinia | 37.2% | 5.4%(+31.8)#15 | 3.8%(+33.3)#193 |
| 16. | Monterey | 35.6% | 5.4%(+30.2)#16 | 3.8%(+31.8)#213 |
| 17. | Hillisburg | 34.8% | 5.4%(+29.4)#17 | 3.8%(+31.0)#222 |
| 18. | Scotland | 34.8% | 5.4%(+29.4)#18 | 3.8%(+31.0)#223 |
| 19. | Tippecanoe | 34.5% | 5.4%(+29.1)#19 | 3.8%(+30.7)#226 |
| 20. | Cloverland | 33.7% | 5.4%(+28.3)#20 | 3.8%(+29.9)#236 |
| 21. | Bowling Green | 32.6% | 5.4%(+27.2)#21 | 3.8%(+28.8)#261 |
| 22. | Anoka | 32.3% | 5.4%(+26.9)#22 | 3.8%(+28.5)#263 |
| 23. | Bainbridge | 30.7% | 5.4%(+25.3)#23 | 3.8%(+26.9)#296 |
| 24. | Norway | 30.0% | 5.4%(+24.6)#24 | 3.8%(+26.2)#307 |
| 25. | Blooming Grove | 29.3% | 5.4%(+23.9)#25 | 3.8%(+25.5)#323 |
| 26. | Bringhurst | 28.9% | 5.4%(+23.5)#26 | 3.8%(+25.1)#331 |
| 27. | Miami | 27.8% | 5.4%(+22.4)#27 | 3.8%(+23.9)#357 |
| 28. | Martinsburg | 27.8% | 5.4%(+22.4)#28 | 3.8%(+23.9)#360 |
| 29. | Malden | 27.3% | 5.4%(+21.9)#29 | 3.8%(+23.4)#378 |
| 30. | Rockfield | 26.6% | 5.4%(+21.2)#30 | 3.8%(+22.8)#390 |
| 31. | Nyona Lake | 25.8% | 5.4%(+20.3)#31 | 3.8%(+21.9)#420 |
| 32. | Willow Branch | 25.0% | 5.4%(+19.6)#32 | 3.8%(+21.2)#440 |
| 33. | Cross Plains | 24.3% | 5.4%(+18.9)#33 | 3.8%(+20.5)#474 |
| 34. | Kimmell | 23.9% | 5.4%(+18.5)#34 | 3.8%(+20.0)#498 |
| 35. | Oakville | 23.3% | 5.4%(+17.9)#35 | 3.8%(+19.5)#520 |
| 36. | Mount Ayr | 22.9% | 5.4%(+17.4)#36 | 3.8%(+19.0)#545 |
| 37. | Helmsburg | 22.7% | 5.4%(+17.3)#37 | 3.8%(+18.9)#556 |
| 38. | Brimfield | 21.7% | 5.4%(+16.3)#38 | 3.8%(+17.9)#613 |
| 39. | Freetown | 21.6% | 5.4%(+16.1)#39 | 3.8%(+17.7)#621 |
| 40. | Solsberry | 20.7% | 5.4%(+15.3)#40 | 3.8%(+16.9)#673 |
| 41. | Holland | 20.6% | 5.4%(+15.2)#41 | 3.8%(+16.8)#681 |
| 42. | Riley | 20.6% | 5.4%(+15.2)#42 | 3.8%(+16.8)#683 |
| 43. | Crandall | 20.5% | 5.4%(+15.0)#43 | 3.8%(+16.6)#697 |
| 44. | Dunreith | 20.5% | 5.4%(+15.0)#44 | 3.8%(+16.6)#698 |
| 45. | Rob Roy | 20.5% | 5.4%(+15.0)#45 | 3.8%(+16.6)#700 |
| 46. | Hillsdale | 20.4% | 5.4%(+15.0)#46 | 3.8%(+16.5)#702 |
| 47. | Metz | 20.0% | 5.4%(+14.6)#47 | 3.8%(+16.2)#730 |
| 48. | Wellsboro | 19.8% | 5.4%(+14.4)#48 | 3.8%(+16.0)#738 |
| 49. | Etna Green | 19.5% | 5.4%(+14.1)#49 | 3.8%(+15.7)#760 |
| 50. | Reo | 19.4% | 5.4%(+14.0)#50 | 3.8%(+15.6)#766 |
| 51. | Homer | 19.3% | 5.4%(+13.9)#51 | 3.8%(+15.5)#773 |
| 52. | Kingsbury | 19.0% | 5.4%(+13.6)#52 | 3.8%(+15.2)#796 |
| 53. | Fairbanks | 18.7% | 5.4%(+13.3)#53 | 3.8%(+14.9)#830 |
| 54. | Corunna | 18.7% | 5.4%(+13.3)#54 | 3.8%(+14.9)#831 |
| 55. | Orland | 18.6% | 5.4%(+13.2)#55 | 3.8%(+14.8)#838 |
| 56. | Van Bibber Lake | 18.6% | 5.4%(+13.1)#56 | 3.8%(+14.7)#846 |
| 57. | Center | 18.5% | 5.4%(+13.1)#57 | 3.8%(+14.7)#850 |
| 58. | Patriot | 18.4% | 5.4%(+13.0)#58 | 3.8%(+14.6)#861 |
| 59. | Marengo | 18.3% | 5.4%(+12.9)#59 | 3.8%(+14.5)#873 |
| 60. | Monon | 18.2% | 5.4%(+12.8)#60 | 3.8%(+14.4)#879 |
| 61. | Macy | 18.1% | 5.4%(+12.6)#61 | 3.8%(+14.2)#907 |
| 62. | Twelve Mile | 17.6% | 5.4%(+12.2)#62 | 3.8%(+13.8)#957 |
| 63. | Amity | 17.2% | 5.4%(+11.7)#63 | 3.8%(+13.3)#1,016 |
| 64. | New Lisbon | 17.1% | 5.4%(+11.7)#64 | 3.8%(+13.3)#1,022 |
| 65. | Arcola | 17.1% | 5.4%(+11.7)#65 | 3.8%(+13.3)#1,024 |
| 66. | Boswell | 16.7% | 5.4%(+11.3)#66 | 3.8%(+12.8)#1,071 |
| 67. | New Goshen | 16.6% | 5.4%(+11.2)#67 | 3.8%(+12.8)#1,101 |
| 68. | Clayton | 16.5% | 5.4%(+11.1)#68 | 3.8%(+12.6)#1,118 |
| 69. | Jonesville | 16.3% | 5.4%(+10.9)#69 | 3.8%(+12.5)#1,140 |
| 70. | Lake Eliza | 16.2% | 5.4%(+10.8)#70 | 3.8%(+12.4)#1,161 |
| 71. | Romney | 16.1% | 5.4%(+10.7)#71 | 3.8%(+12.3)#1,180 |
| 72. | Avoca | 15.9% | 5.4%(+10.5)#72 | 3.8%(+12.1)#1,206 |
| 73. | Colfax | 15.9% | 5.4%(+10.5)#73 | 3.8%(+12.0)#1,215 |
| 74. | San Pierre | 15.8% | 5.4%(+10.4)#74 | 3.8%(+12.0)#1,220 |
| 75. | Servia | 15.5% | 5.4%(+10.1)#75 | 3.8%(+11.7)#1,271 |
| 76. | Campbellsburg | 15.5% | 5.4%(+10.0)#76 | 3.8%(+11.6)#1,288 |
| 77. | Milford | 15.4% | 5.4%(+9.97)#77 | 3.8%(+11.6)#1,297 |
| 78. | Jimmerson Lake | 15.4% | 5.4%(+9.97)#78 | 3.8%(+11.6)#1,298 |
| 79. | New Salisbury | 15.4% | 5.4%(+9.97)#79 | 3.8%(+11.6)#1,300 |
| 80. | Stanford | 15.4% | 5.4%(+9.97)#80 | 3.8%(+11.6)#1,301 |
| 81. | Redkey | 15.3% | 5.4%(+9.90)#81 | 3.8%(+11.5)#1,322 |
| 82. | New Washington | 15.2% | 5.4%(+9.79)#82 | 3.8%(+11.4)#1,336 |
| 83. | Crothersville | 15.1% | 5.4%(+9.65)#83 | 3.8%(+11.2)#1,368 |
| 84. | Holton | 14.9% | 5.4%(+9.47)#84 | 3.8%(+11.0)#1,400 |
| 85. | Arlington | 14.8% | 5.4%(+9.42)#85 | 3.8%(+11.0)#1,409 |
| 86. | English | 14.8% | 5.4%(+9.42)#86 | 3.8%(+11.0)#1,412 |
| 87. | Windfall City | 14.8% | 5.4%(+9.34)#87 | 3.8%(+10.9)#1,430 |
| 88. | Topeka | 14.7% | 5.4%(+9.25)#88 | 3.8%(+10.8)#1,451 |
| 89. | Hayden | 14.6% | 5.4%(+9.20)#89 | 3.8%(+10.8)#1,465 |
| 90. | Wolcott | 14.6% | 5.4%(+9.18)#90 | 3.8%(+10.8)#1,472 |
| 91. | Southport | 14.6% | 5.4%(+9.17)#91 | 3.8%(+10.8)#1,474 |
| 92. | La Paz | 14.5% | 5.4%(+9.05)#92 | 3.8%(+10.6)#1,491 |
| 93. | Kingsford Heights | 14.5% | 5.4%(+9.04)#93 | 3.8%(+10.6)#1,496 |
| 94. | Hamlet | 14.4% | 5.4%(+8.99)#94 | 3.8%(+10.6)#1,504 |
| 95. | Marshfield | 14.3% | 5.4%(+8.87)#95 | 3.8%(+10.5)#1,546 |
| 96. | Scottsburg | 14.2% | 5.4%(+8.81)#96 | 3.8%(+10.4)#1,563 |
| 97. | New Paris | 14.2% | 5.4%(+8.80)#97 | 3.8%(+10.4)#1,564 |
| 98. | Lagro | 14.2% | 5.4%(+8.79)#98 | 3.8%(+10.4)#1,566 |
| 99. | Mellott | 14.1% | 5.4%(+8.65)#99 | 3.8%(+10.2)#1,596 |
| 100. | Birdseye | 14.1% | 5.4%(+8.64)#100 | 3.8%(+10.2)#1,599 |
Common Questions
What are the Top 10 Cities with the Highest Percentage of Population Employed in Material Moving in Indiana?
Top 10 Cities with the Highest Percentage of Population Employed in Material Moving in Indiana are:
What city has the Highest Percentage of Population Employed in Material Moving in Indiana?
Canaan has the Highest Percentage of Population Employed in Material Moving in Indiana with 100.0%.
What is the Percentage of Population Employed in Material Moving in the State of Indiana?
Percentage of Population Employed in Material Moving in Indiana is 5.4%.
What is the Percentage of Population Employed in Material Moving in the United States?
Percentage of Population Employed in Material Moving in the United States is 3.8%.