Winchester, CA Map & Demographics
Winchester Map
Winchester Overview
$22,786
PER CAPITA INCOME
$82,584
AVG FAMILY INCOME
$70,865
AVG HOUSEHOLD INCOME
42.5%
WAGE / INCOME GAP [ % ]
57.5¢/ $1
WAGE / INCOME GAP [ $ ]
0.31
INEQUALITY / GINI INDEX
2,917
TOTAL POPULATION
1,671
MALE POPULATION
1,246
FEMALE POPULATION
134.11
MALES / 100 FEMALES
74.57
FEMALES / 100 MALES
40.2
MEDIAN AGE
4.3
AVG FAMILY SIZE
3.5
AVG HOUSEHOLD SIZE
1,204
LABOR FORCE [ PEOPLE ]
47.4%
PERCENT IN LABOR FORCE
4.1%
UNEMPLOYMENT RATE
Winchester Zip Codes
Income in Winchester
Income Overview in Winchester
Per Capita Income in Winchester is $22,786, while median incomes of families and households are $82,584 and $70,865 respectively.
| Characteristic | Number | Measure |
| Per Capita Income | 2,917 | $22,786 |
| Median Family Income | 601 | $82,584 |
| Mean Family Income | 601 | $83,547 |
| Median Household Income | 832 | $70,865 |
| Mean Household Income | 832 | $72,032 |
| Income Deficit | 601 | $0 |
| Wage / Income Gap (%) | 2,917 | 42.50% |
| Wage / Income Gap ($) | 2,917 | 57.50¢ per $1 |
| Gini / Inequality Index | 2,917 | 0.31 |
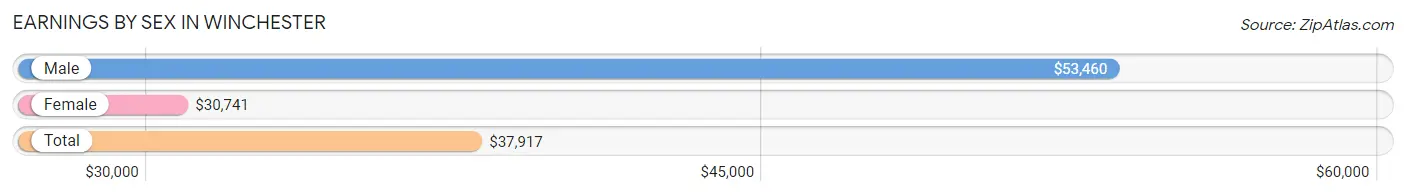
Earnings by Sex in Winchester
Average Earnings in Winchester are $37,917, $53,460 for men and $30,741 for women, a difference of 42.5%.
| Sex | Number | Average Earnings |
| Male | 815 (65.4%) | $53,460 |
| Female | 432 (34.6%) | $30,741 |
| Total | 1,247 (100.0%) | $37,917 |
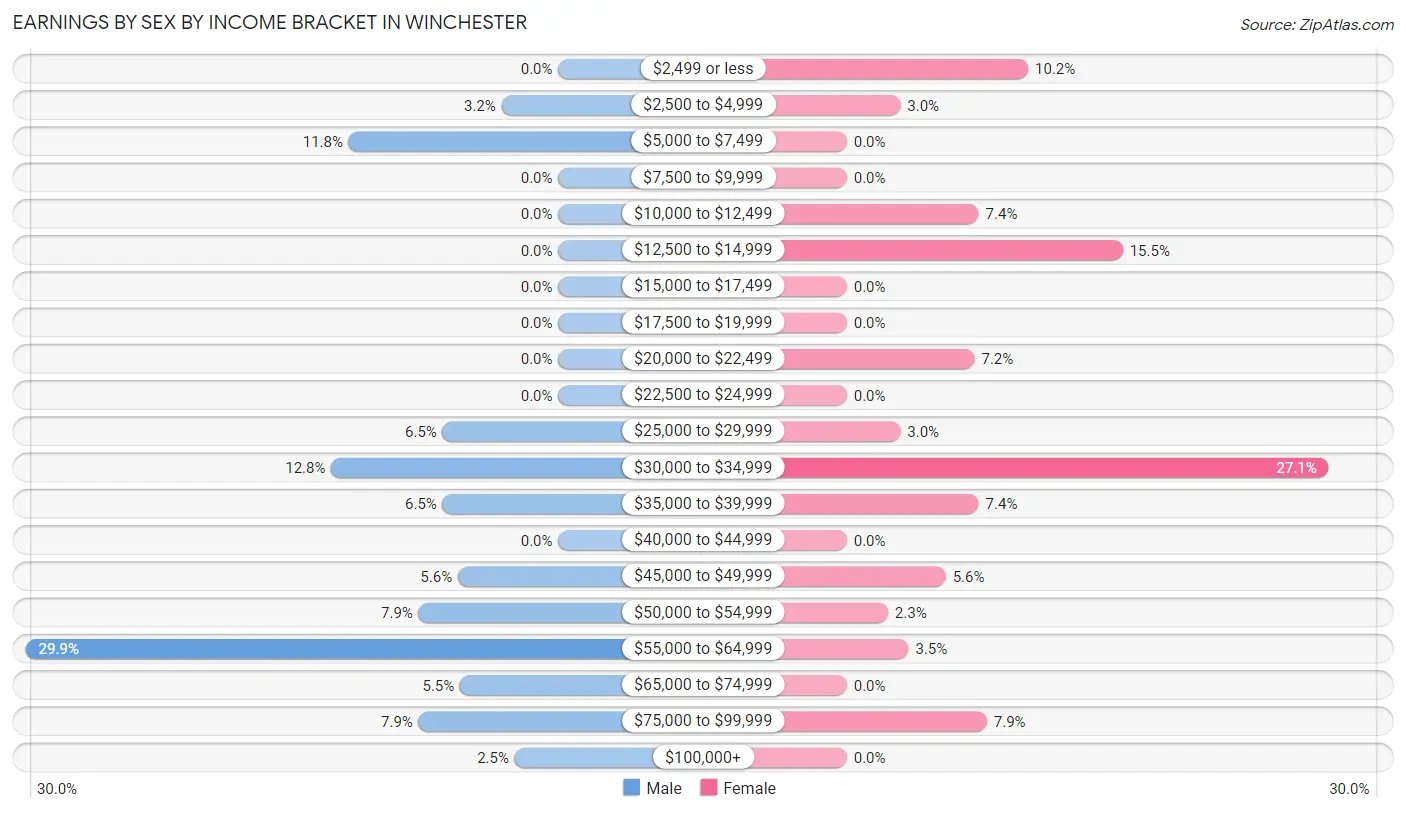
Earnings by Sex by Income Bracket in Winchester
The most common earnings brackets in Winchester are $55,000 to $64,999 for men (244 | 29.9%) and $30,000 to $34,999 for women (117 | 27.1%).
| Income | Male | Female |
| $2,499 or less | 0 (0.0%) | 44 (10.2%) |
| $2,500 to $4,999 | 26 (3.2%) | 13 (3.0%) |
| $5,000 to $7,499 | 96 (11.8%) | 0 (0.0%) |
| $7,500 to $9,999 | 0 (0.0%) | 0 (0.0%) |
| $10,000 to $12,499 | 0 (0.0%) | 32 (7.4%) |
| $12,500 to $14,999 | 0 (0.0%) | 67 (15.5%) |
| $15,000 to $17,499 | 0 (0.0%) | 0 (0.0%) |
| $17,500 to $19,999 | 0 (0.0%) | 0 (0.0%) |
| $20,000 to $22,499 | 0 (0.0%) | 31 (7.2%) |
| $22,500 to $24,999 | 0 (0.0%) | 0 (0.0%) |
| $25,000 to $29,999 | 53 (6.5%) | 13 (3.0%) |
| $30,000 to $34,999 | 104 (12.8%) | 117 (27.1%) |
| $35,000 to $39,999 | 53 (6.5%) | 32 (7.4%) |
| $40,000 to $44,999 | 0 (0.0%) | 0 (0.0%) |
| $45,000 to $49,999 | 46 (5.6%) | 24 (5.6%) |
| $50,000 to $54,999 | 64 (7.9%) | 10 (2.3%) |
| $55,000 to $64,999 | 244 (29.9%) | 15 (3.5%) |
| $65,000 to $74,999 | 45 (5.5%) | 0 (0.0%) |
| $75,000 to $99,999 | 64 (7.9%) | 34 (7.9%) |
| $100,000+ | 20 (2.5%) | 0 (0.0%) |
| Total | 815 (100.0%) | 432 (100.0%) |
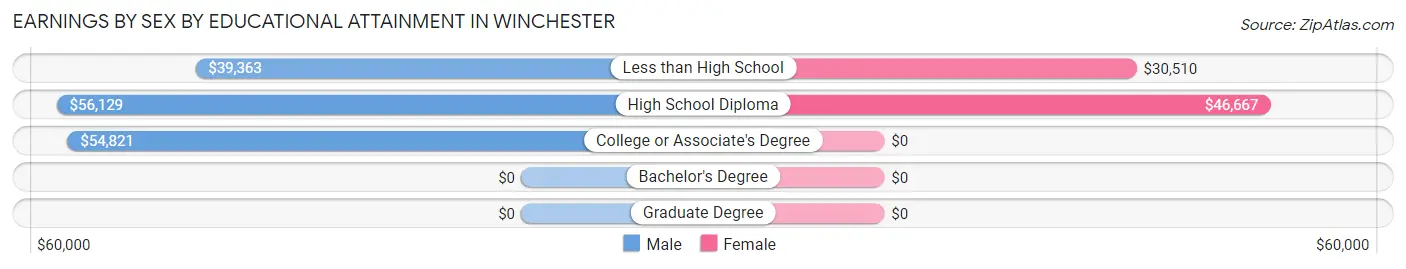
Earnings by Sex by Educational Attainment in Winchester
Average earnings in Winchester are $55,611 for men and $32,865 for women, a difference of 40.9%. Men with an educational attainment of high school diploma enjoy the highest average annual earnings of $56,129, while those with less than high school education earn the least with $39,363. Women with an educational attainment of high school diploma earn the most with the average annual earnings of $46,667, while those with less than high school education have the smallest earnings of $30,510.
| Educational Attainment | Male Income | Female Income |
| Less than High School | $39,363 | $30,510 |
| High School Diploma | $56,129 | $46,667 |
| College or Associate's Degree | $54,821 | $0 |
| Bachelor's Degree | - | - |
| Graduate Degree | - | - |
| Total | $55,611 | $32,865 |
Family Income in Winchester
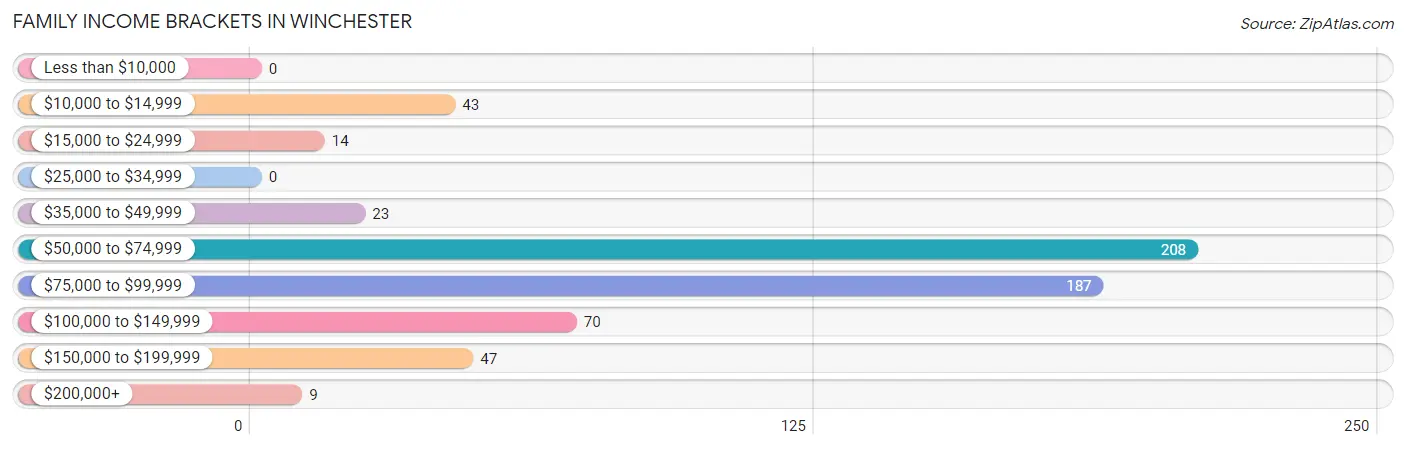
Family Income Brackets in Winchester
According to the Winchester family income data, there are 208 families falling into the $50,000 to $74,999 income range, which is the most common income bracket and makes up 34.6% of all families.
| Income Bracket | # Families | % Families |
| Less than $10,000 | 0 | 0.0% |
| $10,000 to $14,999 | 43 | 7.2% |
| $15,000 to $24,999 | 14 | 2.3% |
| $25,000 to $34,999 | 0 | 0.0% |
| $35,000 to $49,999 | 23 | 3.8% |
| $50,000 to $74,999 | 208 | 34.6% |
| $75,000 to $99,999 | 187 | 31.1% |
| $100,000 to $149,999 | 70 | 11.6% |
| $150,000 to $199,999 | 47 | 7.8% |
| $200,000+ | 9 | 1.5% |
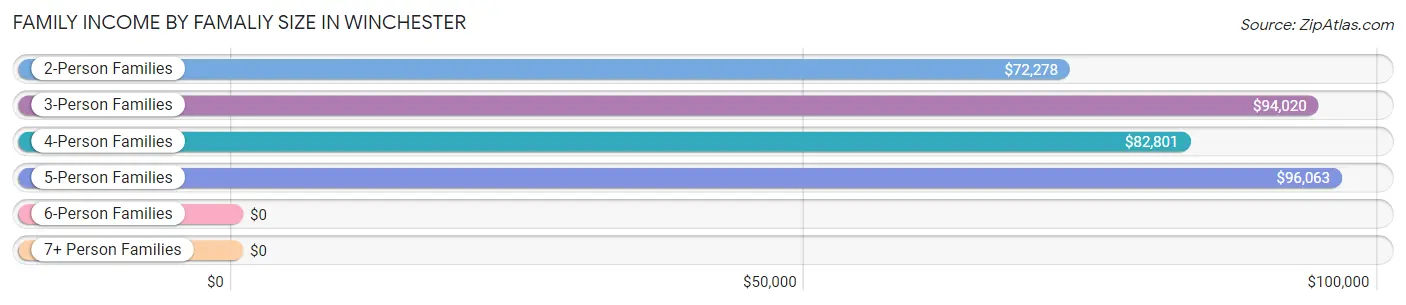
Family Income by Famaliy Size in Winchester
5-person families (45 | 7.5%) account for the highest median family income in Winchester with $96,063 per family, while 2-person families (147 | 24.5%) have the highest median income of $36,139 per family member.
| Income Bracket | # Families | Median Income |
| 2-Person Families | 147 (24.5%) | $72,278 |
| 3-Person Families | 106 (17.6%) | $94,020 |
| 4-Person Families | 189 (31.5%) | $82,801 |
| 5-Person Families | 45 (7.5%) | $96,063 |
| 6-Person Families | 97 (16.1%) | $0 |
| 7+ Person Families | 17 (2.8%) | $0 |
| Total | 601 (100.0%) | $82,584 |
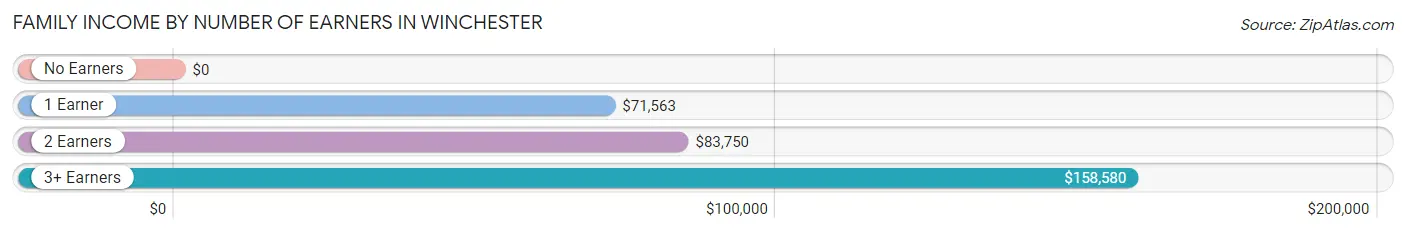
Family Income by Number of Earners in Winchester
| Number of Earners | # Families | Median Income |
| No Earners | 14 (2.3%) | $0 |
| 1 Earner | 324 (53.9%) | $71,563 |
| 2 Earners | 220 (36.6%) | $83,750 |
| 3+ Earners | 43 (7.1%) | $158,580 |
| Total | 601 (100.0%) | $82,584 |
Household Income in Winchester
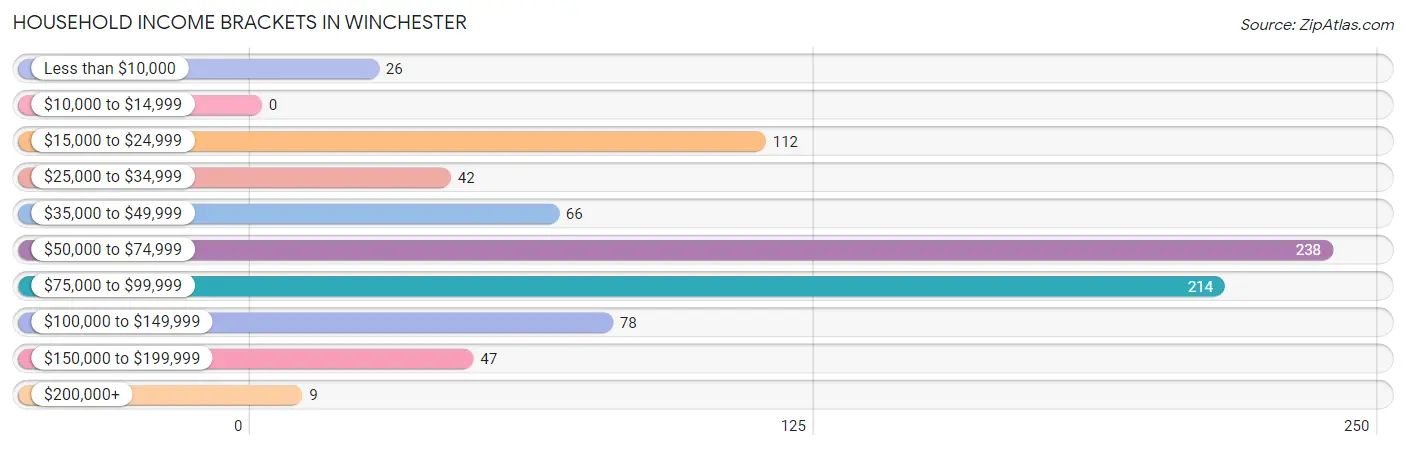
Household Income Brackets in Winchester
With 238 households falling in the category, the $50,000 to $74,999 income range is the most frequent in Winchester, accounting for 28.6% of all households.
| Income Bracket | # Households | % Households |
| Less than $10,000 | 26 | 3.1% |
| $10,000 to $14,999 | 0 | 0.0% |
| $15,000 to $24,999 | 112 | 13.5% |
| $25,000 to $34,999 | 42 | 5.0% |
| $35,000 to $49,999 | 66 | 7.9% |
| $50,000 to $74,999 | 238 | 28.6% |
| $75,000 to $99,999 | 214 | 25.7% |
| $100,000 to $149,999 | 78 | 9.4% |
| $150,000 to $199,999 | 47 | 5.6% |
| $200,000+ | 9 | 1.1% |
Household Income by Householder Age in Winchester
The median household income in Winchester is $70,865, with the highest median household income of $71,658 found in the 45 to 64 years age bracket for the primary householder. A total of 564 households (67.8%) fall into this category.
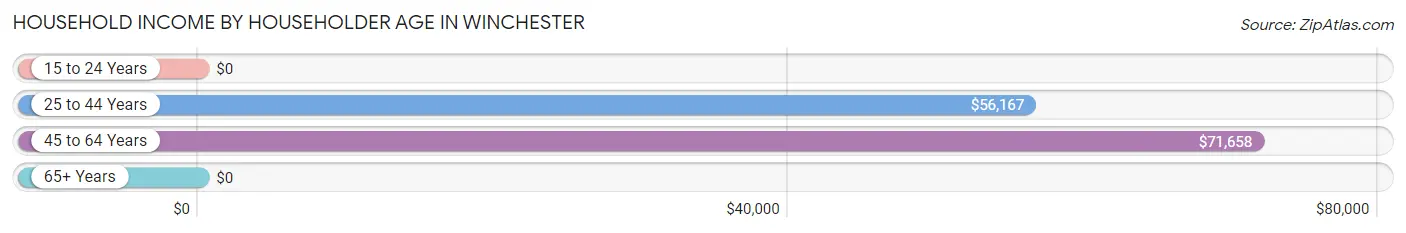
| Income Bracket | # Households | Median Income |
| 15 to 24 Years | 0 (0.0%) | $0 |
| 25 to 44 Years | 180 (21.6%) | $56,167 |
| 45 to 64 Years | 564 (67.8%) | $71,658 |
| 65+ Years | 88 (10.6%) | $0 |
| Total | 832 (100.0%) | $70,865 |
Poverty in Winchester
Income Below Poverty by Sex and Age in Winchester
With 10.0% poverty level for males and 11.0% for females among the residents of Winchester, 18 to 24 year old males and 15 year old females are the most vulnerable to poverty, with 96 males (72.2%) and 47 females (92.2%) in their respective age groups living below the poverty level.
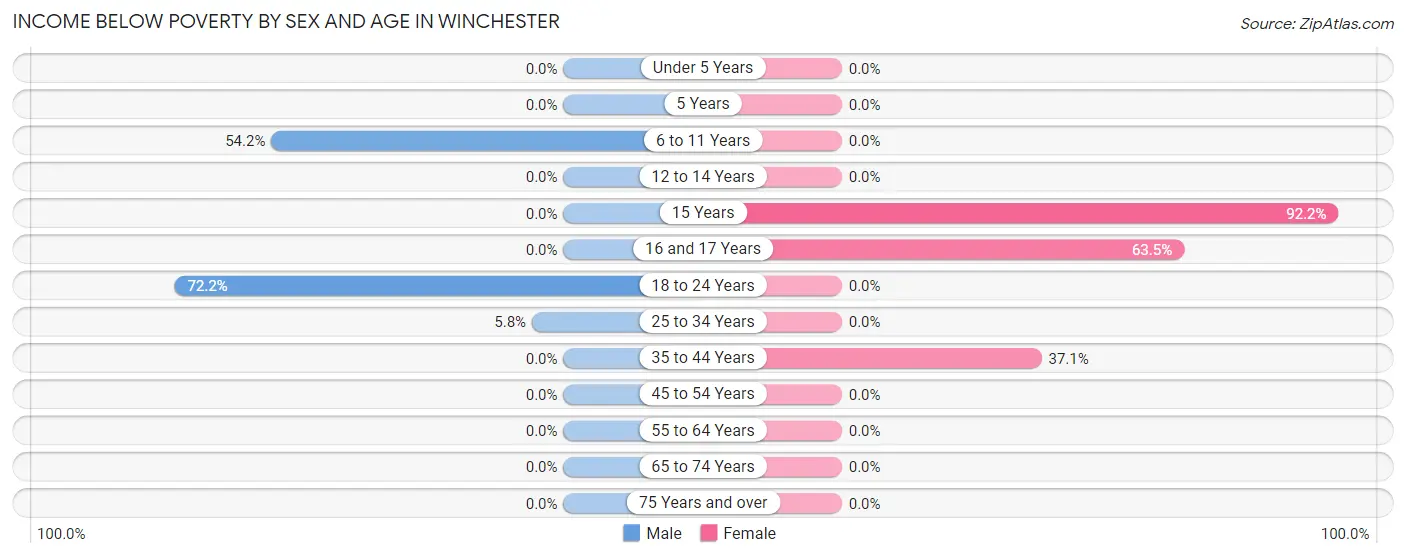
| Age Bracket | Male | Female |
| Under 5 Years | 0 (0.0%) | 0 (0.0%) |
| 5 Years | 0 (0.0%) | 0 (0.0%) |
| 6 to 11 Years | 45 (54.2%) | 0 (0.0%) |
| 12 to 14 Years | 0 (0.0%) | 0 (0.0%) |
| 15 Years | 0 (0.0%) | 47 (92.2%) |
| 16 and 17 Years | 0 (0.0%) | 47 (63.5%) |
| 18 to 24 Years | 96 (72.2%) | 0 (0.0%) |
| 25 to 34 Years | 26 (5.8%) | 0 (0.0%) |
| 35 to 44 Years | 0 (0.0%) | 43 (37.1%) |
| 45 to 54 Years | 0 (0.0%) | 0 (0.0%) |
| 55 to 64 Years | 0 (0.0%) | 0 (0.0%) |
| 65 to 74 Years | 0 (0.0%) | 0 (0.0%) |
| 75 Years and over | 0 (0.0%) | 0 (0.0%) |
| Total | 167 (10.0%) | 137 (11.0%) |
Income Above Poverty by Sex and Age in Winchester
According to the poverty statistics in Winchester, males aged under 5 years and females aged under 5 years are the age groups that are most secure financially, with 100.0% of males and 100.0% of females in these age groups living above the poverty line.
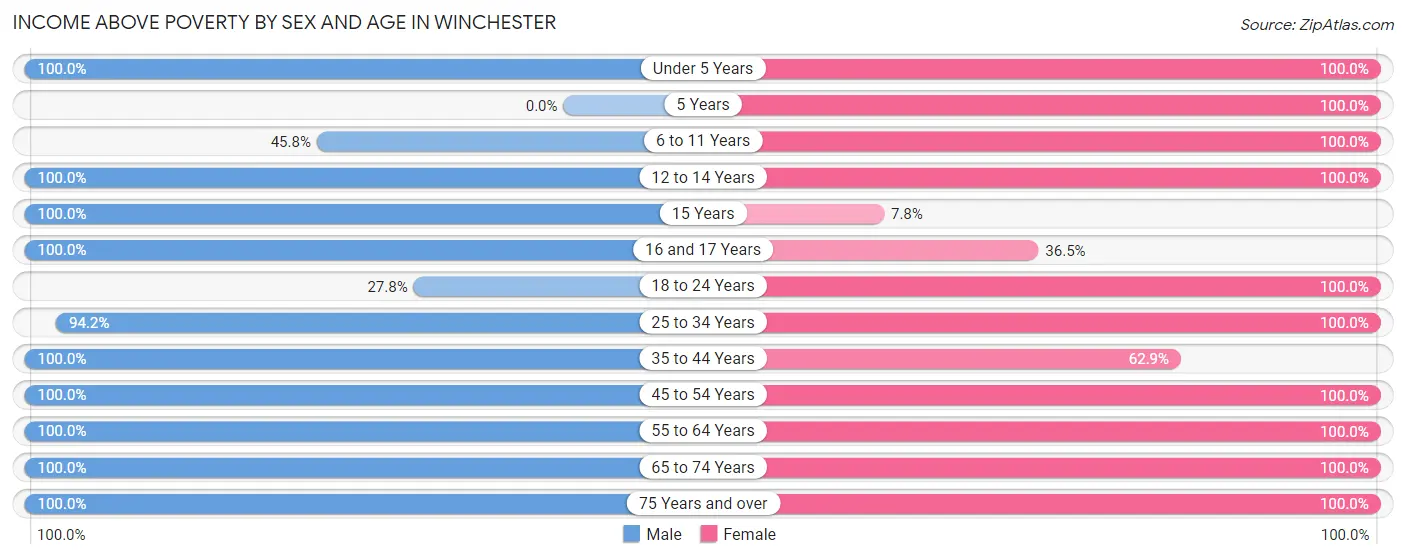
| Age Bracket | Male | Female |
| Under 5 Years | 118 (100.0%) | 28 (100.0%) |
| 5 Years | 0 (0.0%) | 27 (100.0%) |
| 6 to 11 Years | 38 (45.8%) | 35 (100.0%) |
| 12 to 14 Years | 14 (100.0%) | 5 (100.0%) |
| 15 Years | 15 (100.0%) | 4 (7.8%) |
| 16 and 17 Years | 23 (100.0%) | 27 (36.5%) |
| 18 to 24 Years | 37 (27.8%) | 193 (100.0%) |
| 25 to 34 Years | 419 (94.2%) | 101 (100.0%) |
| 35 to 44 Years | 64 (100.0%) | 73 (62.9%) |
| 45 to 54 Years | 100 (100.0%) | 146 (100.0%) |
| 55 to 64 Years | 414 (100.0%) | 302 (100.0%) |
| 65 to 74 Years | 128 (100.0%) | 30 (100.0%) |
| 75 Years and over | 134 (100.0%) | 138 (100.0%) |
| Total | 1,504 (90.0%) | 1,109 (89.0%) |
Income Below Poverty Among Married-Couple Families in Winchester
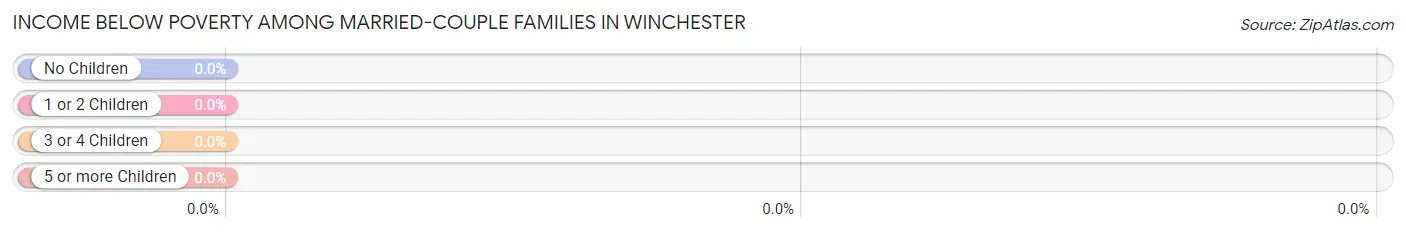
| Children | Above Poverty | Below Poverty |
| No Children | 258 (100.0%) | 0 (0.0%) |
| 1 or 2 Children | 127 (100.0%) | 0 (0.0%) |
| 3 or 4 Children | 17 (100.0%) | 0 (0.0%) |
| 5 or more Children | 0 (0.0%) | 0 (0.0%) |
| Total | 402 (100.0%) | 0 (0.0%) |
Income Below Poverty Among Single-Parent Households in Winchester
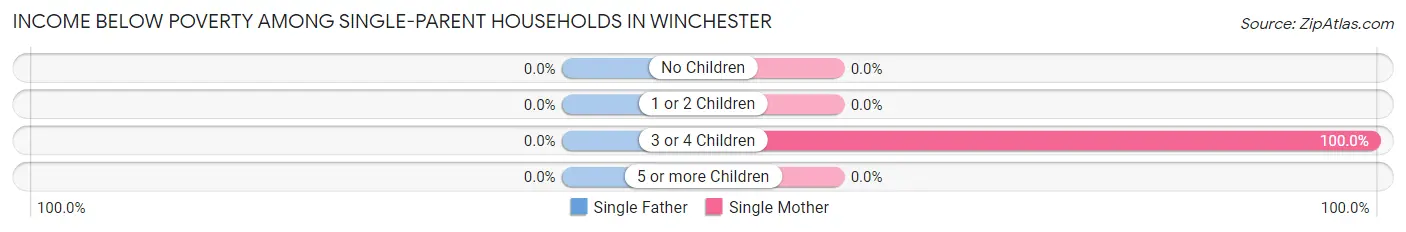
| Children | Single Father | Single Mother |
| No Children | 0 (0.0%) | 0 (0.0%) |
| 1 or 2 Children | 0 (0.0%) | 0 (0.0%) |
| 3 or 4 Children | 0 (0.0%) | 43 (100.0%) |
| 5 or more Children | 0 (0.0%) | 0 (0.0%) |
| Total | 0 (0.0%) | 43 (23.0%) |
Income Below Poverty Among Married-Couple vs Single-Parent Households in Winchester
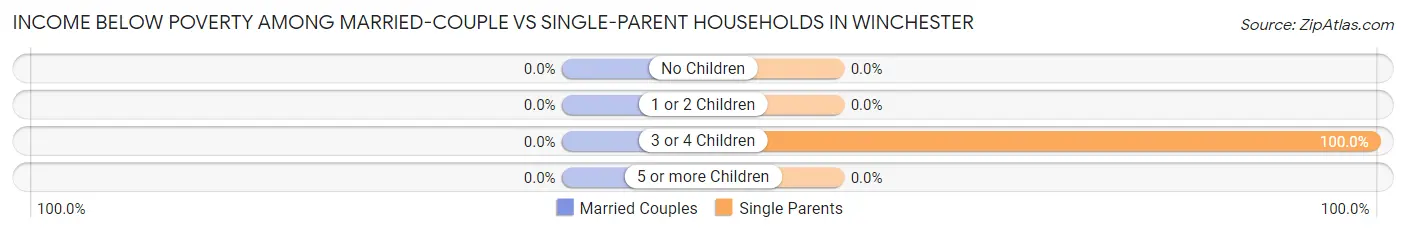
| Children | Married-Couple Families | Single-Parent Households |
| No Children | 0 (0.0%) | 0 (0.0%) |
| 1 or 2 Children | 0 (0.0%) | 0 (0.0%) |
| 3 or 4 Children | 0 (0.0%) | 43 (100.0%) |
| 5 or more Children | 0 (0.0%) | 0 (0.0%) |
| Total | 0 (0.0%) | 43 (21.6%) |
Race in Winchester
The most populous races in Winchester are Hispanic or Latino (1,598 | 54.8%), White / Caucasian (1,281 | 43.9%), and Some other Race (1,176 | 40.3%).
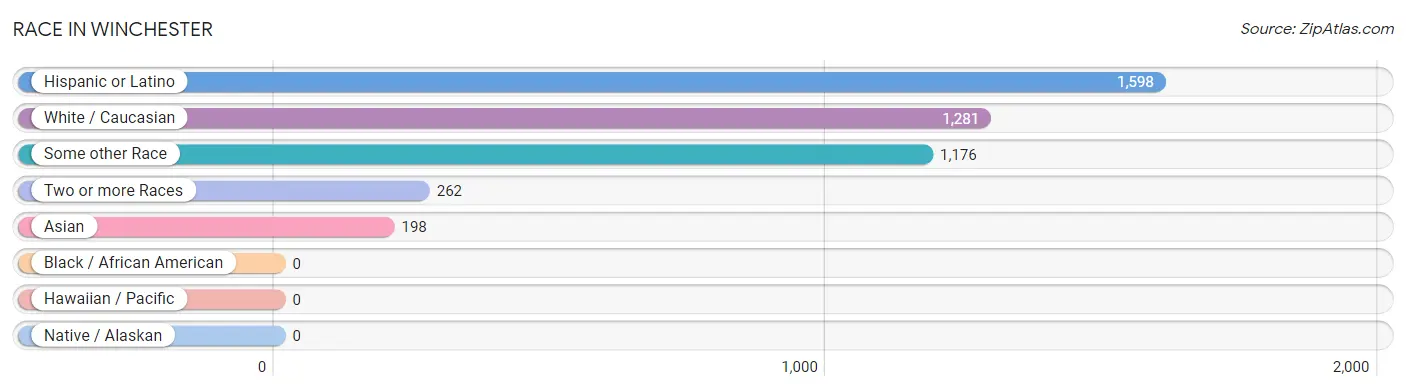
| Race | # Population | % Population |
| Asian | 198 | 6.8% |
| Black / African American | 0 | 0.0% |
| Hawaiian / Pacific | 0 | 0.0% |
| Hispanic or Latino | 1,598 | 54.8% |
| Native / Alaskan | 0 | 0.0% |
| White / Caucasian | 1,281 | 43.9% |
| Two or more Races | 262 | 9.0% |
| Some other Race | 1,176 | 40.3% |
| Total | 2,917 | 100.0% |
Ancestry in Winchester
The most populous ancestries reported in Winchester are Mexican (1,557 | 53.4%), Irish (325 | 11.1%), English (230 | 7.9%), German (156 | 5.3%), and American (145 | 5.0%), together accounting for 82.7% of all Winchester residents.
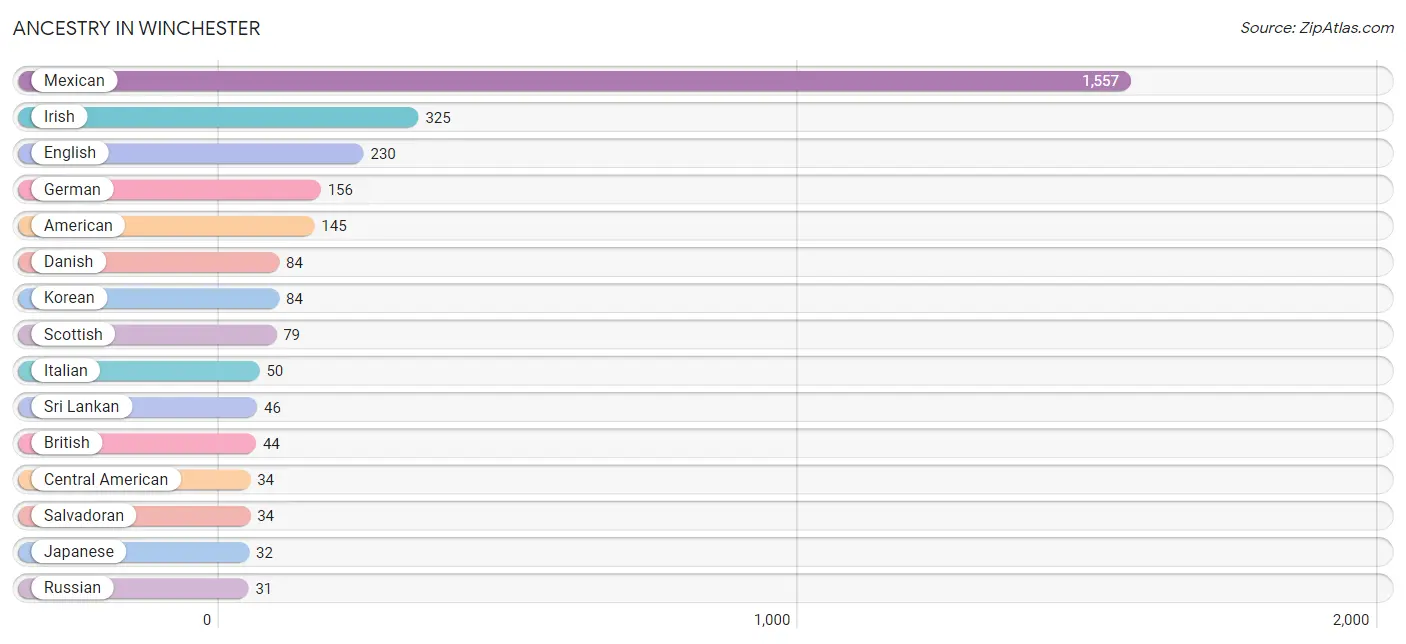
| Ancestry | # Population | % Population |
| American | 145 | 5.0% |
| Arab | 26 | 0.9% |
| British | 44 | 1.5% |
| Central American | 34 | 1.2% |
| Danish | 84 | 2.9% |
| English | 230 | 7.9% |
| European | 15 | 0.5% |
| French | 24 | 0.8% |
| German | 156 | 5.3% |
| Indian (Asian) | 28 | 1.0% |
| Irish | 325 | 11.1% |
| Italian | 50 | 1.7% |
| Japanese | 32 | 1.1% |
| Jordanian | 26 | 0.9% |
| Korean | 84 | 2.9% |
| Laotian | 9 | 0.3% |
| Mexican | 1,557 | 53.4% |
| Russian | 31 | 1.1% |
| Salvadoran | 34 | 1.2% |
| Scotch-Irish | 19 | 0.6% |
| Scottish | 79 | 2.7% |
| Sri Lankan | 46 | 1.6% |
| Welsh | 31 | 1.1% | View All 23 Rows |
Immigrants in Winchester
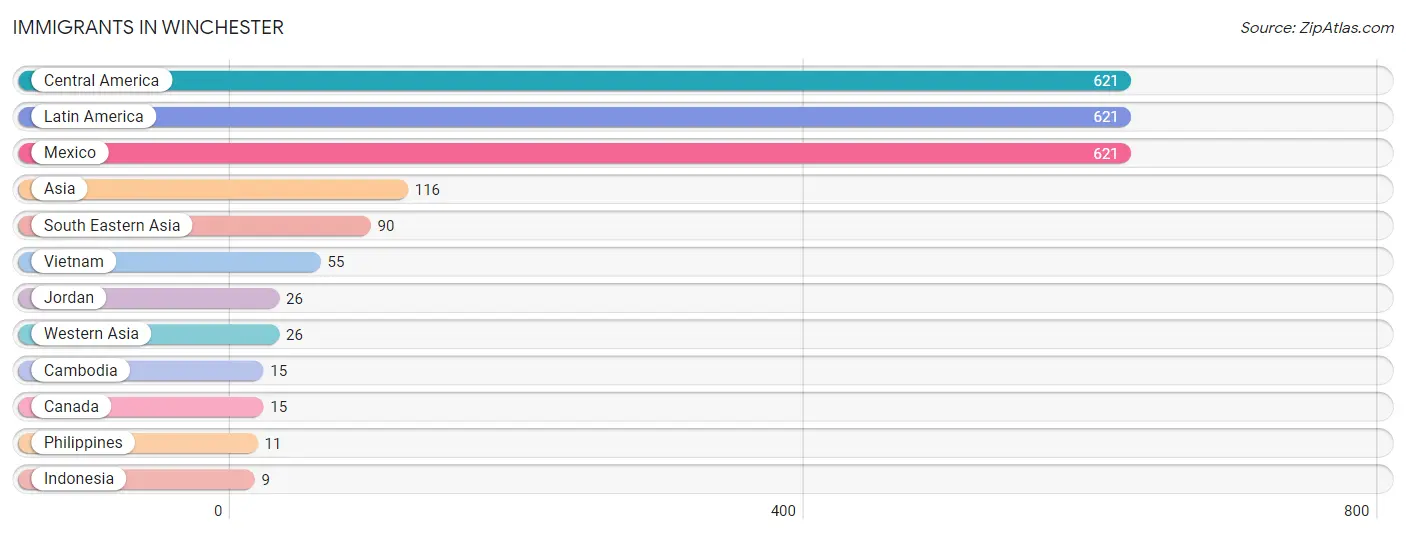
The most numerous immigrant groups reported in Winchester came from Central America (621 | 21.3%), Latin America (621 | 21.3%), Mexico (621 | 21.3%), Asia (116 | 4.0%), and South Eastern Asia (90 | 3.1%), together accounting for 70.9% of all Winchester residents.
| Immigration Origin | # Population | % Population |
| Asia | 116 | 4.0% |
| Cambodia | 15 | 0.5% |
| Canada | 15 | 0.5% |
| Central America | 621 | 21.3% |
| Indonesia | 9 | 0.3% |
| Jordan | 26 | 0.9% |
| Latin America | 621 | 21.3% |
| Mexico | 621 | 21.3% |
| Philippines | 11 | 0.4% |
| South Eastern Asia | 90 | 3.1% |
| Vietnam | 55 | 1.9% |
| Western Asia | 26 | 0.9% | View All 12 Rows |
Sex and Age in Winchester
Sex and Age in Winchester
The most populous age groups in Winchester are 30 to 34 Years (270 | 16.2%) for men and 20 to 24 Years (181 | 14.5%) for women.
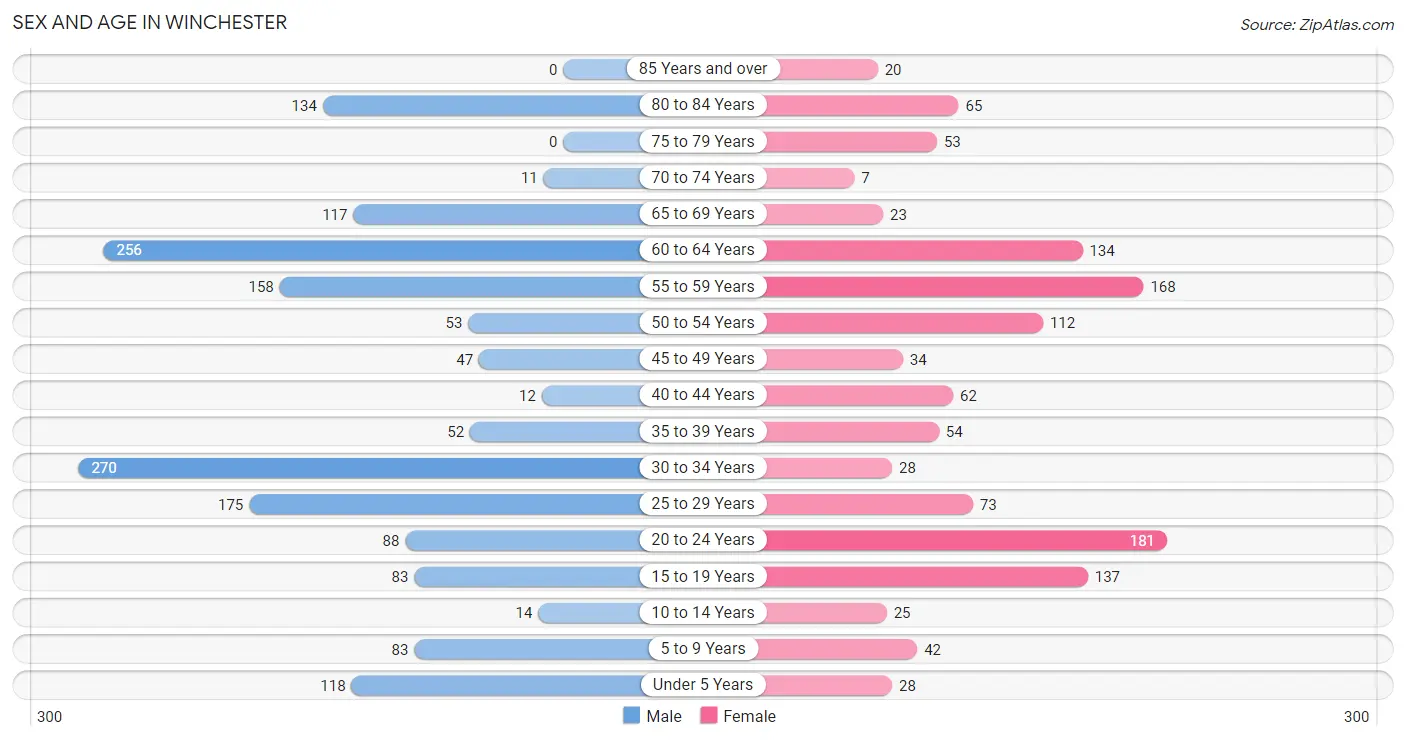
| Age Bracket | Male | Female |
| Under 5 Years | 118 (7.1%) | 28 (2.2%) |
| 5 to 9 Years | 83 (5.0%) | 42 (3.4%) |
| 10 to 14 Years | 14 (0.8%) | 25 (2.0%) |
| 15 to 19 Years | 83 (5.0%) | 137 (11.0%) |
| 20 to 24 Years | 88 (5.3%) | 181 (14.5%) |
| 25 to 29 Years | 175 (10.5%) | 73 (5.9%) |
| 30 to 34 Years | 270 (16.2%) | 28 (2.2%) |
| 35 to 39 Years | 52 (3.1%) | 54 (4.3%) |
| 40 to 44 Years | 12 (0.7%) | 62 (5.0%) |
| 45 to 49 Years | 47 (2.8%) | 34 (2.7%) |
| 50 to 54 Years | 53 (3.2%) | 112 (9.0%) |
| 55 to 59 Years | 158 (9.5%) | 168 (13.5%) |
| 60 to 64 Years | 256 (15.3%) | 134 (10.7%) |
| 65 to 69 Years | 117 (7.0%) | 23 (1.8%) |
| 70 to 74 Years | 11 (0.7%) | 7 (0.6%) |
| 75 to 79 Years | 0 (0.0%) | 53 (4.3%) |
| 80 to 84 Years | 134 (8.0%) | 65 (5.2%) |
| 85 Years and over | 0 (0.0%) | 20 (1.6%) |
| Total | 1,671 (100.0%) | 1,246 (100.0%) |
Families and Households in Winchester
Median Family Size in Winchester
The median family size in Winchester is 4.34 persons per family, with single female/mother families (187 | 31.1%) accounting for the largest median family size of 4.43 persons per family. On the other hand, single male/father families (12 | 2.0%) represent the smallest median family size with 3.08 persons per family.
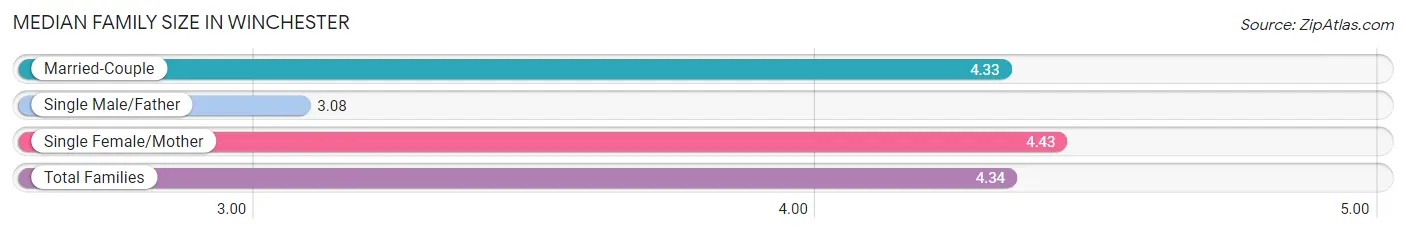
| Family Type | # Families | Family Size |
| Married-Couple | 402 (66.9%) | 4.33 |
| Single Male/Father | 12 (2.0%) | 3.08 |
| Single Female/Mother | 187 (31.1%) | 4.43 |
| Total Families | 601 (100.0%) | 4.34 |
Median Household Size in Winchester
The median household size in Winchester is 3.51 persons per household, with single female/mother households (187 | 22.5%) accounting for the largest median household size of 4.72 persons per household. non-family households (231 | 27.8%) represent the smallest median household size with 1.05 persons per household.
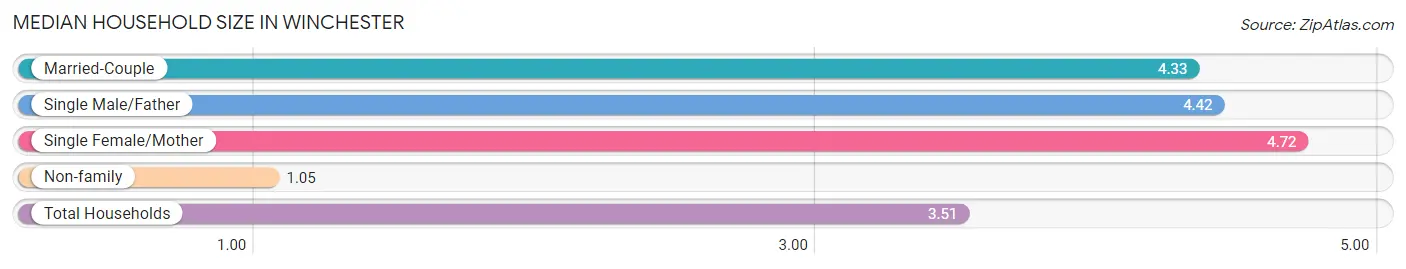
| Household Type | # Households | Household Size |
| Married-Couple | 402 (48.3%) | 4.33 |
| Single Male/Father | 12 (1.4%) | 4.42 |
| Single Female/Mother | 187 (22.5%) | 4.72 |
| Non-family | 231 (27.8%) | 1.05 |
| Total Households | 832 (100.0%) | 3.51 |
Household Size by Marriage Status in Winchester
Out of a total of 832 households in Winchester, 601 (72.2%) are family households, while 231 (27.8%) are nonfamily households. The most numerous type of family households are 4-person households, comprising 189, and the most common type of nonfamily households are 1-person households, comprising 219.
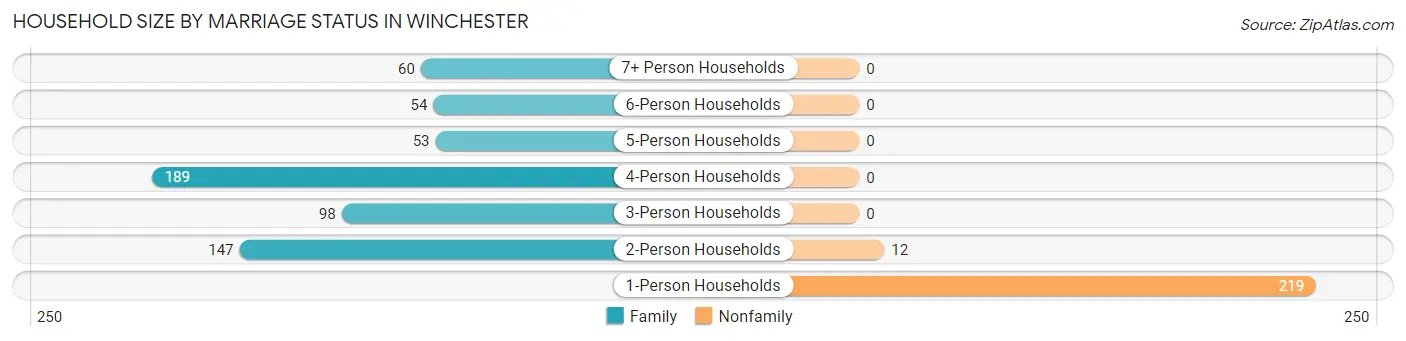
| Household Size | Family Households | Nonfamily Households |
| 1-Person Households | - | 219 (26.3%) |
| 2-Person Households | 147 (17.7%) | 12 (1.4%) |
| 3-Person Households | 98 (11.8%) | 0 (0.0%) |
| 4-Person Households | 189 (22.7%) | 0 (0.0%) |
| 5-Person Households | 53 (6.4%) | 0 (0.0%) |
| 6-Person Households | 54 (6.5%) | 0 (0.0%) |
| 7+ Person Households | 60 (7.2%) | 0 (0.0%) |
| Total | 601 (72.2%) | 231 (27.8%) |
Female Fertility in Winchester
Fertility by Age in Winchester
Average fertility rate in Winchester is 40.0 births per 1,000 women. Women in the age bracket of 20 to 34 years have the highest fertility rate with 82.0 births per 1,000 women. Women in the age bracket of 20 to 34 years acount for 100.0% of all women with births.
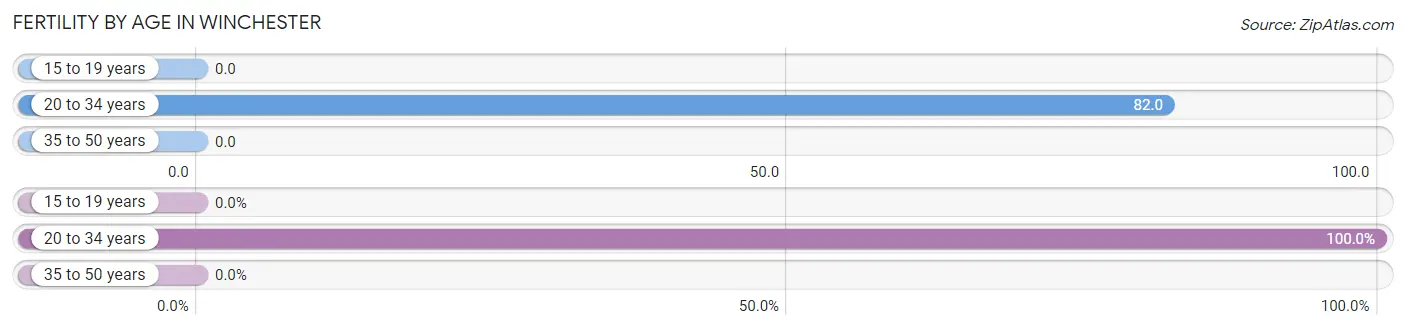
| Age Bracket | Women with Births | Births / 1,000 Women |
| 15 to 19 years | 0 (0.0%) | 0.0 |
| 20 to 34 years | 23 (100.0%) | 82.0 |
| 35 to 50 years | 0 (0.0%) | 0.0 |
| Total | 23 (100.0%) | 40.0 |
Fertility by Age by Marriage Status in Winchester
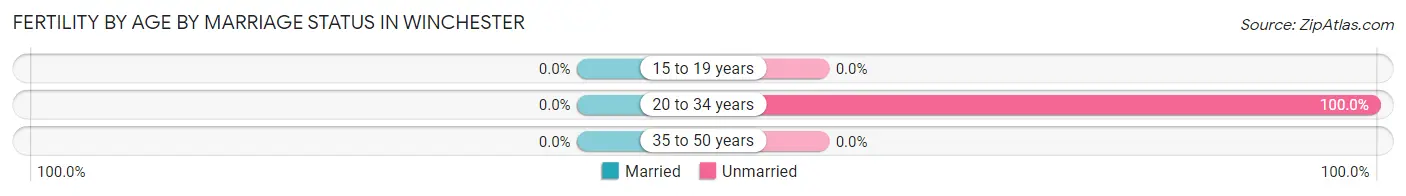
| Age Bracket | Married | Unmarried |
| 15 to 19 years | 0 (0.0%) | 0 (0.0%) |
| 20 to 34 years | 0 (0.0%) | 23 (100.0%) |
| 35 to 50 years | 0 (0.0%) | 0 (0.0%) |
| Total | 0 (0.0%) | 23 (100.0%) |
Fertility by Education in Winchester
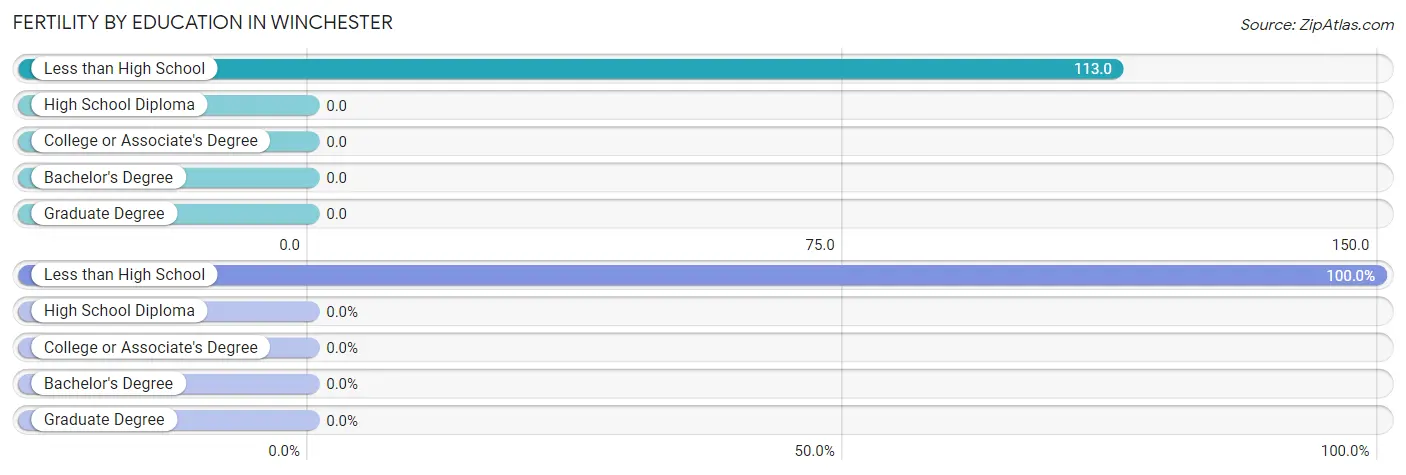
| Educational Attainment | Women with Births | Births / 1,000 Women |
| Less than High School | 23 (100.0%) | 113.0 |
| High School Diploma | 0 (0.0%) | 0.0 |
| College or Associate's Degree | 0 (0.0%) | 0.0 |
| Bachelor's Degree | 0 (0.0%) | 0.0 |
| Graduate Degree | 0 (0.0%) | 0.0 |
| Total | 23 (100.0%) | 40.0 |
Fertility by Education by Marriage Status in Winchester
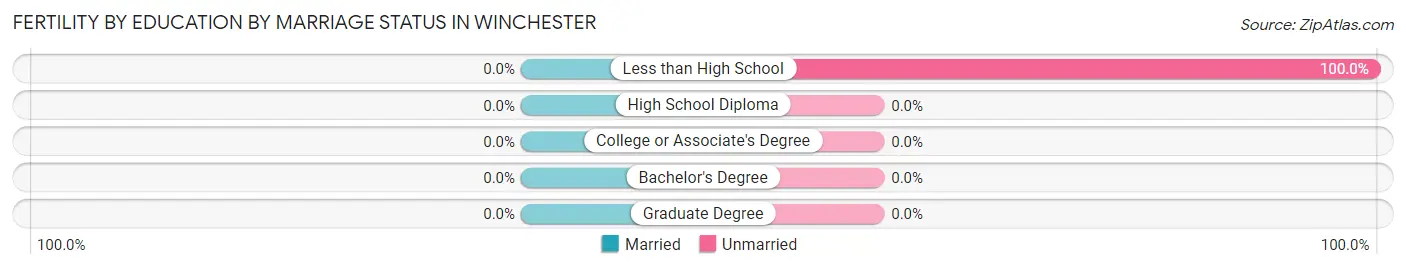
| Educational Attainment | Married | Unmarried |
| Less than High School | 0 (0.0%) | 23 (100.0%) |
| High School Diploma | 0 (0.0%) | 0 (0.0%) |
| College or Associate's Degree | 0 (0.0%) | 0 (0.0%) |
| Bachelor's Degree | 0 (0.0%) | 0 (0.0%) |
| Graduate Degree | 0 (0.0%) | 0 (0.0%) |
| Total | 0 (0.0%) | 23 (100.0%) |
Employment Characteristics in Winchester
Employment by Class of Employer in Winchester
Among the 1,120 employed individuals in Winchester, private company employees (837 | 74.7%), self-employed (not incorporated) (96 | 8.6%), and local government employees (91 | 8.1%) make up the most common classes of employment.
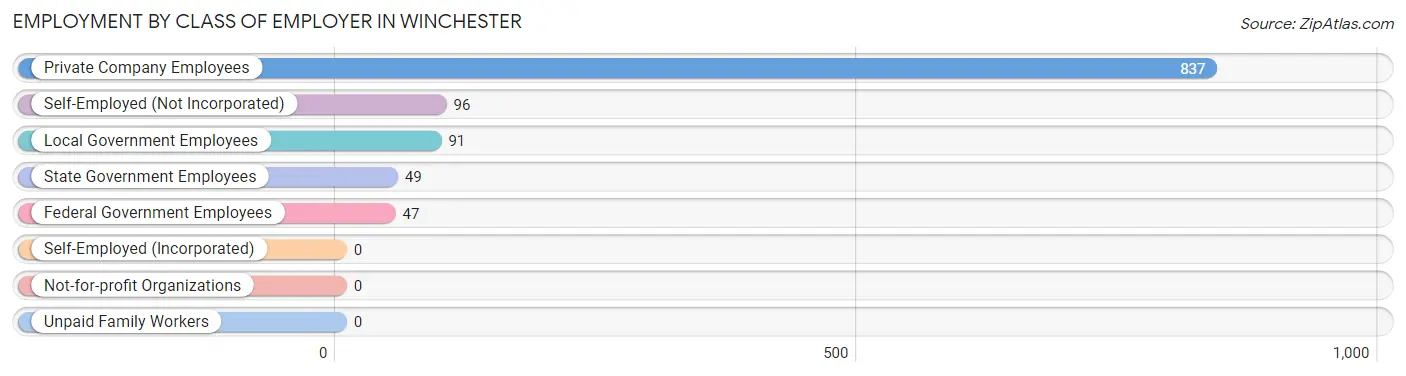
| Employer Class | # Employees | % Employees |
| Private Company Employees | 837 | 74.7% |
| Self-Employed (Incorporated) | 0 | 0.0% |
| Self-Employed (Not Incorporated) | 96 | 8.6% |
| Not-for-profit Organizations | 0 | 0.0% |
| Local Government Employees | 91 | 8.1% |
| State Government Employees | 49 | 4.4% |
| Federal Government Employees | 47 | 4.2% |
| Unpaid Family Workers | 0 | 0.0% |
| Total | 1,120 | 100.0% |
Employment Status by Age in Winchester
According to the labor force statistics for Winchester, out of the total population over 16 years of age (2,541), 47.4% or 1,204 individuals are in the labor force, with 4.1% or 49 of them unemployed. The age group with the highest labor force participation rate is 20 to 24 years, with 79.9% or 215 individuals in the labor force. Within the labor force, the 35 to 44 years age range has the highest percentage of unemployed individuals, with 29.8% or 28 of them being unemployed.
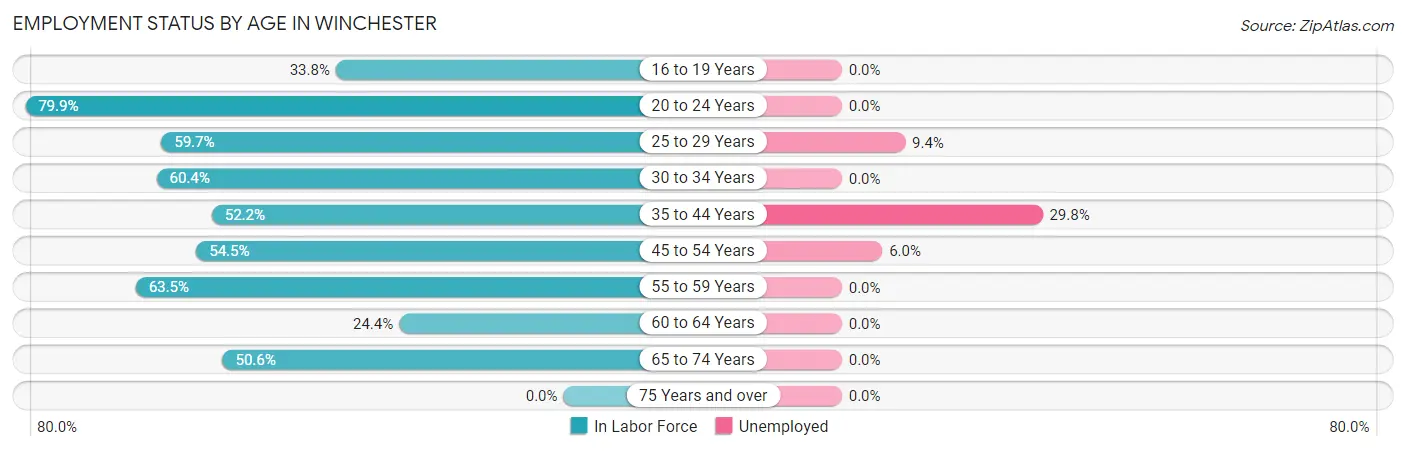
| Age Bracket | In Labor Force | Unemployed |
| 16 to 19 Years | 52 (33.8%) | 0 (0.0%) |
| 20 to 24 Years | 215 (79.9%) | 0 (0.0%) |
| 25 to 29 Years | 148 (59.7%) | 14 (9.4%) |
| 30 to 34 Years | 180 (60.4%) | 0 (0.0%) |
| 35 to 44 Years | 94 (52.2%) | 28 (29.8%) |
| 45 to 54 Years | 134 (54.5%) | 8 (6.0%) |
| 55 to 59 Years | 207 (63.5%) | 0 (0.0%) |
| 60 to 64 Years | 95 (24.4%) | 0 (0.0%) |
| 65 to 74 Years | 80 (50.6%) | 0 (0.0%) |
| 75 Years and over | 0 (0.0%) | 0 (0.0%) |
| Total | 1,204 (47.4%) | 49 (4.1%) |
Employment Status by Educational Attainment in Winchester
According to labor force statistics for Winchester, 50.8% of individuals (858) out of the total population between 25 and 64 years of age (1,688) are in the labor force, with 5.8% or 50 of them being unemployed. The group with the highest labor force participation rate are those with the educational attainment of less than high school, with 64.4% or 299 individuals in the labor force. Within the labor force, individuals with bachelor's degree or higher education have the highest percentage of unemployment, with 26.4% or 14 of them being unemployed.
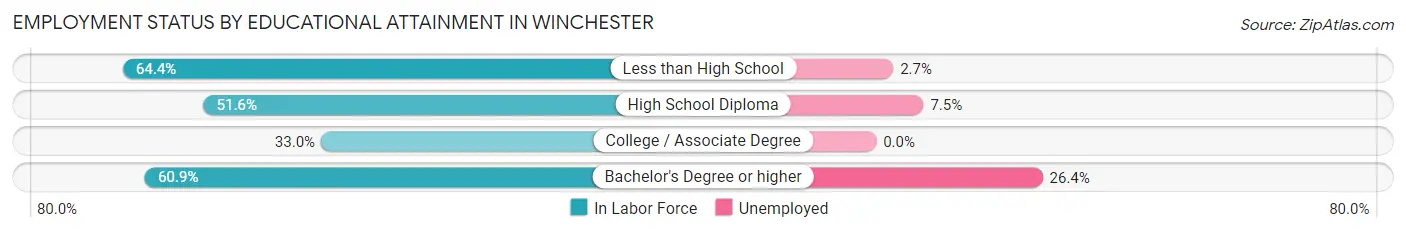
| Educational Attainment | In Labor Force | Unemployed |
| Less than High School | 299 (64.4%) | 13 (2.7%) |
| High School Diploma | 362 (51.6%) | 53 (7.5%) |
| College / Associate Degree | 144 (33.0%) | 0 (0.0%) |
| Bachelor's Degree or higher | 53 (60.9%) | 23 (26.4%) |
| Total | 858 (50.8%) | 98 (5.8%) |
Employment Occupations by Sex in Winchester
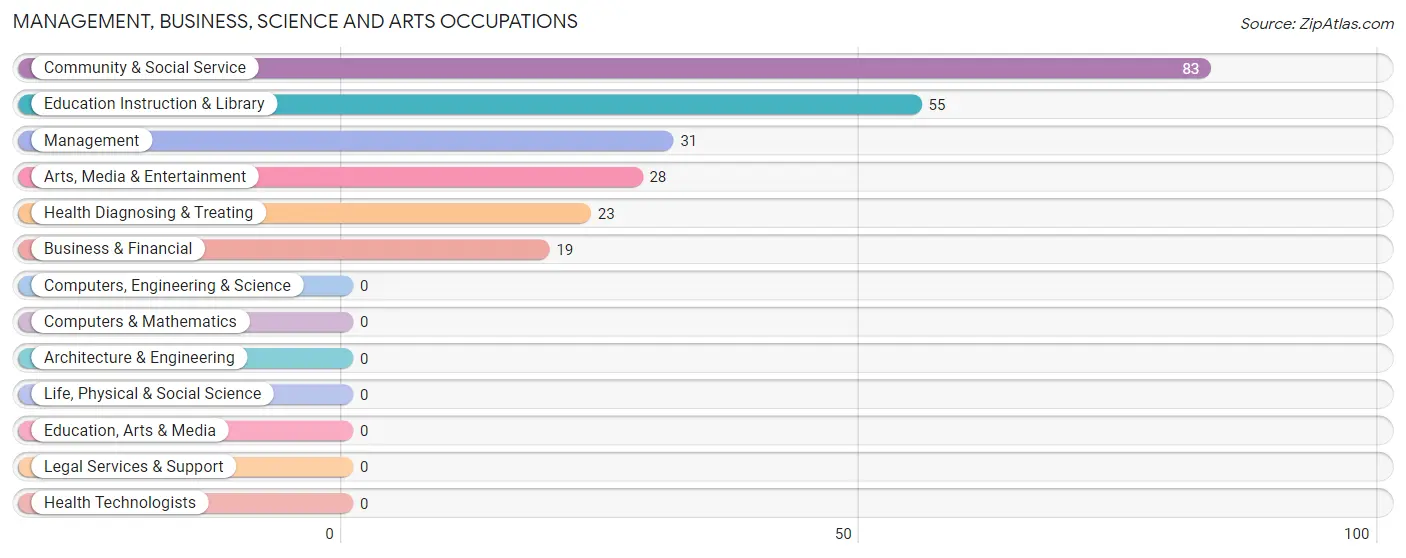
Management, Business, Science and Arts Occupations
The most common Management, Business, Science and Arts occupations in Winchester are Community & Social Service (83 | 7.2%), Education Instruction & Library (55 | 4.8%), Management (31 | 2.7%), Arts, Media & Entertainment (28 | 2.4%), and Health Diagnosing & Treating (23 | 2.0%).
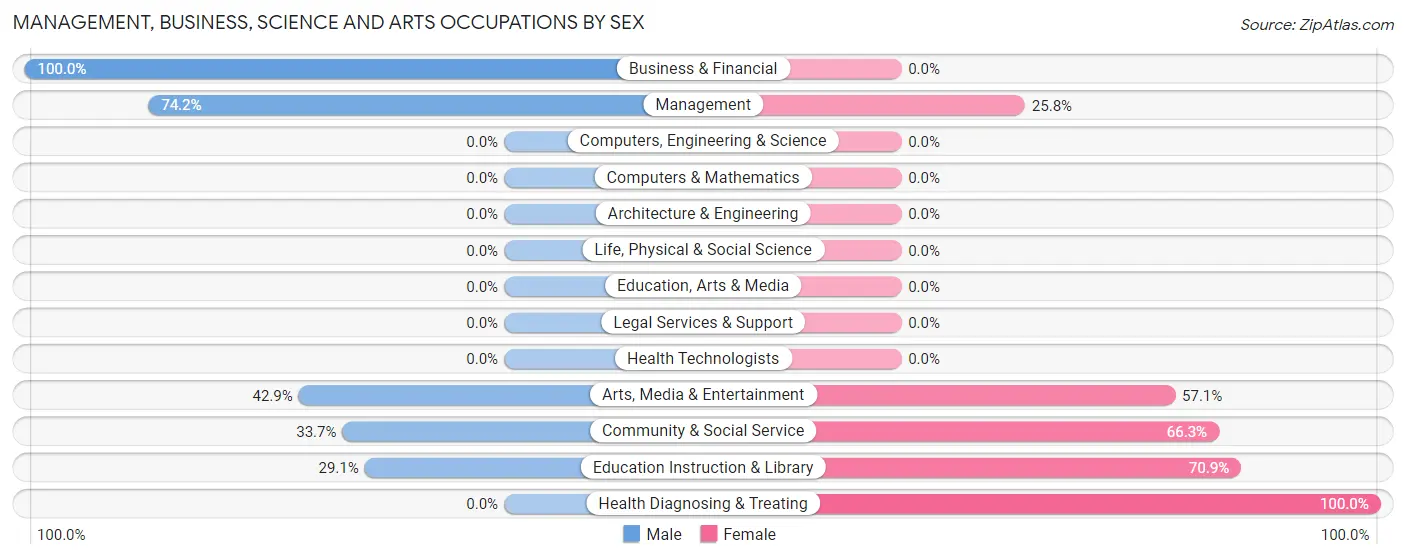
Management, Business, Science and Arts Occupations by Sex
Within the Management, Business, Science and Arts occupations in Winchester, the most male-oriented occupations are Business & Financial (100.0%), Management (74.2%), and Arts, Media & Entertainment (42.9%), while the most female-oriented occupations are Health Diagnosing & Treating (100.0%), Education Instruction & Library (70.9%), and Community & Social Service (66.3%).
| Occupation | Male | Female |
| Management | 23 (74.2%) | 8 (25.8%) |
| Business & Financial | 19 (100.0%) | 0 (0.0%) |
| Computers, Engineering & Science | 0 (0.0%) | 0 (0.0%) |
| Computers & Mathematics | 0 (0.0%) | 0 (0.0%) |
| Architecture & Engineering | 0 (0.0%) | 0 (0.0%) |
| Life, Physical & Social Science | 0 (0.0%) | 0 (0.0%) |
| Community & Social Service | 28 (33.7%) | 55 (66.3%) |
| Education, Arts & Media | 0 (0.0%) | 0 (0.0%) |
| Legal Services & Support | 0 (0.0%) | 0 (0.0%) |
| Education Instruction & Library | 16 (29.1%) | 39 (70.9%) |
| Arts, Media & Entertainment | 12 (42.9%) | 16 (57.1%) |
| Health Diagnosing & Treating | 0 (0.0%) | 23 (100.0%) |
| Health Technologists | 0 (0.0%) | 0 (0.0%) |
| Total (Category) | 70 (44.9%) | 86 (55.1%) |
| Total (Overall) | 791 (69.0%) | 356 (31.0%) |
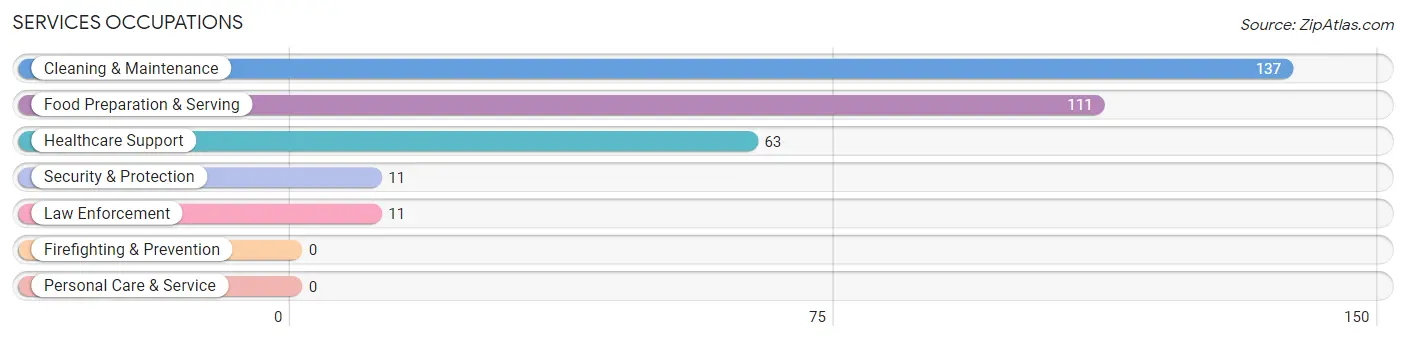
Services Occupations
The most common Services occupations in Winchester are Cleaning & Maintenance (137 | 11.9%), Food Preparation & Serving (111 | 9.7%), Healthcare Support (63 | 5.5%), Security & Protection (11 | 1.0%), and Law Enforcement (11 | 1.0%).
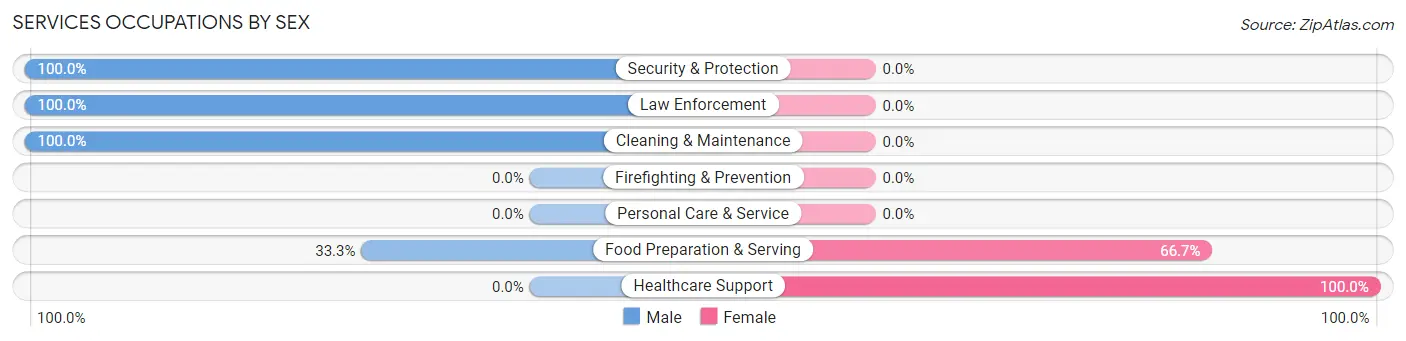
Services Occupations by Sex
Within the Services occupations in Winchester, the most male-oriented occupations are Security & Protection (100.0%), Law Enforcement (100.0%), and Cleaning & Maintenance (100.0%), while the most female-oriented occupations are Healthcare Support (100.0%), and Food Preparation & Serving (66.7%).
| Occupation | Male | Female |
| Healthcare Support | 0 (0.0%) | 63 (100.0%) |
| Security & Protection | 11 (100.0%) | 0 (0.0%) |
| Firefighting & Prevention | 0 (0.0%) | 0 (0.0%) |
| Law Enforcement | 11 (100.0%) | 0 (0.0%) |
| Food Preparation & Serving | 37 (33.3%) | 74 (66.7%) |
| Cleaning & Maintenance | 137 (100.0%) | 0 (0.0%) |
| Personal Care & Service | 0 (0.0%) | 0 (0.0%) |
| Total (Category) | 185 (57.5%) | 137 (42.5%) |
| Total (Overall) | 791 (69.0%) | 356 (31.0%) |
Sales and Office Occupations
The most common Sales and Office occupations in Winchester are Office & Administration (72 | 6.3%), and Sales & Related (65 | 5.7%).
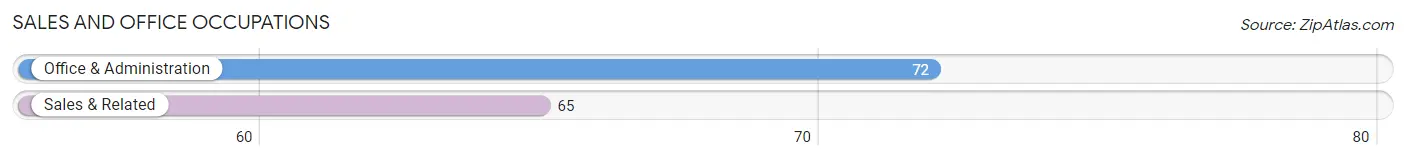
Sales and Office Occupations by Sex
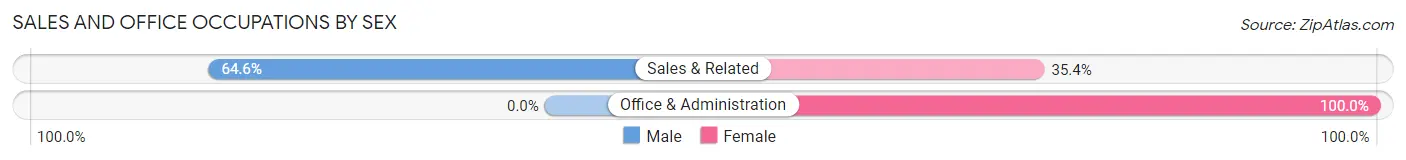
| Occupation | Male | Female |
| Sales & Related | 42 (64.6%) | 23 (35.4%) |
| Office & Administration | 0 (0.0%) | 72 (100.0%) |
| Total (Category) | 42 (30.7%) | 95 (69.3%) |
| Total (Overall) | 791 (69.0%) | 356 (31.0%) |
Natural Resources, Construction and Maintenance Occupations
The most common Natural Resources, Construction and Maintenance occupations in Winchester are Construction & Extraction (82 | 7.1%), and Installation, Maintenance & Repair (61 | 5.3%).
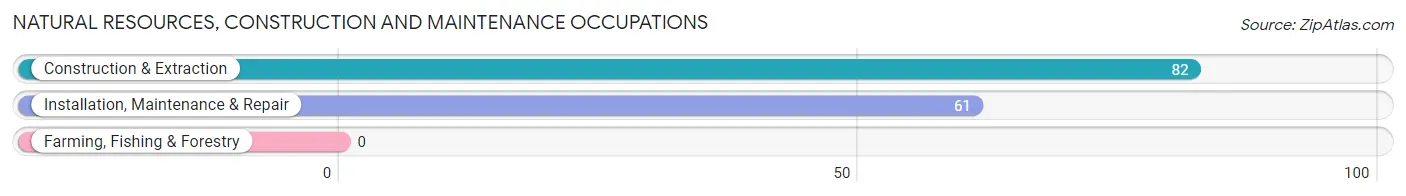
Natural Resources, Construction and Maintenance Occupations by Sex
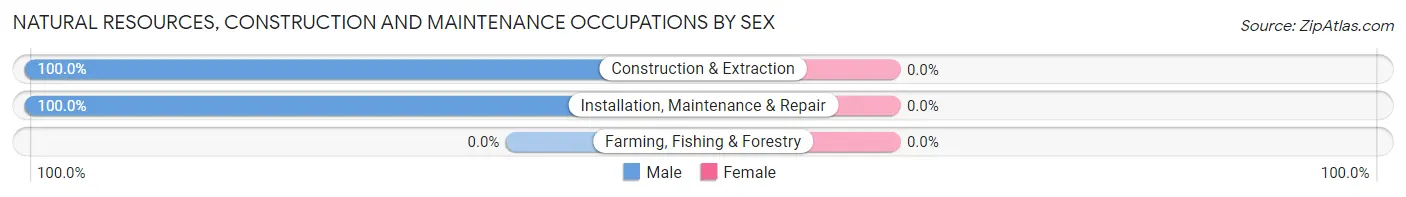
| Occupation | Male | Female |
| Farming, Fishing & Forestry | 0 (0.0%) | 0 (0.0%) |
| Construction & Extraction | 82 (100.0%) | 0 (0.0%) |
| Installation, Maintenance & Repair | 61 (100.0%) | 0 (0.0%) |
| Total (Category) | 143 (100.0%) | 0 (0.0%) |
| Total (Overall) | 791 (69.0%) | 356 (31.0%) |
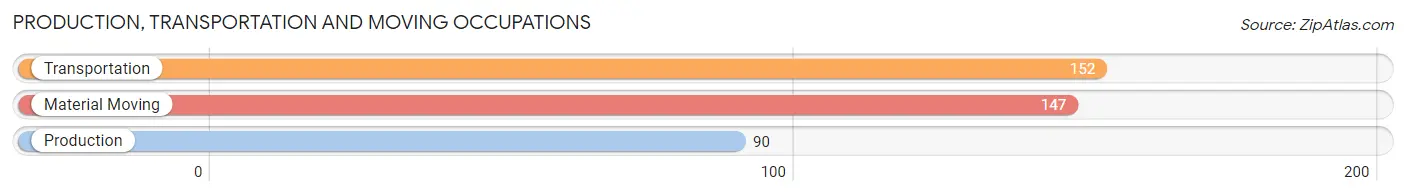
Production, Transportation and Moving Occupations
The most common Production, Transportation and Moving occupations in Winchester are Transportation (152 | 13.3%), Material Moving (147 | 12.8%), and Production (90 | 7.9%).
Production, Transportation and Moving Occupations by Sex
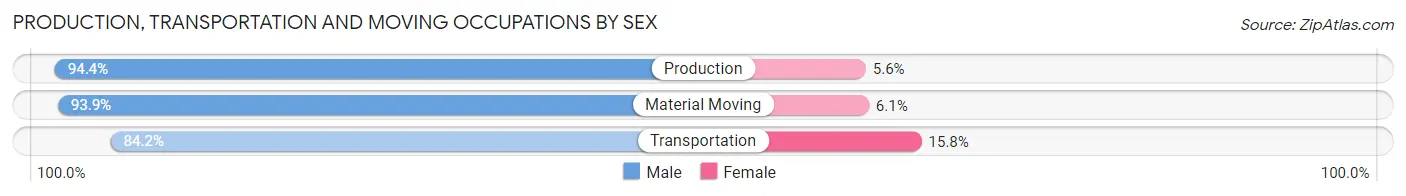
| Occupation | Male | Female |
| Production | 85 (94.4%) | 5 (5.6%) |
| Transportation | 128 (84.2%) | 24 (15.8%) |
| Material Moving | 138 (93.9%) | 9 (6.1%) |
| Total (Category) | 351 (90.2%) | 38 (9.8%) |
| Total (Overall) | 791 (69.0%) | 356 (31.0%) |
Employment Industries by Sex in Winchester
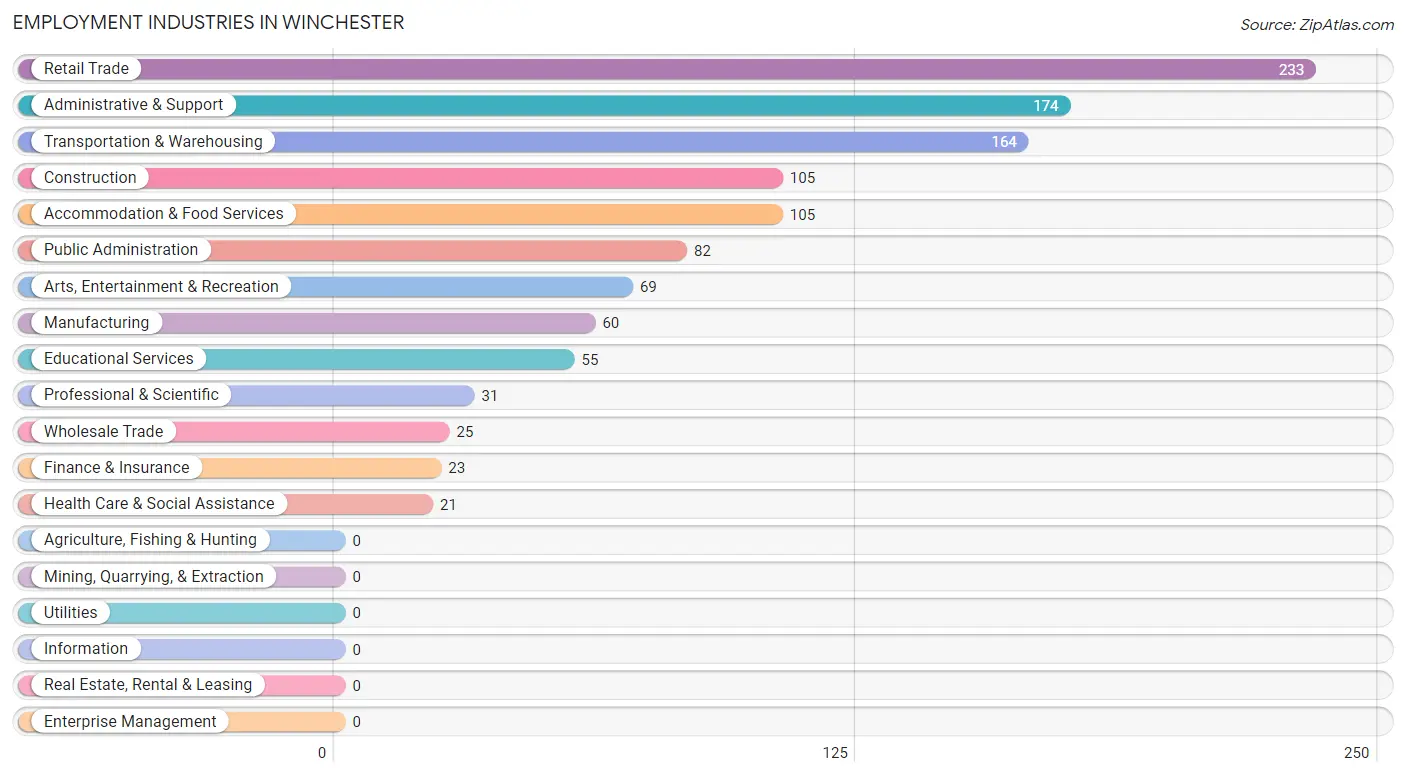
Employment Industries in Winchester
The major employment industries in Winchester include Retail Trade (233 | 20.3%), Administrative & Support (174 | 15.2%), Transportation & Warehousing (164 | 14.3%), Construction (105 | 9.1%), and Accommodation & Food Services (105 | 9.1%).
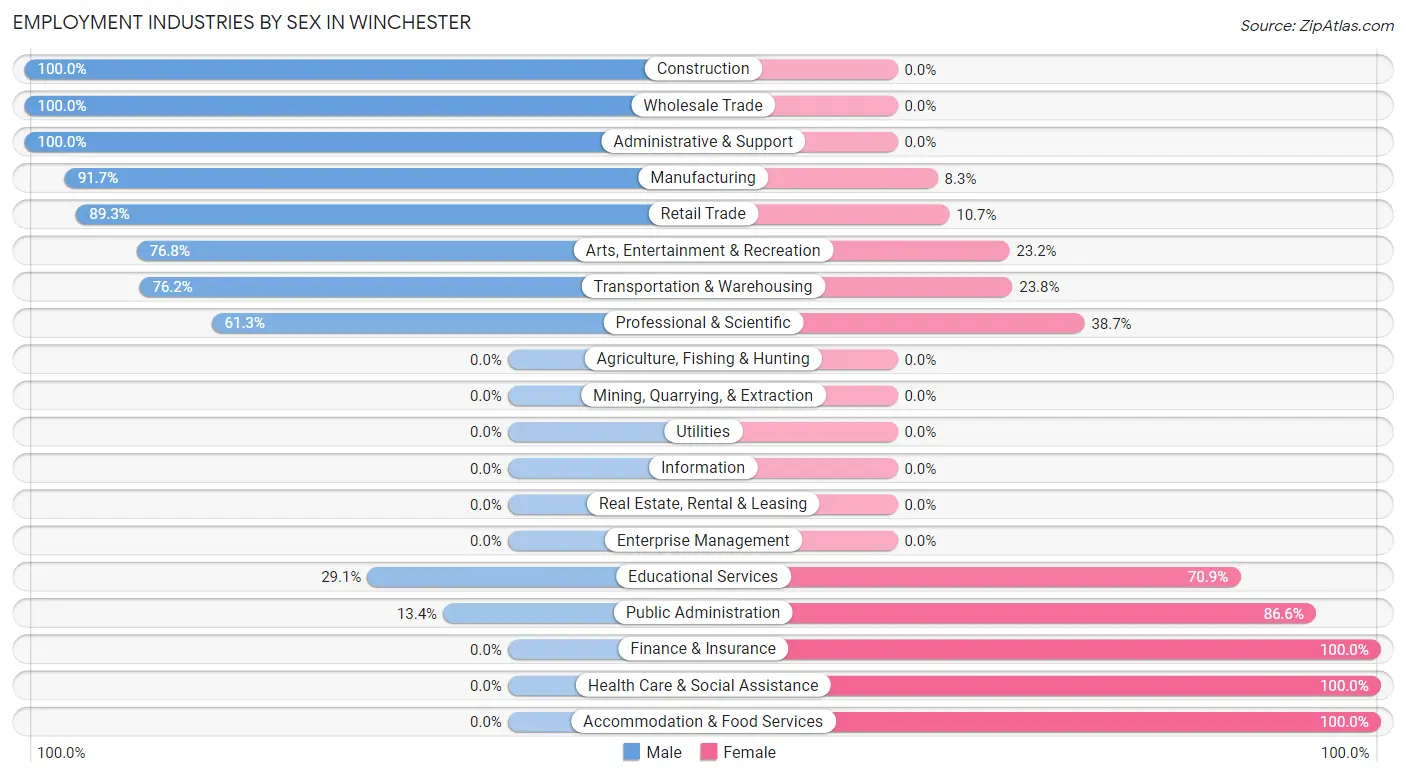
Employment Industries by Sex in Winchester
The Winchester industries that see more men than women are Construction (100.0%), Wholesale Trade (100.0%), and Administrative & Support (100.0%), whereas the industries that tend to have a higher number of women are Finance & Insurance (100.0%), Health Care & Social Assistance (100.0%), and Accommodation & Food Services (100.0%).
| Industry | Male | Female |
| Agriculture, Fishing & Hunting | 0 (0.0%) | 0 (0.0%) |
| Mining, Quarrying, & Extraction | 0 (0.0%) | 0 (0.0%) |
| Construction | 105 (100.0%) | 0 (0.0%) |
| Manufacturing | 55 (91.7%) | 5 (8.3%) |
| Wholesale Trade | 25 (100.0%) | 0 (0.0%) |
| Retail Trade | 208 (89.3%) | 25 (10.7%) |
| Transportation & Warehousing | 125 (76.2%) | 39 (23.8%) |
| Utilities | 0 (0.0%) | 0 (0.0%) |
| Information | 0 (0.0%) | 0 (0.0%) |
| Finance & Insurance | 0 (0.0%) | 23 (100.0%) |
| Real Estate, Rental & Leasing | 0 (0.0%) | 0 (0.0%) |
| Professional & Scientific | 19 (61.3%) | 12 (38.7%) |
| Enterprise Management | 0 (0.0%) | 0 (0.0%) |
| Administrative & Support | 174 (100.0%) | 0 (0.0%) |
| Educational Services | 16 (29.1%) | 39 (70.9%) |
| Health Care & Social Assistance | 0 (0.0%) | 21 (100.0%) |
| Arts, Entertainment & Recreation | 53 (76.8%) | 16 (23.2%) |
| Accommodation & Food Services | 0 (0.0%) | 105 (100.0%) |
| Public Administration | 11 (13.4%) | 71 (86.6%) |
| Total | 791 (69.0%) | 356 (31.0%) |
Education in Winchester
School Enrollment in Winchester
The most common levels of schooling among the 513 students in Winchester are high school (157 | 30.6%), college / undergraduate (141 | 27.5%), and elementary school (98 | 19.1%).
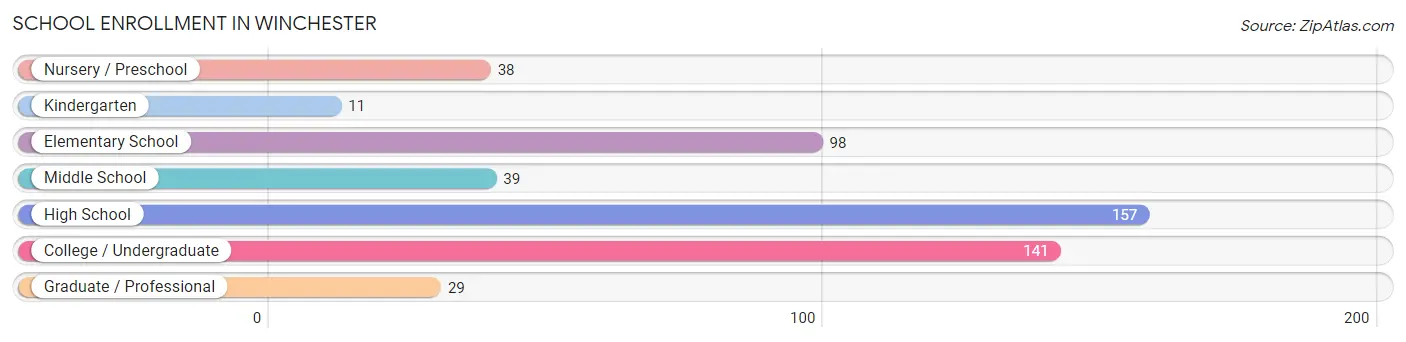
| School Level | # Students | % Students |
| Nursery / Preschool | 38 | 7.4% |
| Kindergarten | 11 | 2.1% |
| Elementary School | 98 | 19.1% |
| Middle School | 39 | 7.6% |
| High School | 157 | 30.6% |
| College / Undergraduate | 141 | 27.5% |
| Graduate / Professional | 29 | 5.7% |
| Total | 513 | 100.0% |
School Enrollment by Age by Funding Source in Winchester
Out of a total of 513 students who are enrolled in schools in Winchester, 70 (13.6%) attend a private institution, while the remaining 443 (86.4%) are enrolled in public schools. The age group of 18 to 19 year olds has the highest likelihood of being enrolled in private schools, with 7 (100.0% in the age bracket) enrolled. Conversely, the age group of 3 to 4 year olds has the lowest likelihood of being enrolled in a private school, with 22 (100.0% in the age bracket) attending a public institution.
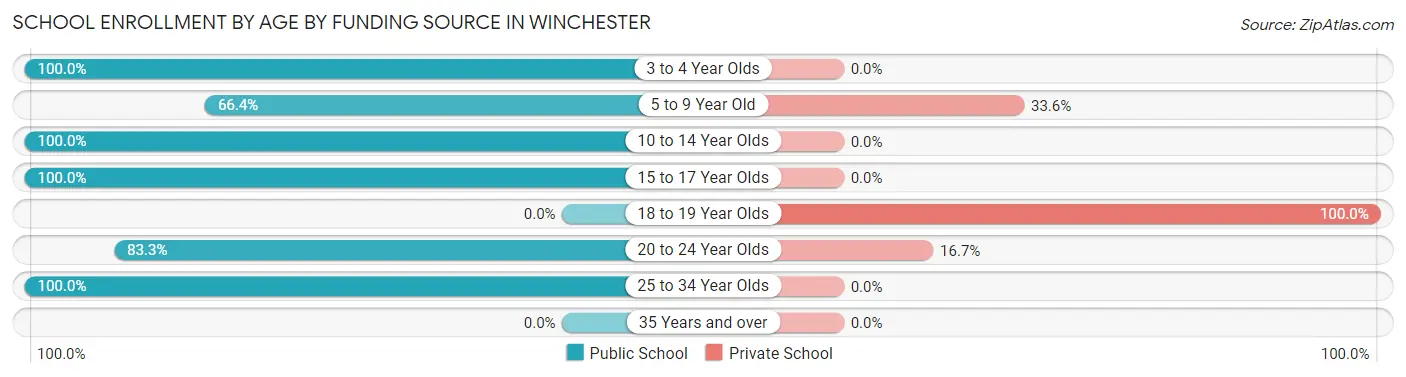
| Age Bracket | Public School | Private School |
| 3 to 4 Year Olds | 22 (100.0%) | 0 (0.0%) |
| 5 to 9 Year Old | 83 (66.4%) | 42 (33.6%) |
| 10 to 14 Year Olds | 39 (100.0%) | 0 (0.0%) |
| 15 to 17 Year Olds | 163 (100.0%) | 0 (0.0%) |
| 18 to 19 Year Olds | 0 (0.0%) | 7 (100.0%) |
| 20 to 24 Year Olds | 105 (83.3%) | 21 (16.7%) |
| 25 to 34 Year Olds | 31 (100.0%) | 0 (0.0%) |
| 35 Years and over | 0 (0.0%) | 0 (0.0%) |
| Total | 443 (86.4%) | 70 (13.6%) |
Educational Attainment by Field of Study in Winchester
Bio, nature & agricultural (51 | 37.0%), psychology (23 | 16.7%), social sciences (16 | 11.6%), visual & performing arts (14 | 10.1%), and engineering (12 | 8.7%) are the most common fields of study among 138 individuals in Winchester who have obtained a bachelor's degree or higher.
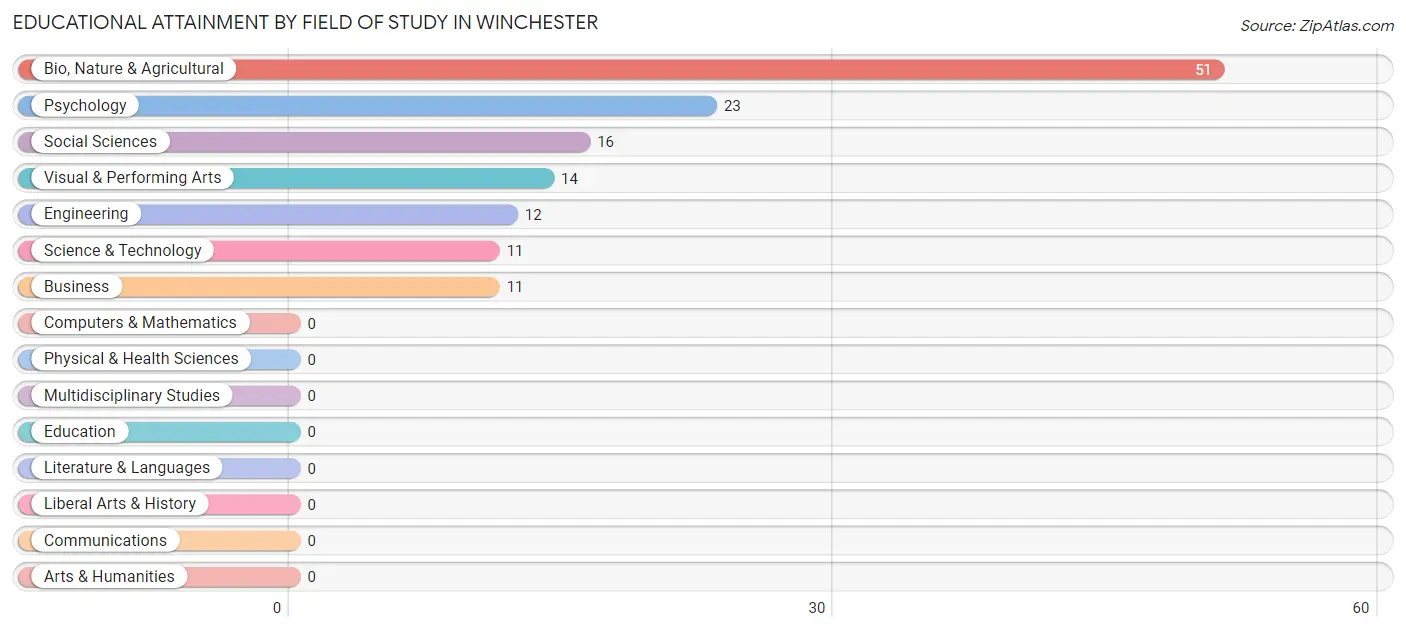
| Field of Study | # Graduates | % Graduates |
| Computers & Mathematics | 0 | 0.0% |
| Bio, Nature & Agricultural | 51 | 37.0% |
| Physical & Health Sciences | 0 | 0.0% |
| Psychology | 23 | 16.7% |
| Social Sciences | 16 | 11.6% |
| Engineering | 12 | 8.7% |
| Multidisciplinary Studies | 0 | 0.0% |
| Science & Technology | 11 | 8.0% |
| Business | 11 | 8.0% |
| Education | 0 | 0.0% |
| Literature & Languages | 0 | 0.0% |
| Liberal Arts & History | 0 | 0.0% |
| Visual & Performing Arts | 14 | 10.1% |
| Communications | 0 | 0.0% |
| Arts & Humanities | 0 | 0.0% |
| Total | 138 | 100.0% |
Transportation & Commute in Winchester
Vehicle Availability by Sex in Winchester
The most prevalent vehicle ownership categories in Winchester are males with 2 vehicles (256, accounting for 32.0%) and females with 2 vehicles (76, making up 80.0%).
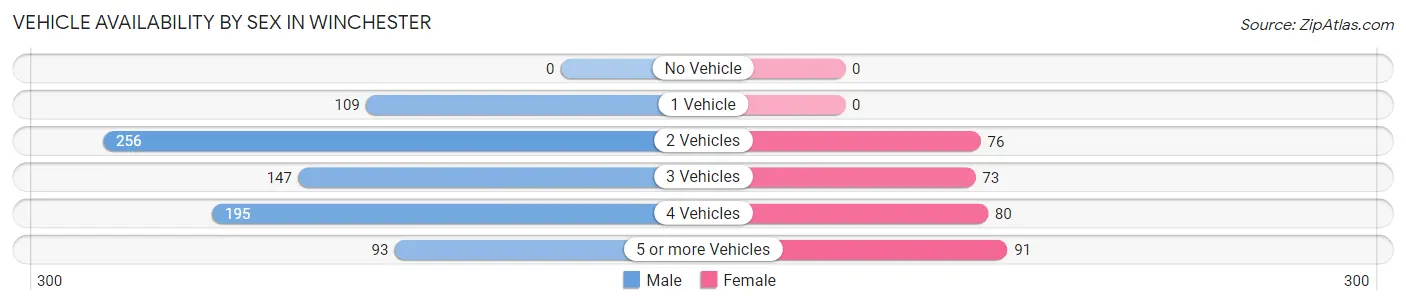
| Vehicles Available | Male | Female |
| No Vehicle | 0 (0.0%) | 0 (0.0%) |
| 1 Vehicle | 109 (13.6%) | 0 (0.0%) |
| 2 Vehicles | 256 (32.0%) | 76 (23.7%) |
| 3 Vehicles | 147 (18.4%) | 73 (22.8%) |
| 4 Vehicles | 195 (24.4%) | 80 (25.0%) |
| 5 or more Vehicles | 93 (11.6%) | 91 (28.4%) |
| Total | 800 (100.0%) | 320 (100.0%) |
Commute Time in Winchester
The most frequently occuring commute durations in Winchester are 30 to 34 minutes (296 commuters, 28.6%), 15 to 19 minutes (250 commuters, 24.2%), and 45 to 59 minutes (171 commuters, 16.6%).
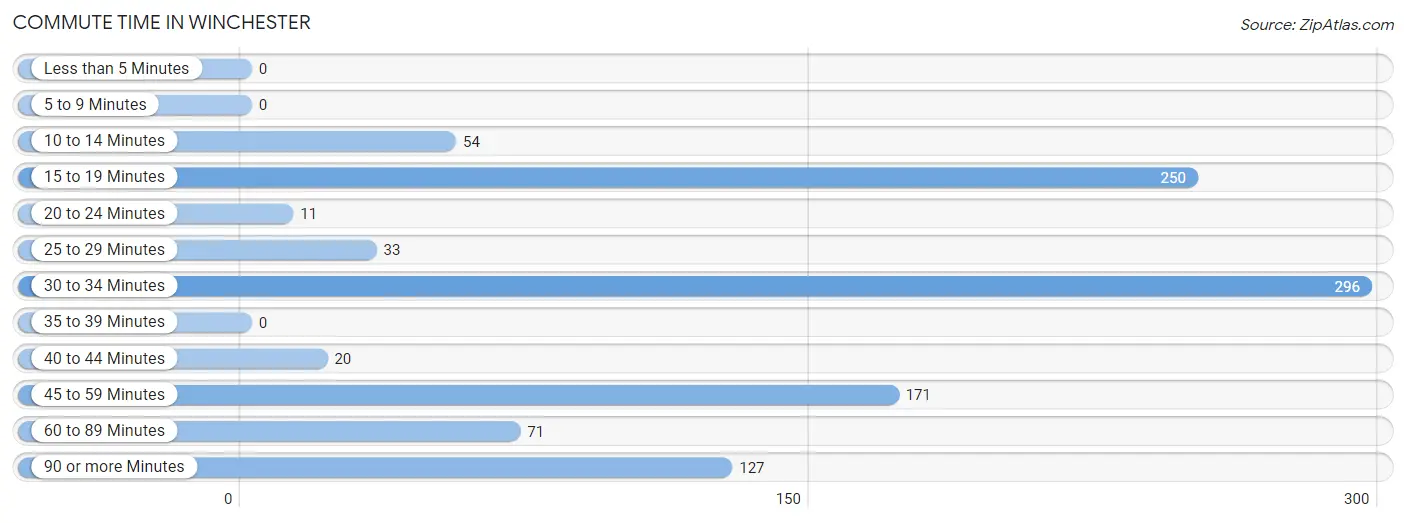
| Commute Time | # Commuters | % Commuters |
| Less than 5 Minutes | 0 | 0.0% |
| 5 to 9 Minutes | 0 | 0.0% |
| 10 to 14 Minutes | 54 | 5.2% |
| 15 to 19 Minutes | 250 | 24.2% |
| 20 to 24 Minutes | 11 | 1.1% |
| 25 to 29 Minutes | 33 | 3.2% |
| 30 to 34 Minutes | 296 | 28.6% |
| 35 to 39 Minutes | 0 | 0.0% |
| 40 to 44 Minutes | 20 | 1.9% |
| 45 to 59 Minutes | 171 | 16.6% |
| 60 to 89 Minutes | 71 | 6.9% |
| 90 or more Minutes | 127 | 12.3% |
Commute Time by Sex in Winchester
The most common commute times in Winchester are 30 to 34 minutes (291 commuters, 40.3%) for males and 15 to 19 minutes (164 commuters, 52.9%) for females.
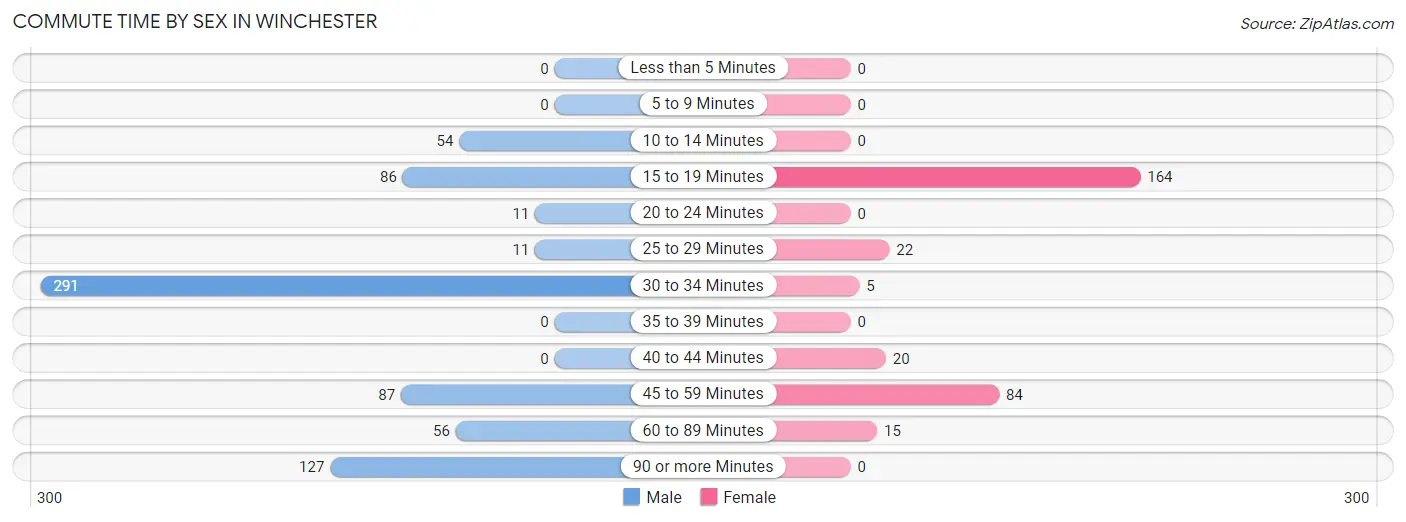
| Commute Time | Male | Female |
| Less than 5 Minutes | 0 (0.0%) | 0 (0.0%) |
| 5 to 9 Minutes | 0 (0.0%) | 0 (0.0%) |
| 10 to 14 Minutes | 54 (7.5%) | 0 (0.0%) |
| 15 to 19 Minutes | 86 (11.9%) | 164 (52.9%) |
| 20 to 24 Minutes | 11 (1.5%) | 0 (0.0%) |
| 25 to 29 Minutes | 11 (1.5%) | 22 (7.1%) |
| 30 to 34 Minutes | 291 (40.3%) | 5 (1.6%) |
| 35 to 39 Minutes | 0 (0.0%) | 0 (0.0%) |
| 40 to 44 Minutes | 0 (0.0%) | 20 (6.5%) |
| 45 to 59 Minutes | 87 (12.0%) | 84 (27.1%) |
| 60 to 89 Minutes | 56 (7.7%) | 15 (4.8%) |
| 90 or more Minutes | 127 (17.6%) | 0 (0.0%) |
Time of Departure to Work by Sex in Winchester
The most frequent times of departure to work in Winchester are 6:00 AM to 6:29 AM (269, 37.2%) for males and 12:00 AM to 4:59 AM (79, 25.5%) for females.
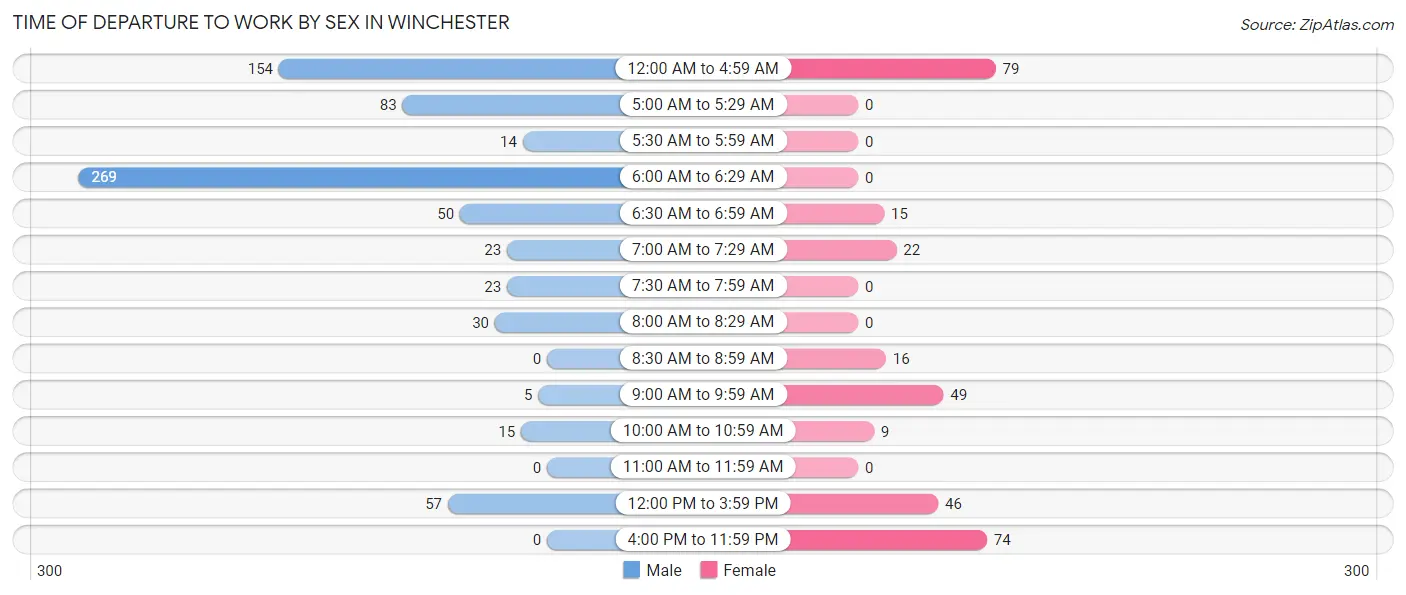
| Time of Departure | Male | Female |
| 12:00 AM to 4:59 AM | 154 (21.3%) | 79 (25.5%) |
| 5:00 AM to 5:29 AM | 83 (11.5%) | 0 (0.0%) |
| 5:30 AM to 5:59 AM | 14 (1.9%) | 0 (0.0%) |
| 6:00 AM to 6:29 AM | 269 (37.2%) | 0 (0.0%) |
| 6:30 AM to 6:59 AM | 50 (6.9%) | 15 (4.8%) |
| 7:00 AM to 7:29 AM | 23 (3.2%) | 22 (7.1%) |
| 7:30 AM to 7:59 AM | 23 (3.2%) | 0 (0.0%) |
| 8:00 AM to 8:29 AM | 30 (4.2%) | 0 (0.0%) |
| 8:30 AM to 8:59 AM | 0 (0.0%) | 16 (5.2%) |
| 9:00 AM to 9:59 AM | 5 (0.7%) | 49 (15.8%) |
| 10:00 AM to 10:59 AM | 15 (2.1%) | 9 (2.9%) |
| 11:00 AM to 11:59 AM | 0 (0.0%) | 0 (0.0%) |
| 12:00 PM to 3:59 PM | 57 (7.9%) | 46 (14.8%) |
| 4:00 PM to 11:59 PM | 0 (0.0%) | 74 (23.9%) |
| Total | 723 (100.0%) | 310 (100.0%) |
Housing Occupancy in Winchester
Occupancy by Ownership in Winchester
Of the total 832 dwellings in Winchester, owner-occupied units account for 743 (89.3%), while renter-occupied units make up 89 (10.7%).
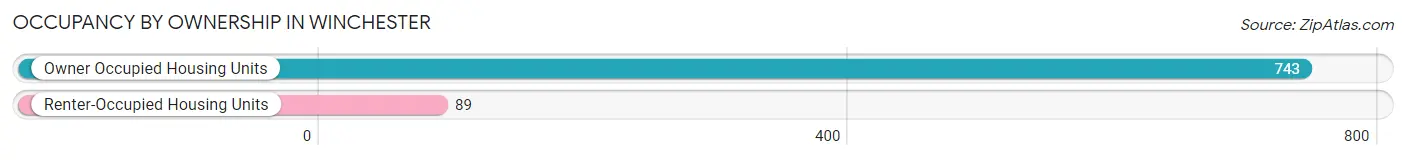
| Occupancy | # Housing Units | % Housing Units |
| Owner Occupied Housing Units | 743 | 89.3% |
| Renter-Occupied Housing Units | 89 | 10.7% |
| Total Occupied Housing Units | 832 | 100.0% |
Occupancy by Household Size in Winchester
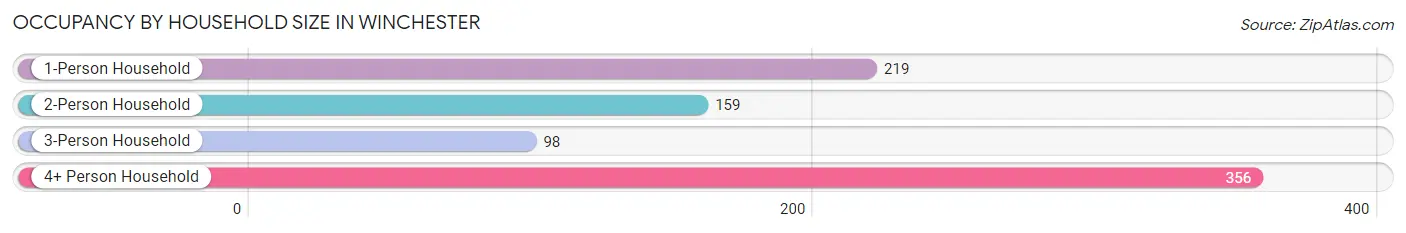
| Household Size | # Housing Units | % Housing Units |
| 1-Person Household | 219 | 26.3% |
| 2-Person Household | 159 | 19.1% |
| 3-Person Household | 98 | 11.8% |
| 4+ Person Household | 356 | 42.8% |
| Total Housing Units | 832 | 100.0% |
Occupancy by Ownership by Household Size in Winchester
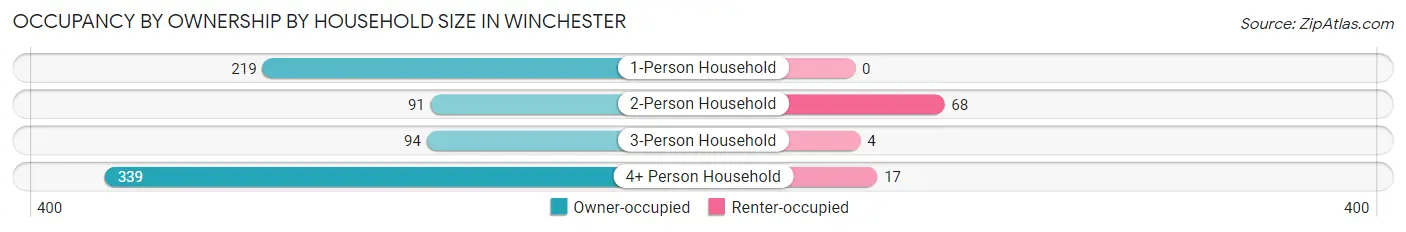
| Household Size | Owner-occupied | Renter-occupied |
| 1-Person Household | 219 (100.0%) | 0 (0.0%) |
| 2-Person Household | 91 (57.2%) | 68 (42.8%) |
| 3-Person Household | 94 (95.9%) | 4 (4.1%) |
| 4+ Person Household | 339 (95.2%) | 17 (4.8%) |
| Total Housing Units | 743 (89.3%) | 89 (10.7%) |
Occupancy by Educational Attainment in Winchester
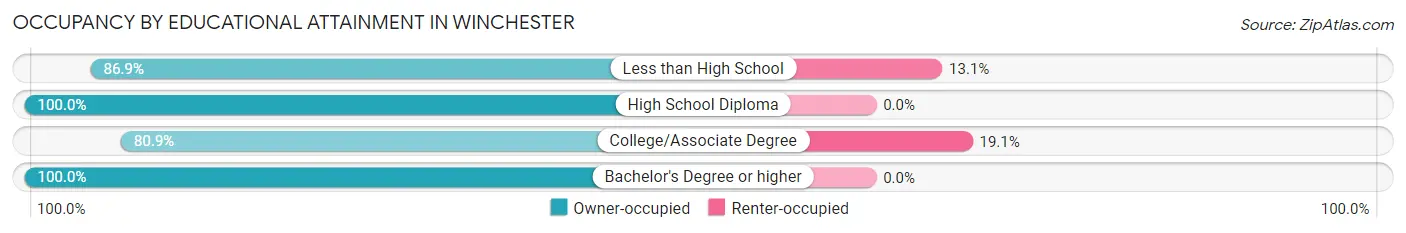
| Household Size | Owner-occupied | Renter-occupied |
| Less than High School | 113 (86.9%) | 17 (13.1%) |
| High School Diploma | 297 (100.0%) | 0 (0.0%) |
| College/Associate Degree | 305 (80.9%) | 72 (19.1%) |
| Bachelor's Degree or higher | 28 (100.0%) | 0 (0.0%) |
Occupancy by Age of Householder in Winchester
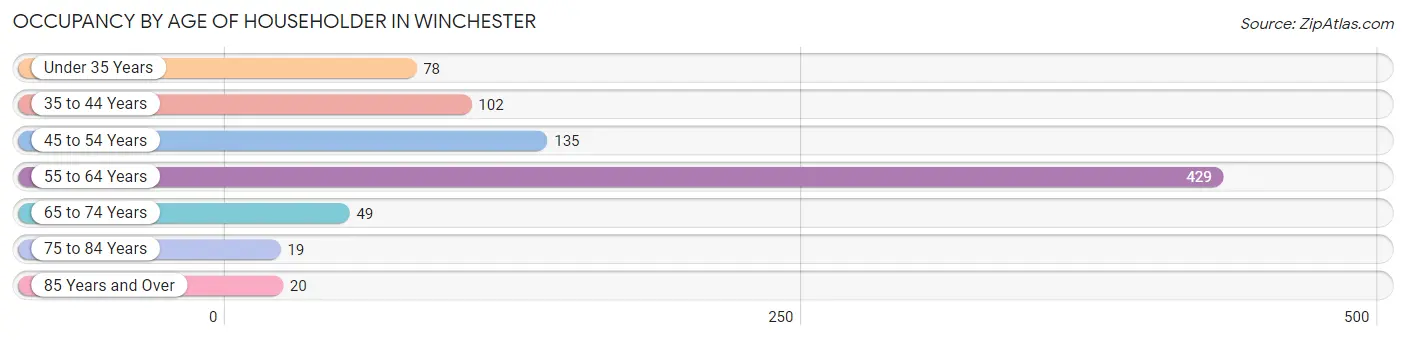
| Age Bracket | # Households | % Households |
| Under 35 Years | 78 | 9.4% |
| 35 to 44 Years | 102 | 12.3% |
| 45 to 54 Years | 135 | 16.2% |
| 55 to 64 Years | 429 | 51.6% |
| 65 to 74 Years | 49 | 5.9% |
| 75 to 84 Years | 19 | 2.3% |
| 85 Years and Over | 20 | 2.4% |
| Total | 832 | 100.0% |
Housing Finances in Winchester
Median Income by Occupancy in Winchester
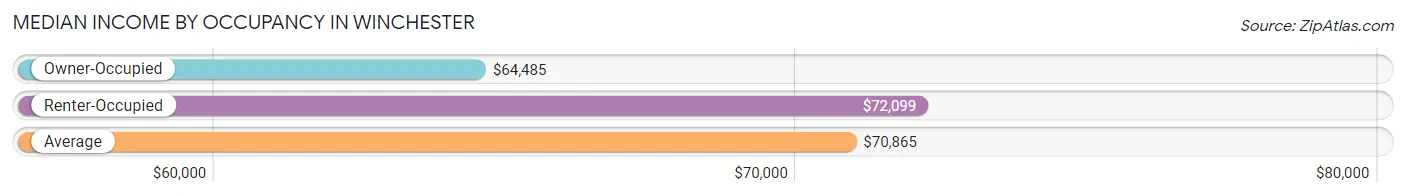
| Occupancy Type | # Households | Median Income |
| Owner-Occupied | 743 (89.3%) | $64,485 |
| Renter-Occupied | 89 (10.7%) | $72,099 |
| Average | 832 (100.0%) | $70,865 |
Occupancy by Householder Income Bracket in Winchester
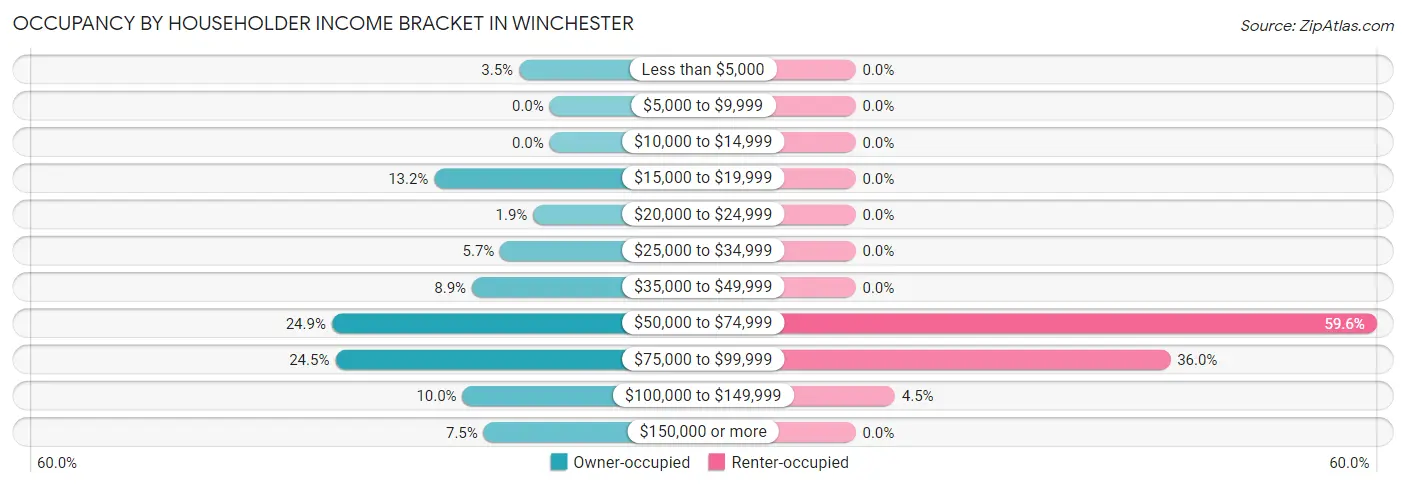
| Income Bracket | Owner-occupied | Renter-occupied |
| Less than $5,000 | 26 (3.5%) | 0 (0.0%) |
| $5,000 to $9,999 | 0 (0.0%) | 0 (0.0%) |
| $10,000 to $14,999 | 0 (0.0%) | 0 (0.0%) |
| $15,000 to $19,999 | 98 (13.2%) | 0 (0.0%) |
| $20,000 to $24,999 | 14 (1.9%) | 0 (0.0%) |
| $25,000 to $34,999 | 42 (5.7%) | 0 (0.0%) |
| $35,000 to $49,999 | 66 (8.9%) | 0 (0.0%) |
| $50,000 to $74,999 | 185 (24.9%) | 53 (59.6%) |
| $75,000 to $99,999 | 182 (24.5%) | 32 (36.0%) |
| $100,000 to $149,999 | 74 (10.0%) | 4 (4.5%) |
| $150,000 or more | 56 (7.5%) | 0 (0.0%) |
| Total | 743 (100.0%) | 89 (100.0%) |
Monthly Housing Cost Tiers in Winchester
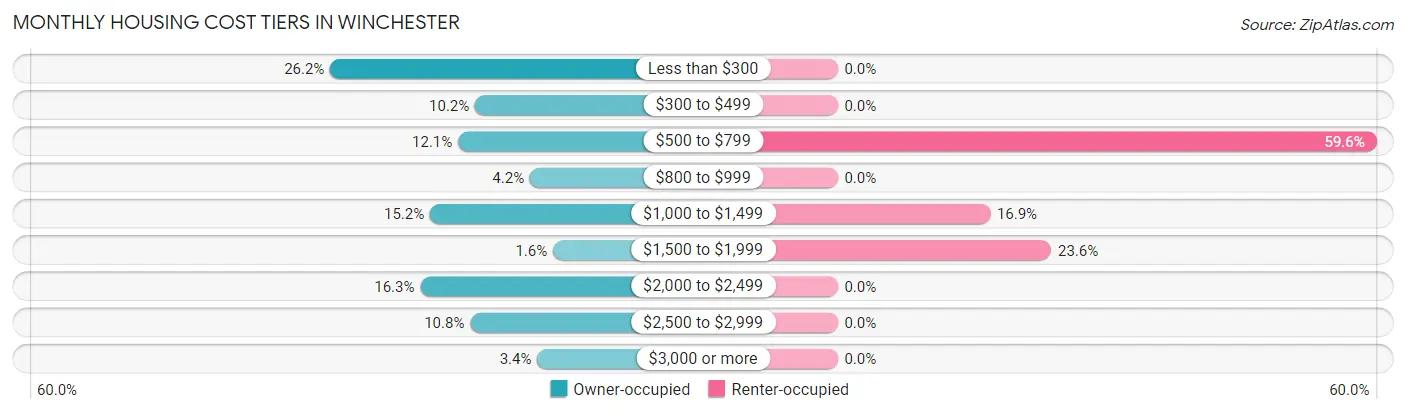
| Monthly Cost | Owner-occupied | Renter-occupied |
| Less than $300 | 195 (26.2%) | 0 (0.0%) |
| $300 to $499 | 76 (10.2%) | 0 (0.0%) |
| $500 to $799 | 90 (12.1%) | 53 (59.6%) |
| $800 to $999 | 31 (4.2%) | 0 (0.0%) |
| $1,000 to $1,499 | 113 (15.2%) | 15 (16.9%) |
| $1,500 to $1,999 | 12 (1.6%) | 21 (23.6%) |
| $2,000 to $2,499 | 121 (16.3%) | 0 (0.0%) |
| $2,500 to $2,999 | 80 (10.8%) | 0 (0.0%) |
| $3,000 or more | 25 (3.4%) | 0 (0.0%) |
| Total | 743 (100.0%) | 89 (100.0%) |
Physical Housing Characteristics in Winchester
Housing Structures in Winchester
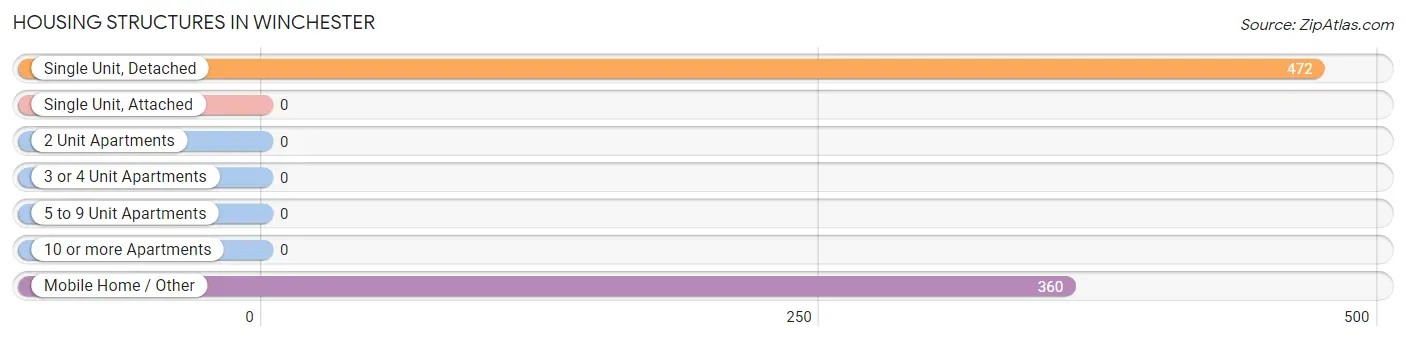
| Structure Type | # Housing Units | % Housing Units |
| Single Unit, Detached | 472 | 56.7% |
| Single Unit, Attached | 0 | 0.0% |
| 2 Unit Apartments | 0 | 0.0% |
| 3 or 4 Unit Apartments | 0 | 0.0% |
| 5 to 9 Unit Apartments | 0 | 0.0% |
| 10 or more Apartments | 0 | 0.0% |
| Mobile Home / Other | 360 | 43.3% |
| Total | 832 | 100.0% |
Housing Structures by Occupancy in Winchester
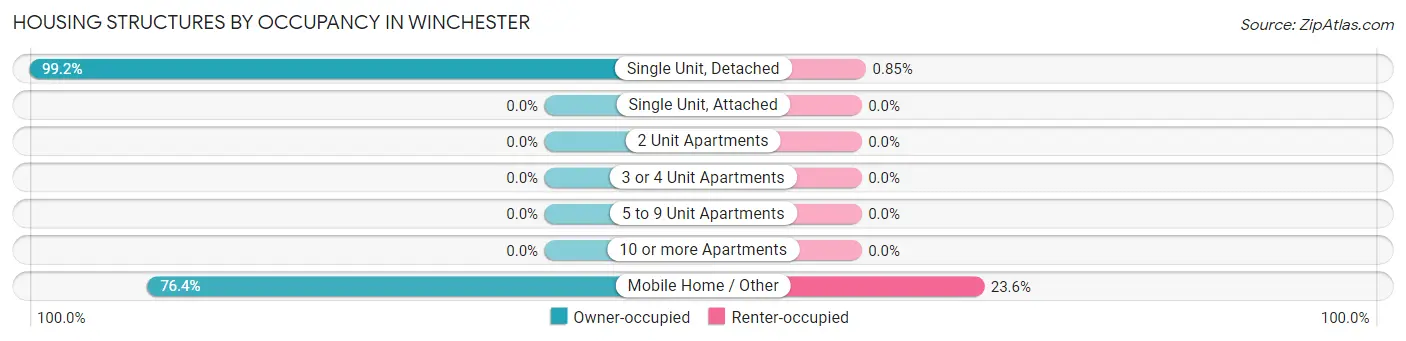
| Structure Type | Owner-occupied | Renter-occupied |
| Single Unit, Detached | 468 (99.2%) | 4 (0.9%) |
| Single Unit, Attached | 0 (0.0%) | 0 (0.0%) |
| 2 Unit Apartments | 0 (0.0%) | 0 (0.0%) |
| 3 or 4 Unit Apartments | 0 (0.0%) | 0 (0.0%) |
| 5 to 9 Unit Apartments | 0 (0.0%) | 0 (0.0%) |
| 10 or more Apartments | 0 (0.0%) | 0 (0.0%) |
| Mobile Home / Other | 275 (76.4%) | 85 (23.6%) |
| Total | 743 (89.3%) | 89 (10.7%) |
Housing Structures by Number of Rooms in Winchester
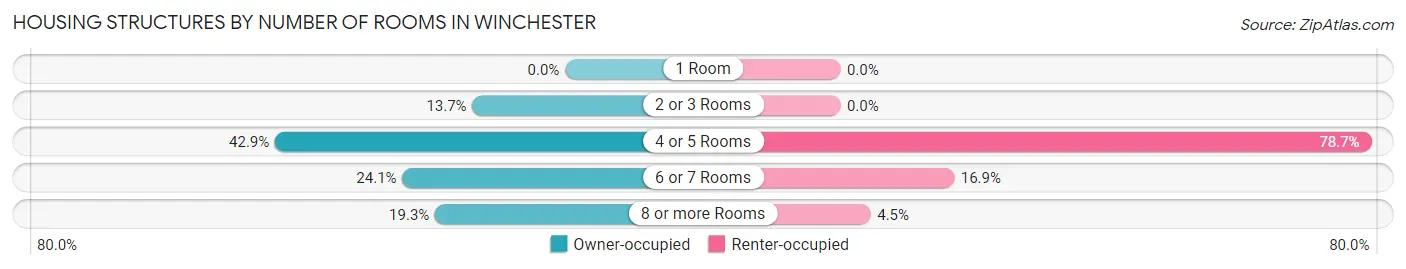
| Number of Rooms | Owner-occupied | Renter-occupied |
| 1 Room | 0 (0.0%) | 0 (0.0%) |
| 2 or 3 Rooms | 102 (13.7%) | 0 (0.0%) |
| 4 or 5 Rooms | 319 (42.9%) | 70 (78.6%) |
| 6 or 7 Rooms | 179 (24.1%) | 15 (16.9%) |
| 8 or more Rooms | 143 (19.3%) | 4 (4.5%) |
| Total | 743 (100.0%) | 89 (100.0%) |
Housing Structure by Heating Type in Winchester
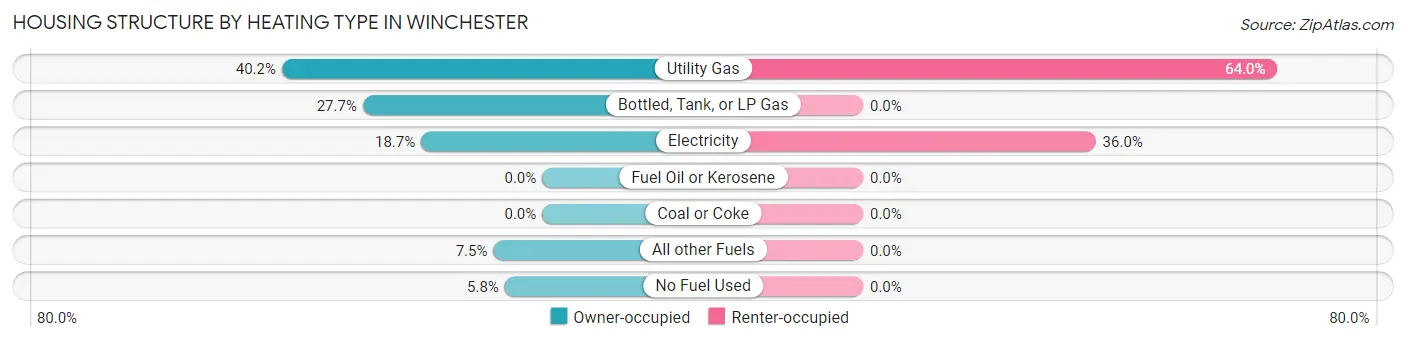
| Heating Type | Owner-occupied | Renter-occupied |
| Utility Gas | 299 (40.2%) | 57 (64.0%) |
| Bottled, Tank, or LP Gas | 206 (27.7%) | 0 (0.0%) |
| Electricity | 139 (18.7%) | 32 (36.0%) |
| Fuel Oil or Kerosene | 0 (0.0%) | 0 (0.0%) |
| Coal or Coke | 0 (0.0%) | 0 (0.0%) |
| All other Fuels | 56 (7.5%) | 0 (0.0%) |
| No Fuel Used | 43 (5.8%) | 0 (0.0%) |
| Total | 743 (100.0%) | 89 (100.0%) |
Household Vehicle Usage in Winchester
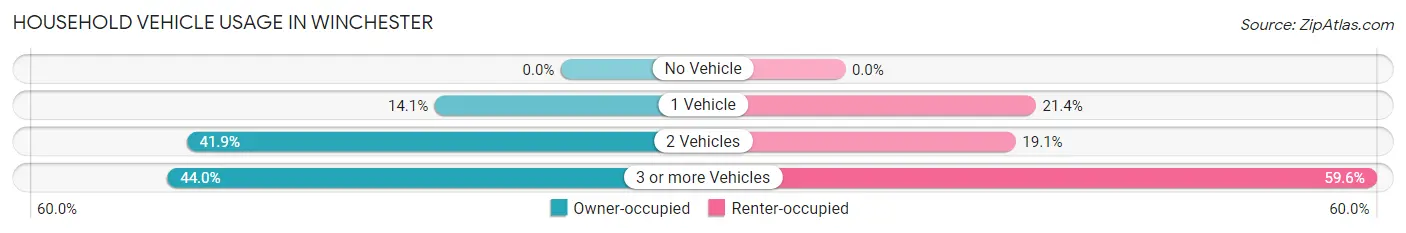
| Vehicles per Household | Owner-occupied | Renter-occupied |
| No Vehicle | 0 (0.0%) | 0 (0.0%) |
| 1 Vehicle | 105 (14.1%) | 19 (21.3%) |
| 2 Vehicles | 311 (41.9%) | 17 (19.1%) |
| 3 or more Vehicles | 327 (44.0%) | 53 (59.6%) |
| Total | 743 (100.0%) | 89 (100.0%) |
Real Estate & Mortgages in Winchester
Real Estate and Mortgage Overview in Winchester
| Characteristic | Without Mortgage | With Mortgage |
| Housing Units | 449 | 294 |
| Median Property Value | - | - |
| Median Household Income | $80,417 | $20 |
| Monthly Housing Costs | $327 | $25 |
| Real Estate Taxes | $1,747 | $15 |
Property Value by Mortgage Status in Winchester
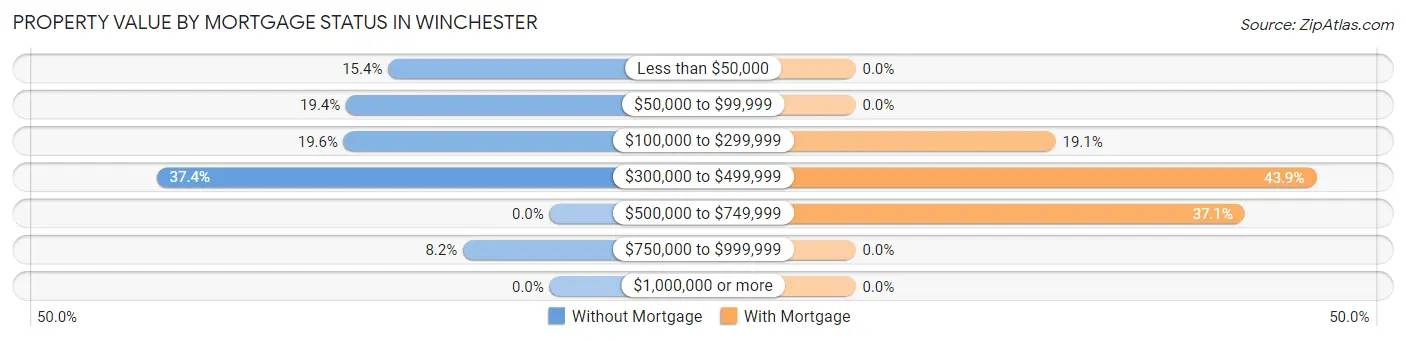
| Property Value | Without Mortgage | With Mortgage |
| Less than $50,000 | 69 (15.4%) | 0 (0.0%) |
| $50,000 to $99,999 | 87 (19.4%) | 0 (0.0%) |
| $100,000 to $299,999 | 88 (19.6%) | 56 (19.1%) |
| $300,000 to $499,999 | 168 (37.4%) | 129 (43.9%) |
| $500,000 to $749,999 | 0 (0.0%) | 109 (37.1%) |
| $750,000 to $999,999 | 37 (8.2%) | 0 (0.0%) |
| $1,000,000 or more | 0 (0.0%) | 0 (0.0%) |
| Total | 449 (100.0%) | 294 (100.0%) |
Household Income by Mortgage Status in Winchester
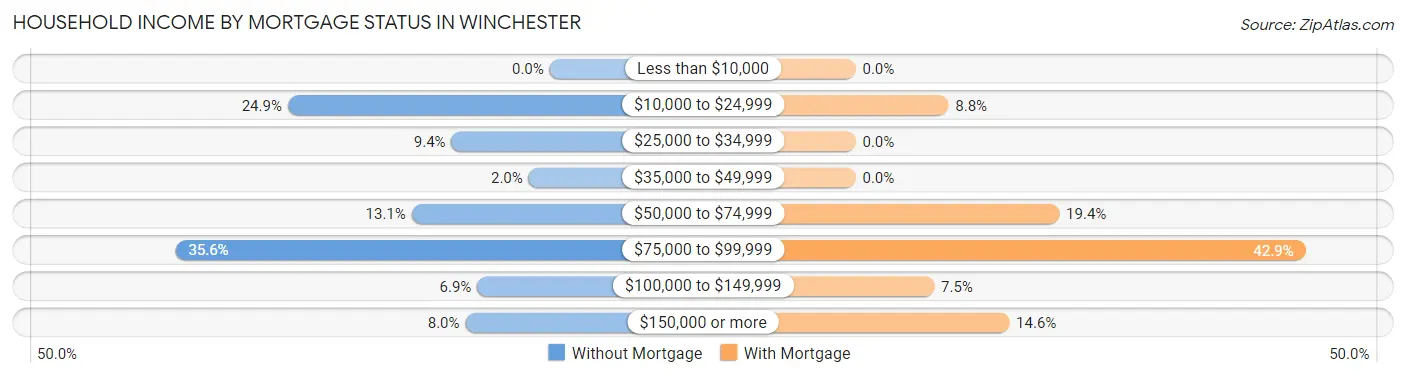
| Household Income | Without Mortgage | With Mortgage |
| Less than $10,000 | 0 (0.0%) | 0 (0.0%) |
| $10,000 to $24,999 | 112 (24.9%) | 26 (8.8%) |
| $25,000 to $34,999 | 42 (9.3%) | 0 (0.0%) |
| $35,000 to $49,999 | 9 (2.0%) | 0 (0.0%) |
| $50,000 to $74,999 | 59 (13.1%) | 57 (19.4%) |
| $75,000 to $99,999 | 160 (35.6%) | 126 (42.9%) |
| $100,000 to $149,999 | 31 (6.9%) | 22 (7.5%) |
| $150,000 or more | 36 (8.0%) | 43 (14.6%) |
| Total | 449 (100.0%) | 294 (100.0%) |
Property Value to Household Income Ratio in Winchester
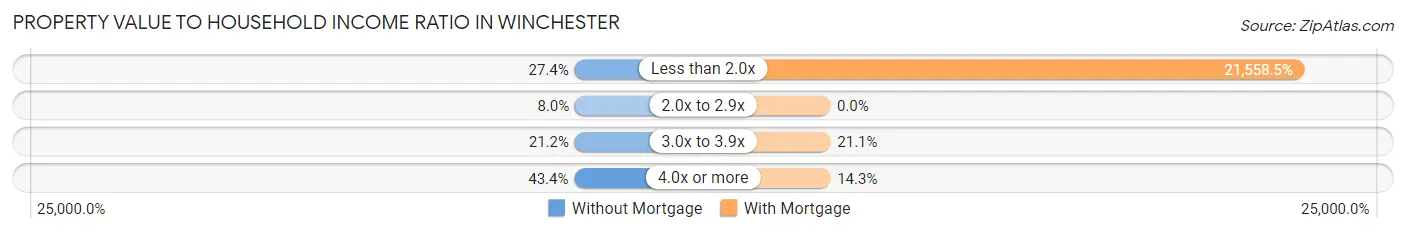
| Value-to-Income Ratio | Without Mortgage | With Mortgage |
| Less than 2.0x | 123 (27.4%) | 63,382 (21,558.5%) |
| 2.0x to 2.9x | 36 (8.0%) | 0 (0.0%) |
| 3.0x to 3.9x | 95 (21.2%) | 62 (21.1%) |
| 4.0x or more | 195 (43.4%) | 42 (14.3%) |
| Total | 449 (100.0%) | 294 (100.0%) |
Real Estate Taxes by Mortgage Status in Winchester
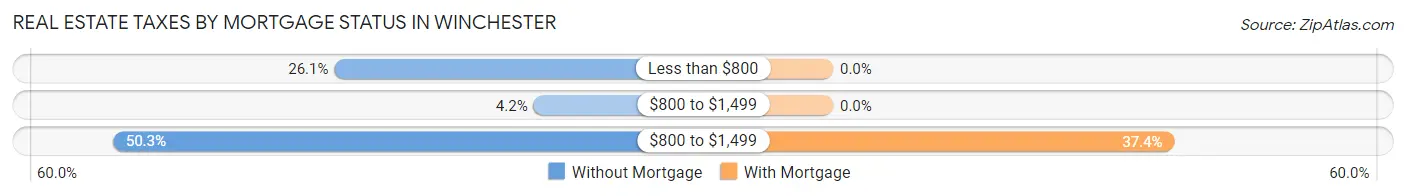
| Property Taxes | Without Mortgage | With Mortgage |
| Less than $800 | 117 (26.1%) | 0 (0.0%) |
| $800 to $1,499 | 19 (4.2%) | 0 (0.0%) |
| $800 to $1,499 | 226 (50.3%) | 110 (37.4%) |
| Total | 449 (100.0%) | 294 (100.0%) |
Health & Disability in Winchester
Health Insurance Coverage by Age in Winchester
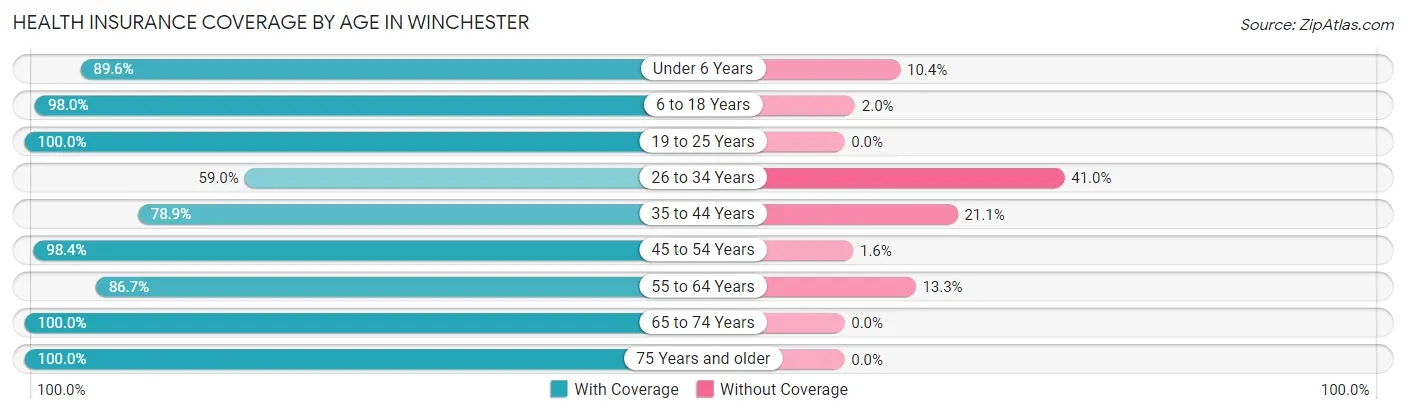
| Age Bracket | With Coverage | Without Coverage |
| Under 6 Years | 155 (89.6%) | 18 (10.4%) |
| 6 to 18 Years | 299 (98.0%) | 6 (2.0%) |
| 19 to 25 Years | 373 (100.0%) | 0 (0.0%) |
| 26 to 34 Years | 286 (59.0%) | 199 (41.0%) |
| 35 to 44 Years | 142 (78.9%) | 38 (21.1%) |
| 45 to 54 Years | 242 (98.4%) | 4 (1.6%) |
| 55 to 64 Years | 621 (86.7%) | 95 (13.3%) |
| 65 to 74 Years | 158 (100.0%) | 0 (0.0%) |
| 75 Years and older | 272 (100.0%) | 0 (0.0%) |
| Total | 2,548 (87.6%) | 360 (12.4%) |
Health Insurance Coverage by Citizenship Status in Winchester
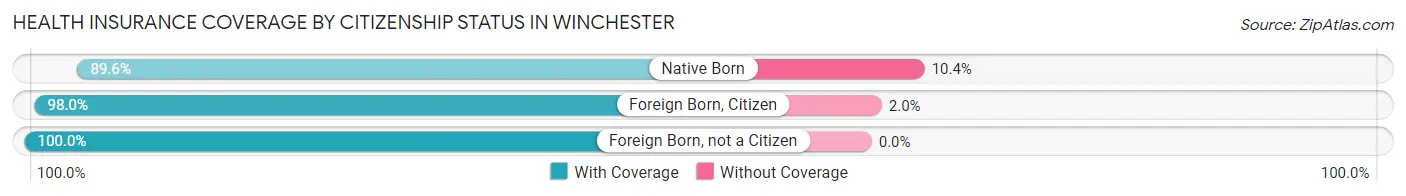
| Citizenship Status | With Coverage | Without Coverage |
| Native Born | 155 (89.6%) | 18 (10.4%) |
| Foreign Born, Citizen | 299 (98.0%) | 6 (2.0%) |
| Foreign Born, not a Citizen | 373 (100.0%) | 0 (0.0%) |
Health Insurance Coverage by Household Income in Winchester
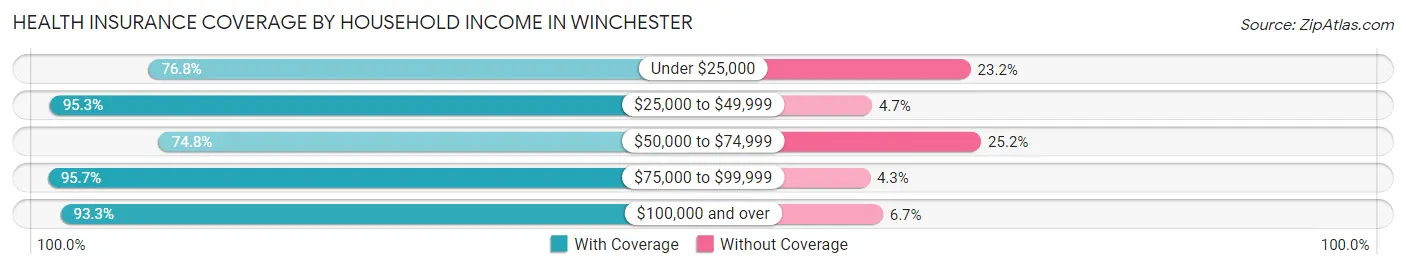
| Household Income | With Coverage | Without Coverage |
| Under $25,000 | 129 (76.8%) | 39 (23.2%) |
| $25,000 to $49,999 | 464 (95.3%) | 23 (4.7%) |
| $50,000 to $74,999 | 672 (74.8%) | 226 (25.2%) |
| $75,000 to $99,999 | 771 (95.7%) | 35 (4.3%) |
| $100,000 and over | 512 (93.3%) | 37 (6.7%) |
Public vs Private Health Insurance Coverage by Age in Winchester
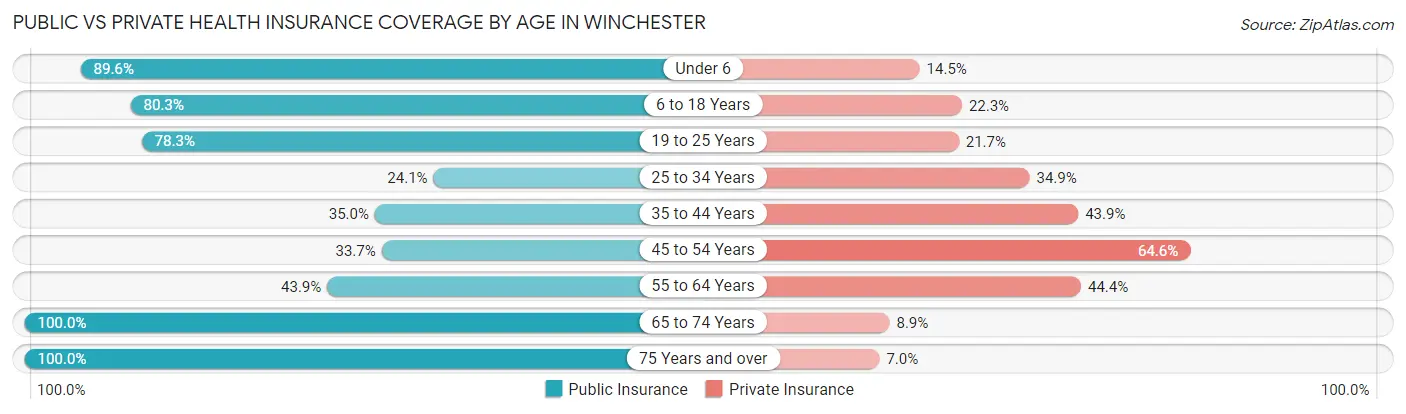
| Age Bracket | Public Insurance | Private Insurance |
| Under 6 | 155 (89.6%) | 25 (14.4%) |
| 6 to 18 Years | 245 (80.3%) | 68 (22.3%) |
| 19 to 25 Years | 292 (78.3%) | 81 (21.7%) |
| 25 to 34 Years | 117 (24.1%) | 169 (34.8%) |
| 35 to 44 Years | 63 (35.0%) | 79 (43.9%) |
| 45 to 54 Years | 83 (33.7%) | 159 (64.6%) |
| 55 to 64 Years | 314 (43.9%) | 318 (44.4%) |
| 65 to 74 Years | 158 (100.0%) | 14 (8.9%) |
| 75 Years and over | 272 (100.0%) | 19 (7.0%) |
| Total | 1,699 (58.4%) | 932 (32.1%) |
Disability Status by Sex by Age in Winchester
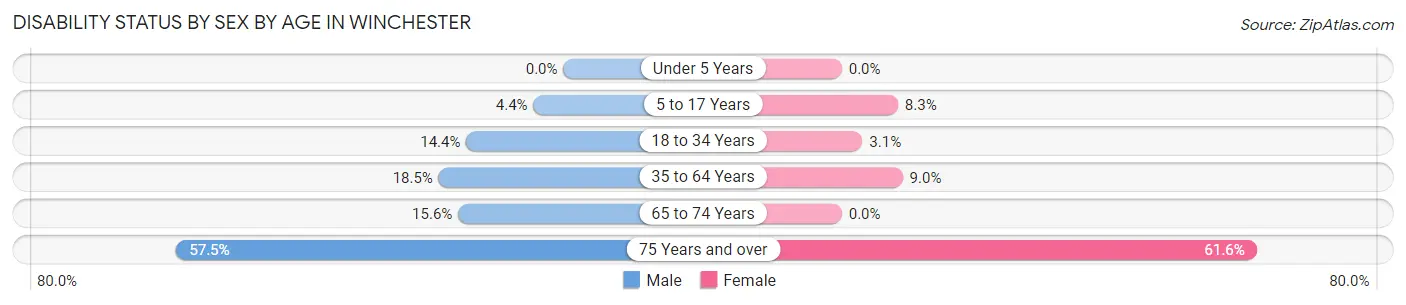
| Age Bracket | Male | Female |
| Under 5 Years | 0 (0.0%) | 0 (0.0%) |
| 5 to 17 Years | 6 (4.4%) | 16 (8.3%) |
| 18 to 34 Years | 82 (14.4%) | 9 (3.1%) |
| 35 to 64 Years | 107 (18.5%) | 51 (9.0%) |
| 65 to 74 Years | 20 (15.6%) | 0 (0.0%) |
| 75 Years and over | 77 (57.5%) | 85 (61.6%) |
Disability Class by Sex by Age in Winchester
Disability Class: Hearing Difficulty
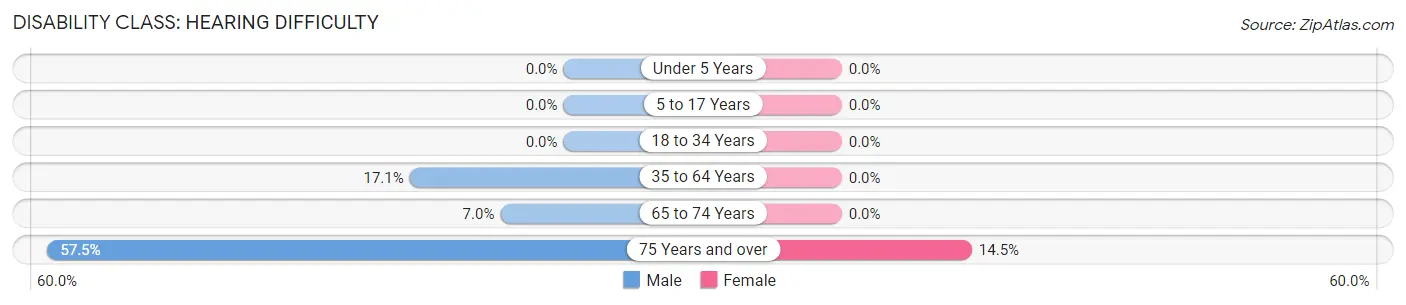
| Age Bracket | Male | Female |
| Under 5 Years | 0 (0.0%) | 0 (0.0%) |
| 5 to 17 Years | 0 (0.0%) | 0 (0.0%) |
| 18 to 34 Years | 0 (0.0%) | 0 (0.0%) |
| 35 to 64 Years | 99 (17.1%) | 0 (0.0%) |
| 65 to 74 Years | 9 (7.0%) | 0 (0.0%) |
| 75 Years and over | 77 (57.5%) | 20 (14.5%) |
Disability Class: Vision Difficulty
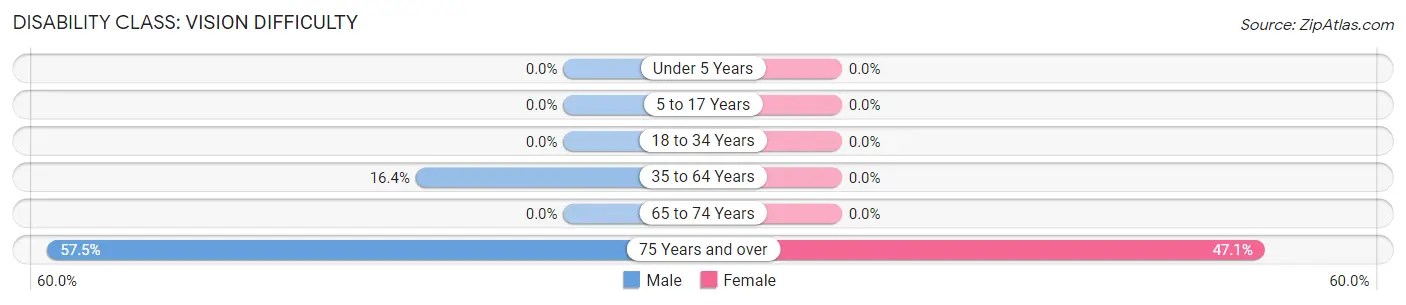
| Age Bracket | Male | Female |
| Under 5 Years | 0 (0.0%) | 0 (0.0%) |
| 5 to 17 Years | 0 (0.0%) | 0 (0.0%) |
| 18 to 34 Years | 0 (0.0%) | 0 (0.0%) |
| 35 to 64 Years | 95 (16.4%) | 0 (0.0%) |
| 65 to 74 Years | 0 (0.0%) | 0 (0.0%) |
| 75 Years and over | 77 (57.5%) | 65 (47.1%) |
Disability Class: Cognitive Difficulty
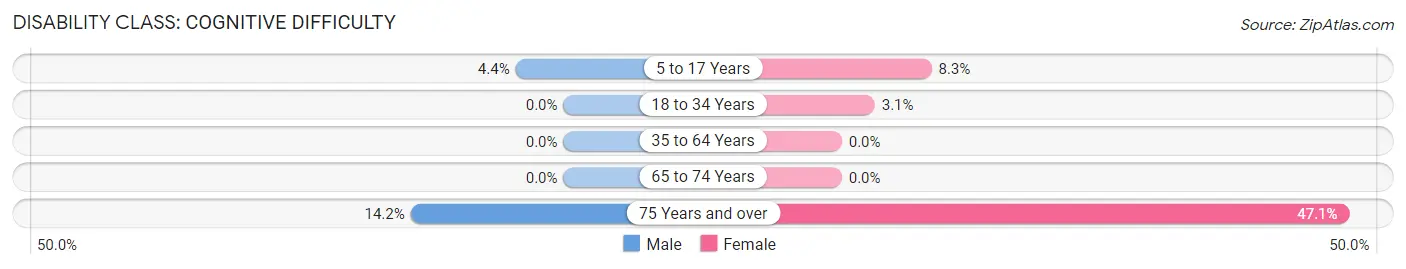
| Age Bracket | Male | Female |
| 5 to 17 Years | 6 (4.4%) | 16 (8.3%) |
| 18 to 34 Years | 0 (0.0%) | 9 (3.1%) |
| 35 to 64 Years | 0 (0.0%) | 0 (0.0%) |
| 65 to 74 Years | 0 (0.0%) | 0 (0.0%) |
| 75 Years and over | 19 (14.2%) | 65 (47.1%) |
Disability Class: Ambulatory Difficulty
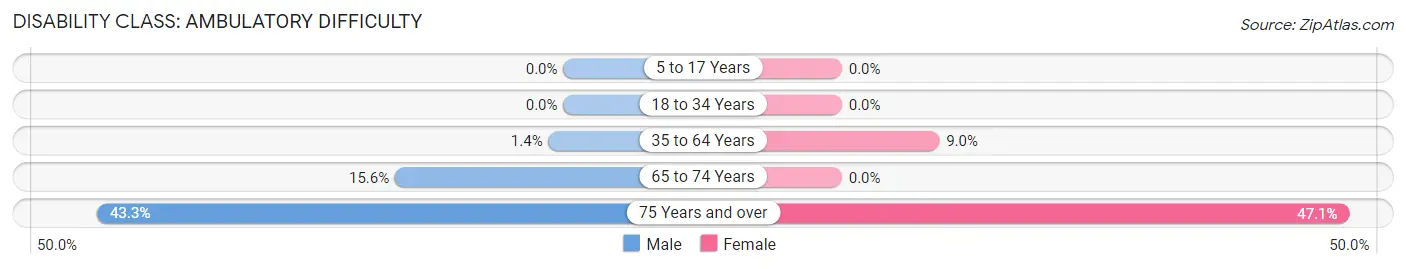
| Age Bracket | Male | Female |
| 5 to 17 Years | 0 (0.0%) | 0 (0.0%) |
| 18 to 34 Years | 0 (0.0%) | 0 (0.0%) |
| 35 to 64 Years | 8 (1.4%) | 51 (9.0%) |
| 65 to 74 Years | 20 (15.6%) | 0 (0.0%) |
| 75 Years and over | 58 (43.3%) | 65 (47.1%) |
Disability Class: Self-Care Difficulty
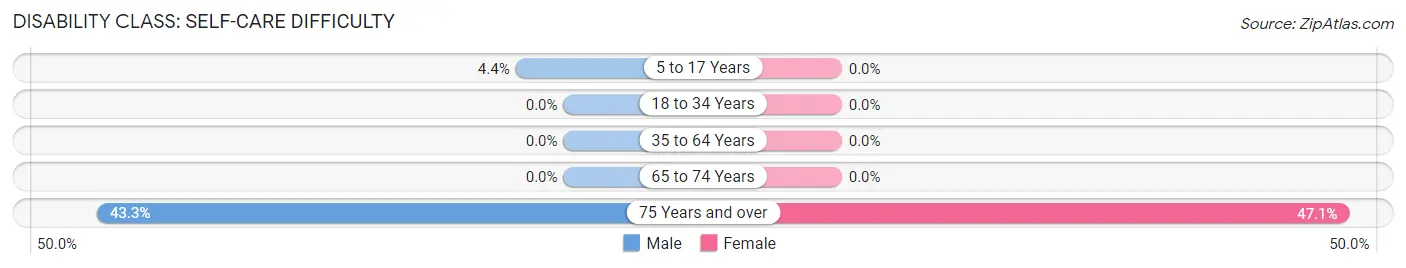
| Age Bracket | Male | Female |
| 5 to 17 Years | 6 (4.4%) | 0 (0.0%) |
| 18 to 34 Years | 0 (0.0%) | 0 (0.0%) |
| 35 to 64 Years | 0 (0.0%) | 0 (0.0%) |
| 65 to 74 Years | 0 (0.0%) | 0 (0.0%) |
| 75 Years and over | 58 (43.3%) | 65 (47.1%) |
Technology Access in Winchester
Computing Device Access in Winchester
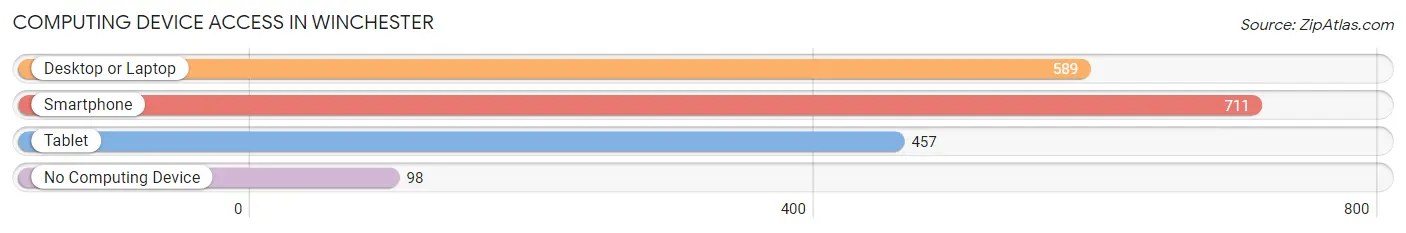
| Device Type | # Households | % Households |
| Desktop or Laptop | 589 | 70.8% |
| Smartphone | 711 | 85.5% |
| Tablet | 457 | 54.9% |
| No Computing Device | 98 | 11.8% |
| Total | 832 | 100.0% |
Internet Access in Winchester
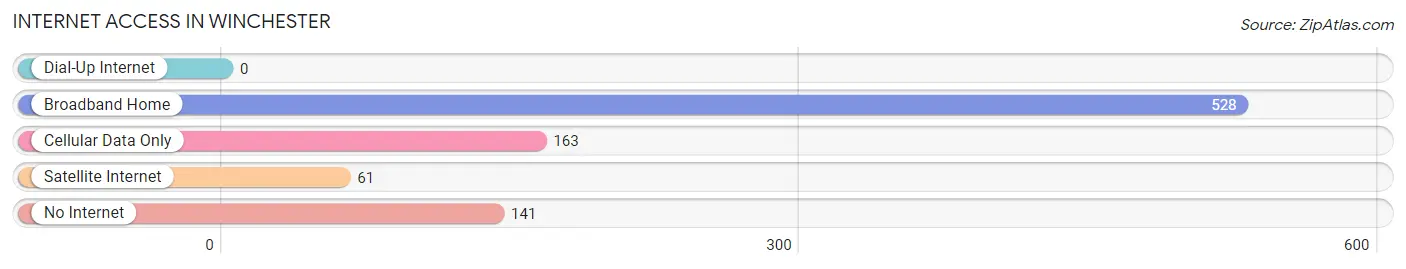
| Internet Type | # Households | % Households |
| Dial-Up Internet | 0 | 0.0% |
| Broadband Home | 528 | 63.5% |
| Cellular Data Only | 163 | 19.6% |
| Satellite Internet | 61 | 7.3% |
| No Internet | 141 | 17.0% |
| Total | 832 | 100.0% |
Winchester Summary
Winchester is a census-designated place located in Riverside County, California, United States. It is situated in the Temecula Valley, just south of the city of Temecula. The population was 2,534 at the 2010 census, up from 1,541 at the 2000 census.
History
The area now known as Winchester was originally inhabited by the Luiseño people, who were part of the larger Shoshonean language group. The area was part of the Rancho Pauba Mexican land grant, which was granted to Juan Maria Osuna in 1841. The area was later settled by American settlers in the late 19th century. The town was named after the Winchester rifle, which was popular with the settlers.
Geography
Winchester is located at 33°32'25"N 117°7'17"W (33.540278, -117.121389). According to the United States Census Bureau, the CDP has a total area of 4.2 square miles (10.9 km2), all of it land.
Economy
Winchester is primarily a residential community, with most of its residents commuting to nearby cities for work. The town is home to several small businesses, including a winery, a golf course, and a few restaurants.
Demographics
As of the census of 2000, there were 1,541 people, 545 households, and 437 families residing in the CDP. The population density was 366.3 people per square mile (141.6/km2). There were 572 housing units at an average density of 136.7 per square mile (52.7/km2). The racial makeup of the CDP was 81.2% White, 0.9% African American, 0.7% Native American, 0.7% Asian, 0.1% Pacific Islander, 13.2% from other races, and 3.2% from two or more races. Hispanic or Latino of any race were 24.2% of the population.
There were 545 households, out of which 37.2% had children under the age of 18 living with them, 63.3% were married couples living together, 9.7% had a female householder with no husband present, and 21.3% were non-families. 16.2% of all households were made up of individuals, and 5.3% had someone living alone who was 65 years of age or older. The average household size was 2.83 and the average family size was 3.17.
In the CDP, the population was spread out, with 27.2% under the age of 18, 8.2% from 18 to 24, 28.2% from 25 to 44, 25.2% from 45 to 64, and 11.2% who were 65 years of age or older. The median age was 37 years. For every 100 females, there were 97.2 males. For every 100 females age 18 and over, there were 94.2 males.
The median income for a household in the CDP was $50,938, and the median income for a family was $54,821. Males had a median income of $41,250 versus $30,000 for females. The per capita income for the CDP was $20,945. About 6.2% of families and 8.2% of the population were below the poverty line, including 10.2% of those under age 18 and none of those age 65 or over.
Common Questions
What is Per Capita Income in Winchester?
Per Capita income in Winchester is $22,786.
What is the Median Family Income in Winchester?
Median Family Income in Winchester is $82,584.
What is the Median Household income in Winchester?
Median Household Income in Winchester is $70,865.
What is Income or Wage Gap in Winchester?
Income or Wage Gap in Winchester is 42.5%.
Women in Winchester earn 57.5 cents for every dollar earned by a man.
What is Inequality or Gini Index in Winchester?
Inequality or Gini Index in Winchester is 0.31.
What is the Total Population of Winchester?
Total Population of Winchester is 2,917.
What is the Total Male Population of Winchester?
Total Male Population of Winchester is 1,671.
What is the Total Female Population of Winchester?
Total Female Population of Winchester is 1,246.
What is the Ratio of Males per 100 Females in Winchester?
There are 134.11 Males per 100 Females in Winchester.
What is the Ratio of Females per 100 Males in Winchester?
There are 74.57 Females per 100 Males in Winchester.
What is the Median Population Age in Winchester?
Median Population Age in Winchester is 40.2 Years.
What is the Average Family Size in Winchester
Average Family Size in Winchester is 4.3 People.
What is the Average Household Size in Winchester
Average Household Size in Winchester is 3.5 People.
How Large is the Labor Force in Winchester?
There are 1,204 People in the Labor Forcein in Winchester.
What is the Percentage of People in the Labor Force in Winchester?
47.4% of People are in the Labor Force in Winchester.
What is the Unemployment Rate in Winchester?
Unemployment Rate in Winchester is 4.1%.