Cities with the Highest Percentage of Population Employed in Material Moving in Nevada
RELATED REPORTS & OPTIONS
Material Moving
Nevada
Compare Cities
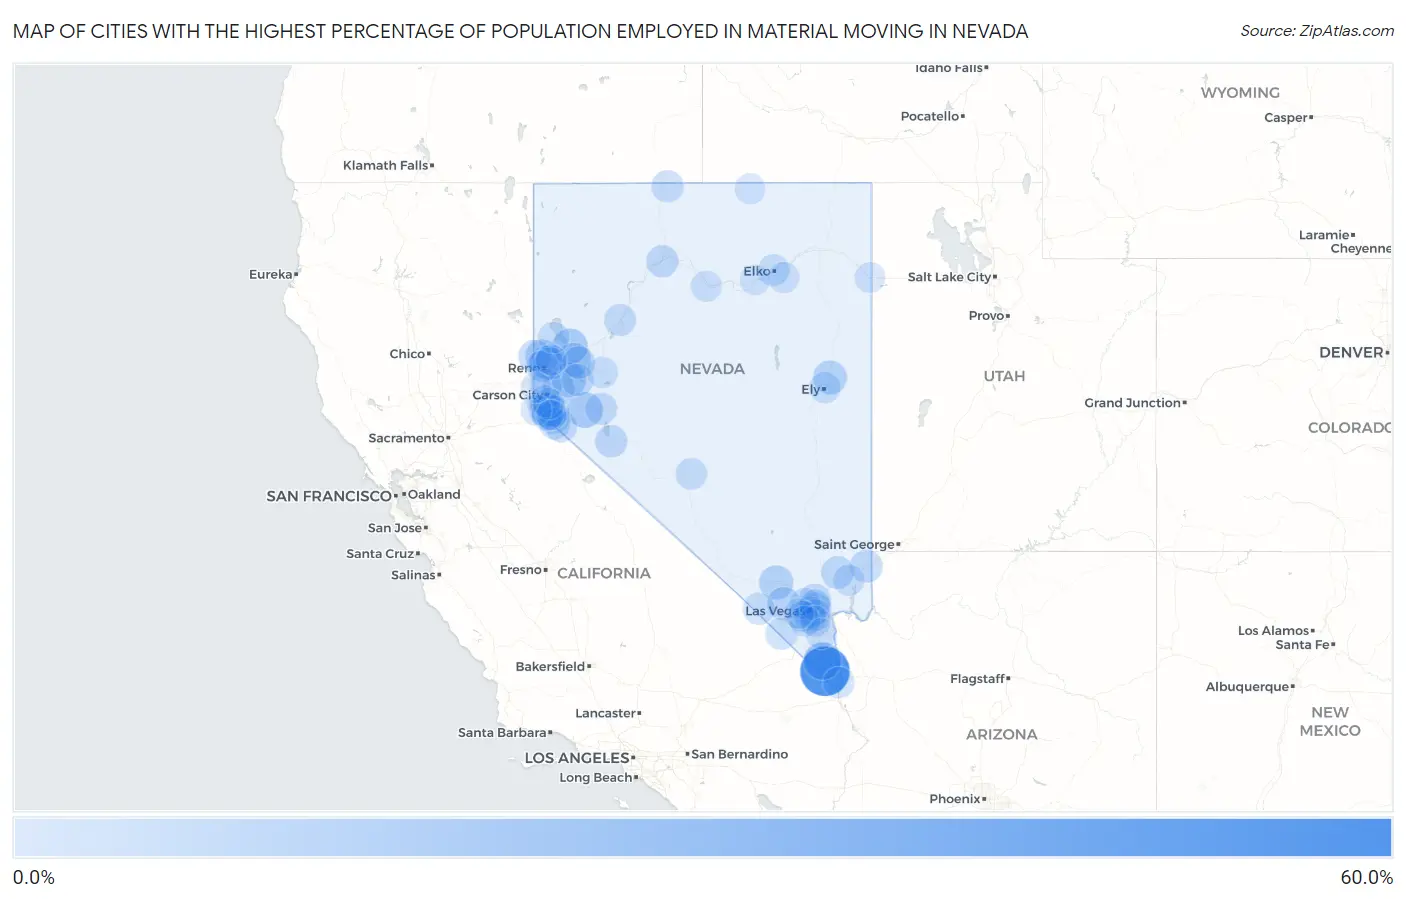
Map of Cities with the Highest Percentage of Population Employed in Material Moving in Nevada
0.0%
60.0%
Cities with the Highest Percentage of Population Employed in Material Moving in Nevada
| City | % Employed | vs State | vs National | |
| 1. | Cal Nev Ari | 57.1% | 4.2%(+53.0)#1 | 3.8%(+53.3)#76 |
| 2. | Searchlight | 20.9% | 4.2%(+16.7)#2 | 3.8%(+17.1)#661 |
| 3. | Yerington | 15.8% | 4.2%(+11.6)#3 | 3.8%(+11.9)#1,234 |
| 4. | Nixon | 14.3% | 4.2%(+10.1)#4 | 3.8%(+10.5)#1,532 |
| 5. | Stagecoach | 12.3% | 4.2%(+8.14)#5 | 3.8%(+8.46)#2,184 |
| 6. | Gardnerville | 12.0% | 4.2%(+7.80)#6 | 3.8%(+8.13)#2,308 |
| 7. | Wadsworth | 11.9% | 4.2%(+7.72)#7 | 3.8%(+8.04)#2,341 |
| 8. | Indian Springs | 11.3% | 4.2%(+7.17)#8 | 3.8%(+7.49)#2,575 |
| 9. | Mcgill | 10.6% | 4.2%(+6.45)#9 | 3.8%(+6.77)#2,924 |
| 10. | Lemmon Valley | 10.1% | 4.2%(+5.93)#10 | 3.8%(+6.25)#3,243 |
| 11. | Minden | 9.7% | 4.2%(+5.56)#11 | 3.8%(+5.88)#3,499 |
| 12. | Sun Valley | 9.4% | 4.2%(+5.22)#12 | 3.8%(+5.55)#3,764 |
| 13. | Mount Charleston | 9.2% | 4.2%(+5.04)#13 | 3.8%(+5.36)#3,903 |
| 14. | Cold Springs | 8.1% | 4.2%(+3.91)#14 | 3.8%(+4.24)#4,971 |
| 15. | Mesquite | 7.2% | 4.2%(+3.03)#15 | 3.8%(+3.35)#6,119 |
| 16. | Moapa Town | 7.0% | 4.2%(+2.85)#16 | 3.8%(+3.18)#6,373 |
| 17. | Dayton | 6.8% | 4.2%(+2.60)#17 | 3.8%(+2.93)#6,755 |
| 18. | Sparks | 6.8% | 4.2%(+2.60)#18 | 3.8%(+2.92)#6,762 |
| 19. | Fernley | 6.7% | 4.2%(+2.54)#19 | 3.8%(+2.86)#6,873 |
| 20. | Sunrise Manor | 6.5% | 4.2%(+2.34)#20 | 3.8%(+2.67)#7,187 |
| 21. | Carter Springs | 6.5% | 4.2%(+2.30)#21 | 3.8%(+2.62)#7,248 |
| 22. | Washoe Valley | 6.4% | 4.2%(+2.21)#22 | 3.8%(+2.53)#7,407 |
| 23. | Silver Springs | 6.2% | 4.2%(+2.03)#23 | 3.8%(+2.35)#7,706 |
| 24. | Hawthorne | 6.1% | 4.2%(+1.93)#24 | 3.8%(+2.26)#7,867 |
| 25. | Winnemucca | 6.0% | 4.2%(+1.88)#25 | 3.8%(+2.20)#7,987 |
| 26. | North Las Vegas | 5.8% | 4.2%(+1.64)#26 | 3.8%(+1.96)#8,455 |
| 27. | Schurz | 5.5% | 4.2%(+1.37)#27 | 3.8%(+1.69)#9,021 |
| 28. | Lovelock | 5.5% | 4.2%(+1.33)#28 | 3.8%(+1.65)#9,096 |
| 29. | Topaz Ranch Estates | 5.4% | 4.2%(+1.22)#29 | 3.8%(+1.55)#9,294 |
| 30. | Fort Mcdermitt | 5.4% | 4.2%(+1.20)#30 | 3.8%(+1.53)#9,352 |
| 31. | Reno | 5.0% | 4.2%(+0.839)#31 | 3.8%(+1.16)#10,172 |
| 32. | Fish Springs | 4.7% | 4.2%(+0.564)#32 | 3.8%(+0.887)#10,884 |
| 33. | Sandy Valley | 4.6% | 4.2%(+0.487)#33 | 3.8%(+0.810)#11,098 |
| 34. | Pahrump | 4.6% | 4.2%(+0.411)#34 | 3.8%(+0.734)#11,284 |
| 35. | Winchester | 4.5% | 4.2%(+0.362)#35 | 3.8%(+0.684)#11,431 |
| 36. | Elko | 4.4% | 4.2%(+0.246)#36 | 3.8%(+0.569)#11,724 |
| 37. | Paradise | 4.3% | 4.2%(+0.190)#37 | 3.8%(+0.513)#11,895 |
| 38. | Whitney | 4.1% | 4.2%(-0.076)#38 | 3.8%(+0.247)#12,657 |
| 39. | Carson | 4.1% | 4.2%(-0.100)#39 | 3.8%(+0.222)#12,733 |
| 40. | Double Spring | 4.0% | 4.2%(-0.153)#40 | 3.8%(+0.170)#12,887 |
| 41. | Tonopah | 3.9% | 4.2%(-0.234)#41 | 3.8%(+0.089)#13,126 |
| 42. | Indian Hills | 3.9% | 4.2%(-0.244)#42 | 3.8%(+0.078)#13,152 |
| 43. | Las Vegas | 3.9% | 4.2%(-0.260)#43 | 3.8%(+0.063)#13,191 |
| 44. | Sutcliffe | 3.8% | 4.2%(-0.343)#44 | 3.8%(-0.021)#13,445 |
| 45. | Gardnerville Ranchos | 3.7% | 4.2%(-0.481)#45 | 3.8%(-0.158)#13,854 |
| 46. | Johnson Lane | 3.6% | 4.2%(-0.581)#46 | 3.8%(-0.259)#14,152 |
| 47. | Laughlin | 3.6% | 4.2%(-0.596)#47 | 3.8%(-0.274)#14,223 |
| 48. | Fallon | 3.2% | 4.2%(-0.911)#48 | 3.8%(-0.589)#15,195 |
| 49. | Ely | 3.2% | 4.2%(-0.916)#49 | 3.8%(-0.594)#15,204 |
| 50. | Nellis Afb | 3.2% | 4.2%(-0.987)#50 | 3.8%(-0.665)#15,442 |
| 51. | Moapa Valley | 3.2% | 4.2%(-1.00)#51 | 3.8%(-0.678)#15,483 |
| 52. | Spring Valley | 3.0% | 4.2%(-1.12)#52 | 3.8%(-0.795)#15,820 |
| 53. | Spring Creek | 2.9% | 4.2%(-1.20)#53 | 3.8%(-0.882)#16,114 |
| 54. | Spanish Springs | 2.8% | 4.2%(-1.37)#54 | 3.8%(-1.05)#16,631 |
| 55. | Henderson | 2.6% | 4.2%(-1.59)#55 | 3.8%(-1.27)#17,313 |
| 56. | Enterprise | 2.4% | 4.2%(-1.72)#56 | 3.8%(-1.40)#17,748 |
| 57. | Battle Mountain | 2.3% | 4.2%(-1.86)#57 | 3.8%(-1.53)#18,211 |
| 58. | Boulder City | 2.0% | 4.2%(-2.16)#58 | 3.8%(-1.84)#19,174 |
| 59. | Stateline | 1.9% | 4.2%(-2.30)#59 | 3.8%(-1.97)#19,578 |
| 60. | Incline Village | 1.8% | 4.2%(-2.31)#60 | 3.8%(-1.98)#19,604 |
| 61. | West Wendover | 1.4% | 4.2%(-2.79)#61 | 3.8%(-2.46)#21,106 |
| 62. | Ruhenstroth | 1.3% | 4.2%(-2.86)#62 | 3.8%(-2.54)#21,335 |
| 63. | Owyhee | 1.3% | 4.2%(-2.88)#63 | 3.8%(-2.56)#21,387 |
| 64. | Carlin | 0.93% | 4.2%(-3.22)#64 | 3.8%(-2.90)#22,325 |
| 65. | Summerlin South | 0.60% | 4.2%(-3.55)#65 | 3.8%(-3.23)#23,079 |
1
2Common Questions
What are the Top 10 Cities with the Highest Percentage of Population Employed in Material Moving in Nevada?
Top 10 Cities with the Highest Percentage of Population Employed in Material Moving in Nevada are:
#1
57.1%
#2
20.9%
#3
15.8%
#4
14.3%
#5
12.3%
#6
12.0%
#7
11.9%
#8
11.3%
#9
10.6%
#10
10.1%
What city has the Highest Percentage of Population Employed in Material Moving in Nevada?
Cal Nev Ari has the Highest Percentage of Population Employed in Material Moving in Nevada with 57.1%.
What is the Percentage of Population Employed in Material Moving in the State of Nevada?
Percentage of Population Employed in Material Moving in Nevada is 4.2%.
What is the Percentage of Population Employed in Material Moving in the United States?
Percentage of Population Employed in Material Moving in the United States is 3.8%.