Cities with the Highest Percentage of Population Employed in Material Moving in Maryland
RELATED REPORTS & OPTIONS
Material Moving
Maryland
Compare Cities
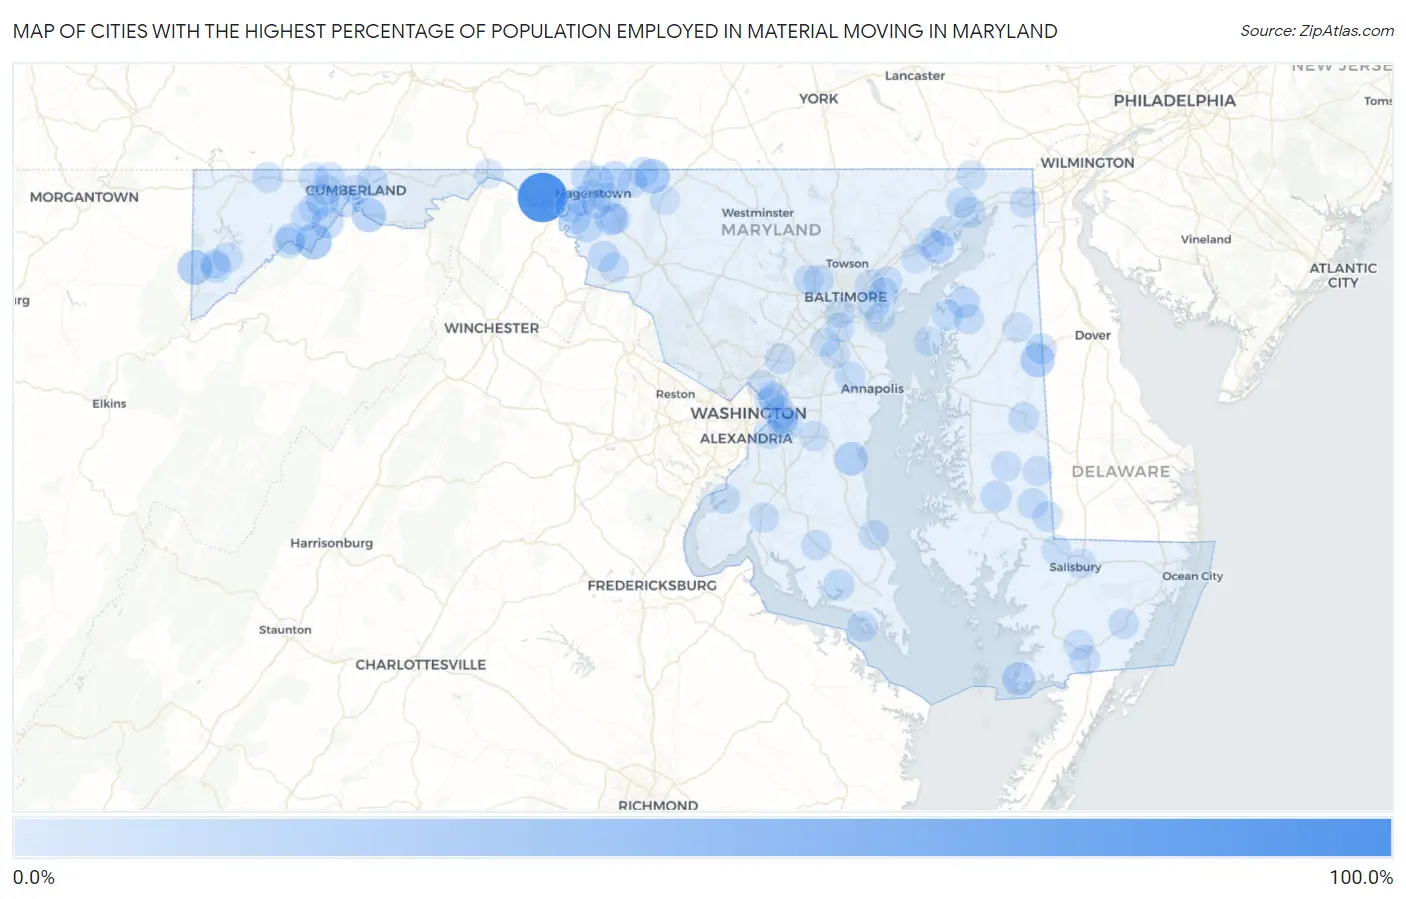
Map of Cities with the Highest Percentage of Population Employed in Material Moving in Maryland
0.0%
100.0%
Cities with the Highest Percentage of Population Employed in Material Moving in Maryland
| City | % Employed | vs State | vs National | |
| 1. | Big Spring | 100.0% | 2.9%(+97.1)#1 | 3.8%(+96.2)#27 |
| 2. | Dawson | 33.3% | 2.9%(+30.4)#2 | 3.8%(+29.5)#244 |
| 3. | Crellin | 26.5% | 2.9%(+23.7)#3 | 3.8%(+22.7)#392 |
| 4. | Sabillasville | 26.1% | 2.9%(+23.2)#4 | 3.8%(+22.3)#402 |
| 5. | Spring Gap | 25.0% | 2.9%(+22.1)#5 | 3.8%(+21.2)#451 |
| 6. | Henderson | 24.3% | 2.9%(+21.4)#6 | 3.8%(+20.5)#476 |
| 7. | Friendship | 20.5% | 2.9%(+17.6)#7 | 3.8%(+16.7)#695 |
| 8. | Crisfield | 19.2% | 2.9%(+16.3)#8 | 3.8%(+15.4)#782 |
| 9. | Vale Summit | 18.0% | 2.9%(+15.1)#9 | 3.8%(+14.1)#912 |
| 10. | Cedar Heights | 17.9% | 2.9%(+15.0)#10 | 3.8%(+14.1)#918 |
| 11. | Perryman | 16.9% | 2.9%(+14.0)#11 | 3.8%(+13.1)#1,047 |
| 12. | San Mar | 16.8% | 2.9%(+14.0)#12 | 3.8%(+13.0)#1,062 |
| 13. | Williamsport | 15.9% | 2.9%(+13.0)#13 | 3.8%(+12.1)#1,202 |
| 14. | Leitersburg | 15.9% | 2.9%(+13.0)#14 | 3.8%(+12.1)#1,203 |
| 15. | Rawlings | 14.9% | 2.9%(+12.0)#15 | 3.8%(+11.1)#1,394 |
| 16. | Potomac Park | 13.4% | 2.9%(+10.5)#16 | 3.8%(+9.61)#1,781 |
| 17. | Worton | 13.4% | 2.9%(+10.5)#17 | 3.8%(+9.57)#1,787 |
| 18. | Seat Pleasant | 13.0% | 2.9%(+10.1)#18 | 3.8%(+9.15)#1,931 |
| 19. | Tilghmanton | 12.1% | 2.9%(+9.25)#19 | 3.8%(+8.31)#2,240 |
| 20. | Luke | 11.9% | 2.9%(+9.01)#20 | 3.8%(+8.07)#2,327 |
| 21. | Paramount Long Meadow | 11.5% | 2.9%(+8.59)#21 | 3.8%(+7.65)#2,507 |
| 22. | Secretary | 11.4% | 2.9%(+8.55)#22 | 3.8%(+7.61)#2,520 |
| 23. | Westernport | 11.4% | 2.9%(+8.52)#23 | 3.8%(+7.58)#2,536 |
| 24. | Fairlee | 11.2% | 2.9%(+8.30)#24 | 3.8%(+7.36)#2,636 |
| 25. | Leonardtown | 11.0% | 2.9%(+8.10)#25 | 3.8%(+7.16)#2,732 |
| 26. | Loch Lynn Heights | 10.7% | 2.9%(+7.76)#26 | 3.8%(+6.83)#2,900 |
| 27. | Trego Rohrersville Station | 10.7% | 2.9%(+7.76)#27 | 3.8%(+6.82)#2,904 |
| 28. | Marydel | 10.4% | 2.9%(+7.52)#28 | 3.8%(+6.59)#3,038 |
| 29. | Perryville | 10.3% | 2.9%(+7.44)#29 | 3.8%(+6.50)#3,087 |
| 30. | Dundalk | 10.0% | 2.9%(+7.09)#30 | 3.8%(+6.15)#3,323 |
| 31. | Grantsville | 9.6% | 2.9%(+6.68)#31 | 3.8%(+5.74)#3,597 |
| 32. | Pleasant Grove | 9.6% | 2.9%(+6.67)#32 | 3.8%(+5.73)#3,603 |
| 33. | Eckhart Mines | 9.2% | 2.9%(+6.29)#33 | 3.8%(+5.35)#3,908 |
| 34. | Highfield Cascade | 9.2% | 2.9%(+6.26)#34 | 3.8%(+5.32)#3,950 |
| 35. | Downsville | 9.1% | 2.9%(+6.21)#35 | 3.8%(+5.27)#3,979 |
| 36. | Denton | 8.8% | 2.9%(+5.92)#36 | 3.8%(+4.98)#4,221 |
| 37. | Eldorado | 8.7% | 2.9%(+5.80)#37 | 3.8%(+4.87)#4,330 |
| 38. | Deer Park | 8.7% | 2.9%(+5.77)#38 | 3.8%(+4.84)#4,347 |
| 39. | Tall Timbers | 8.6% | 2.9%(+5.75)#39 | 3.8%(+4.82)#4,361 |
| 40. | Konterra | 8.4% | 2.9%(+5.52)#40 | 3.8%(+4.58)#4,593 |
| 41. | Robinwood | 8.4% | 2.9%(+5.52)#41 | 3.8%(+4.58)#4,597 |
| 42. | Mount Lena | 8.4% | 2.9%(+5.49)#42 | 3.8%(+4.55)#4,628 |
| 43. | Crownsville | 8.2% | 2.9%(+5.31)#43 | 3.8%(+4.37)#4,826 |
| 44. | Elkton | 8.2% | 2.9%(+5.26)#44 | 3.8%(+4.32)#4,874 |
| 45. | Chestertown | 8.0% | 2.9%(+5.06)#45 | 3.8%(+4.12)#5,089 |
| 46. | Hagerstown | 7.9% | 2.9%(+5.06)#46 | 3.8%(+4.12)#5,098 |
| 47. | Sharptown | 7.9% | 2.9%(+5.02)#47 | 3.8%(+4.08)#5,153 |
| 48. | Potomac Heights | 7.9% | 2.9%(+5.00)#48 | 3.8%(+4.06)#5,184 |
| 49. | Mount Savage | 7.9% | 2.9%(+4.98)#49 | 3.8%(+4.04)#5,201 |
| 50. | Aberdeen | 7.8% | 2.9%(+4.95)#50 | 3.8%(+4.01)#5,251 |
| 51. | Marlow Heights | 7.7% | 2.9%(+4.83)#51 | 3.8%(+3.89)#5,394 |
| 52. | District Heights | 7.5% | 2.9%(+4.66)#52 | 3.8%(+3.72)#5,617 |
| 53. | Port Deposit | 7.5% | 2.9%(+4.59)#53 | 3.8%(+3.65)#5,706 |
| 54. | Snow Hill | 7.4% | 2.9%(+4.48)#54 | 3.8%(+3.54)#5,849 |
| 55. | Calvert Beach | 7.3% | 2.9%(+4.45)#55 | 3.8%(+3.51)#5,891 |
| 56. | Lochearn | 7.3% | 2.9%(+4.43)#56 | 3.8%(+3.49)#5,921 |
| 57. | Mechanicsville | 7.3% | 2.9%(+4.40)#57 | 3.8%(+3.46)#5,964 |
| 58. | Maugansville | 7.1% | 2.9%(+4.17)#58 | 3.8%(+3.23)#6,272 |
| 59. | West Pocomoke | 7.0% | 2.9%(+4.10)#59 | 3.8%(+3.17)#6,388 |
| 60. | Halfway | 7.0% | 2.9%(+4.07)#60 | 3.8%(+3.13)#6,448 |
| 61. | Forestville | 6.8% | 2.9%(+3.95)#61 | 3.8%(+3.02)#6,620 |
| 62. | Lonaconing | 6.7% | 2.9%(+3.83)#62 | 3.8%(+2.89)#6,826 |
| 63. | Rosedale | 6.7% | 2.9%(+3.83)#63 | 3.8%(+2.89)#6,828 |
| 64. | Edmonston | 6.6% | 2.9%(+3.75)#64 | 3.8%(+2.81)#6,965 |
| 65. | Ten Mile Creek | 6.6% | 2.9%(+3.75)#65 | 3.8%(+2.81)#6,966 |
| 66. | Midland | 6.6% | 2.9%(+3.66)#66 | 3.8%(+2.72)#7,106 |
| 67. | Funkstown | 6.5% | 2.9%(+3.62)#67 | 3.8%(+2.68)#7,169 |
| 68. | Finzel | 6.4% | 2.9%(+3.47)#68 | 3.8%(+2.53)#7,409 |
| 69. | Middle River | 6.3% | 2.9%(+3.46)#69 | 3.8%(+2.52)#7,434 |
| 70. | Preston | 6.3% | 2.9%(+3.39)#70 | 3.8%(+2.45)#7,527 |
| 71. | Cumberland | 6.3% | 2.9%(+3.38)#71 | 3.8%(+2.44)#7,536 |
| 72. | Pocomoke City | 6.3% | 2.9%(+3.36)#72 | 3.8%(+2.42)#7,563 |
| 73. | Milford Mill | 6.2% | 2.9%(+3.33)#73 | 3.8%(+2.39)#7,628 |
| 74. | Edgemont | 6.2% | 2.9%(+3.27)#74 | 3.8%(+2.33)#7,732 |
| 75. | Baltimore Highlands | 6.1% | 2.9%(+3.24)#75 | 3.8%(+2.30)#7,793 |
| 76. | Essex | 6.1% | 2.9%(+3.23)#76 | 3.8%(+2.29)#7,810 |
| 77. | La Plata | 6.1% | 2.9%(+3.20)#77 | 3.8%(+2.26)#7,866 |
| 78. | Woodlawn Cdp Prince George S County | 5.9% | 2.9%(+3.01)#78 | 3.8%(+2.08)#8,228 |
| 79. | Walker Mill | 5.9% | 2.9%(+3.01)#79 | 3.8%(+2.07)#8,234 |
| 80. | Rising Sun | 5.7% | 2.9%(+2.77)#80 | 3.8%(+1.83)#8,741 |
| 81. | Bladensburg | 5.7% | 2.9%(+2.77)#81 | 3.8%(+1.83)#8,742 |
| 82. | Burkittsville | 5.6% | 2.9%(+2.74)#82 | 3.8%(+1.80)#8,794 |
| 83. | Federalsburg | 5.6% | 2.9%(+2.72)#83 | 3.8%(+1.78)#8,835 |
| 84. | Gambrills | 5.6% | 2.9%(+2.69)#84 | 3.8%(+1.75)#8,897 |
| 85. | Colmar Manor | 5.6% | 2.9%(+2.68)#85 | 3.8%(+1.74)#8,913 |
| 86. | Hebron | 5.5% | 2.9%(+2.63)#86 | 3.8%(+1.69)#9,027 |
| 87. | Graceham | 5.5% | 2.9%(+2.58)#87 | 3.8%(+1.64)#9,117 |
| 88. | Rock Hall | 5.4% | 2.9%(+2.47)#88 | 3.8%(+1.53)#9,336 |
| 89. | Sudlersville | 5.4% | 2.9%(+2.47)#89 | 3.8%(+1.53)#9,349 |
| 90. | Mountain Lake Park | 5.3% | 2.9%(+2.41)#90 | 3.8%(+1.48)#9,468 |
| 91. | Ferndale | 5.3% | 2.9%(+2.39)#91 | 3.8%(+1.46)#9,502 |
| 92. | Upper Marlboro | 5.2% | 2.9%(+2.26)#92 | 3.8%(+1.32)#9,824 |
| 93. | Hancock | 4.9% | 2.9%(+2.05)#93 | 3.8%(+1.11)#10,285 |
| 94. | Riverside | 4.9% | 2.9%(+2.02)#94 | 3.8%(+1.09)#10,345 |
| 95. | Thurmont | 4.9% | 2.9%(+2.01)#95 | 3.8%(+1.07)#10,368 |
| 96. | Langley Park | 4.8% | 2.9%(+1.92)#96 | 3.8%(+0.986)#10,599 |
| 97. | Severn | 4.8% | 2.9%(+1.91)#97 | 3.8%(+0.967)#10,645 |
| 98. | Edgewood | 4.8% | 2.9%(+1.90)#98 | 3.8%(+0.959)#10,668 |
| 99. | Edgemere | 4.8% | 2.9%(+1.89)#99 | 3.8%(+0.950)#10,693 |
| 100. | Salisbury | 4.7% | 2.9%(+1.83)#100 | 3.8%(+0.888)#10,879 |
Common Questions
What are the Top 10 Cities with the Highest Percentage of Population Employed in Material Moving in Maryland?
Top 10 Cities with the Highest Percentage of Population Employed in Material Moving in Maryland are:
#1
100.0%
#2
33.3%
#3
26.5%
#4
26.1%
#5
25.0%
#6
24.3%
#7
20.5%
#8
19.2%
#9
18.0%
#10
16.9%
What city has the Highest Percentage of Population Employed in Material Moving in Maryland?
Big Spring has the Highest Percentage of Population Employed in Material Moving in Maryland with 100.0%.
What is the Percentage of Population Employed in Material Moving in the State of Maryland?
Percentage of Population Employed in Material Moving in Maryland is 2.9%.
What is the Percentage of Population Employed in Material Moving in the United States?
Percentage of Population Employed in Material Moving in the United States is 3.8%.