Cities with the Highest Percentage of Population Employed in Material Moving in Minnesota
RELATED REPORTS & OPTIONS
Material Moving
Minnesota
Compare Cities
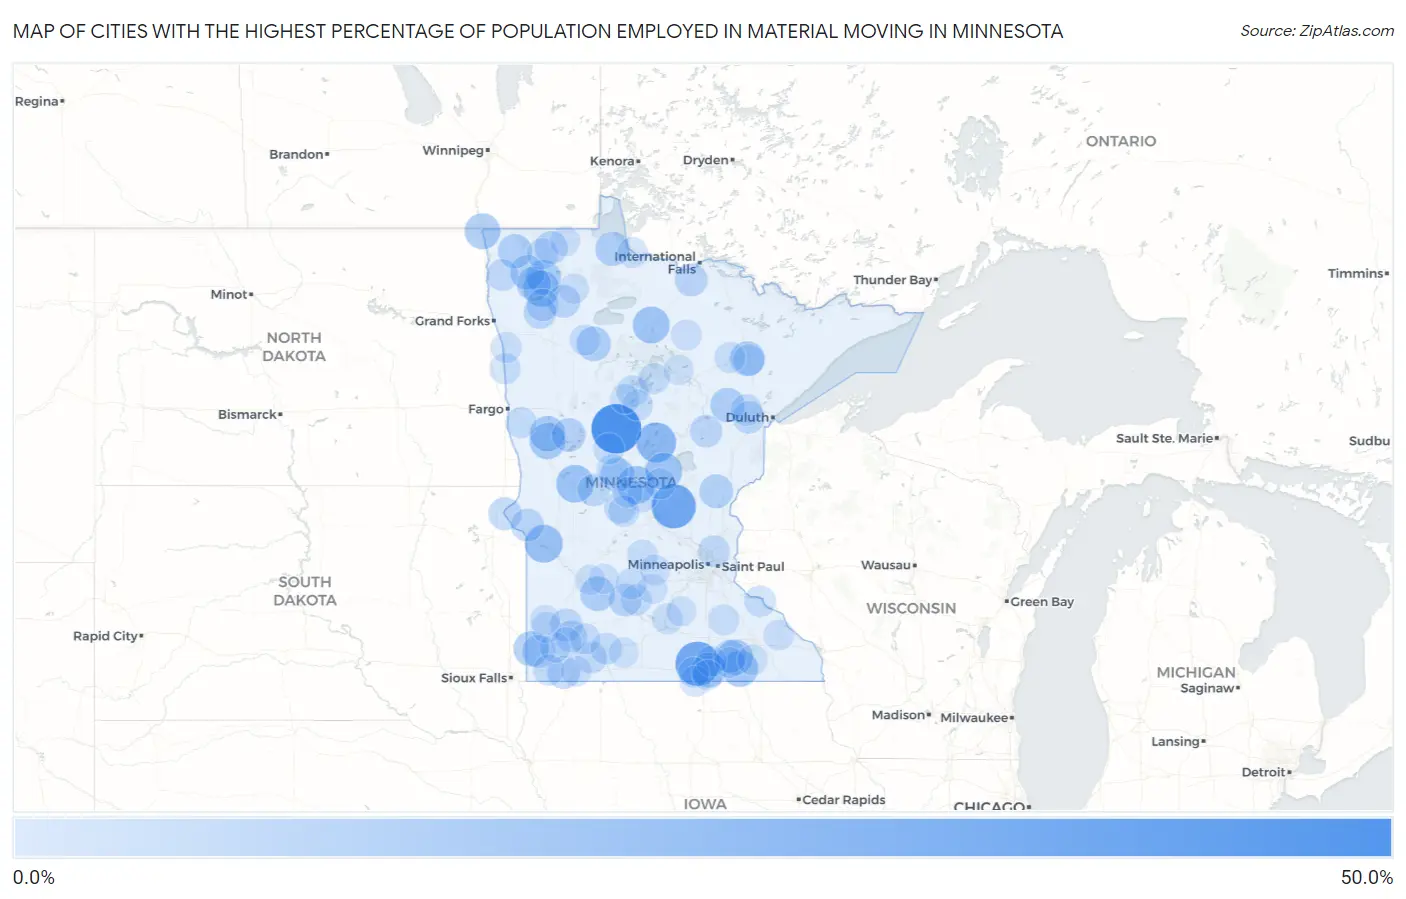
Map of Cities with the Highest Percentage of Population Employed in Material Moving in Minnesota
0.0%
50.0%
Cities with the Highest Percentage of Population Employed in Material Moving in Minnesota
| City | % Employed | vs State | vs National | |
| 1. | Nimrod | 42.9% | 3.4%(+39.4)#1 | 3.8%(+39.0)#135 |
| 2. | Ronneby | 33.3% | 3.4%(+29.9)#2 | 3.8%(+29.5)#245 |
| 3. | Manchester | 33.3% | 3.4%(+29.9)#3 | 3.8%(+29.5)#246 |
| 4. | Merrifield | 25.5% | 3.4%(+22.0)#4 | 3.8%(+21.7)#425 |
| 5. | Correll | 22.2% | 3.4%(+18.8)#5 | 3.8%(+18.4)#585 |
| 6. | Flensburg | 22.0% | 3.4%(+18.6)#6 | 3.8%(+18.2)#589 |
| 7. | Brandon | 21.6% | 3.4%(+18.2)#7 | 3.8%(+17.8)#617 |
| 8. | Harding | 20.7% | 3.4%(+17.2)#8 | 3.8%(+16.9)#676 |
| 9. | Northome | 20.6% | 3.4%(+17.1)#9 | 3.8%(+16.7)#689 |
| 10. | Holt | 19.2% | 3.4%(+15.8)#10 | 3.8%(+15.4)#778 |
| 11. | Elkton | 19.2% | 3.4%(+15.7)#11 | 3.8%(+15.3)#783 |
| 12. | Erhard | 18.8% | 3.4%(+15.3)#12 | 3.8%(+14.9)#823 |
| 13. | Sargeant | 18.8% | 3.4%(+15.3)#13 | 3.8%(+14.9)#827 |
| 14. | St Vincent | 18.5% | 3.4%(+15.1)#14 | 3.8%(+14.7)#852 |
| 15. | Pelican Rapids | 18.2% | 3.4%(+14.7)#15 | 3.8%(+14.3)#897 |
| 16. | Hayward | 17.5% | 3.4%(+14.0)#16 | 3.8%(+13.6)#978 |
| 17. | Ihlen | 17.4% | 3.4%(+14.0)#17 | 3.8%(+13.6)#991 |
| 18. | Leonidas | 17.2% | 3.4%(+13.8)#18 | 3.8%(+13.4)#1,007 |
| 19. | Middle River | 16.9% | 3.4%(+13.5)#19 | 3.8%(+13.1)#1,055 |
| 20. | Delhi | 16.7% | 3.4%(+13.2)#20 | 3.8%(+12.8)#1,093 |
| 21. | Leonard | 16.7% | 3.4%(+13.2)#21 | 3.8%(+12.8)#1,097 |
| 22. | Floodwood | 16.4% | 3.4%(+12.9)#22 | 3.8%(+12.5)#1,130 |
| 23. | Williams | 16.3% | 3.4%(+12.9)#23 | 3.8%(+12.5)#1,143 |
| 24. | Strandquist | 16.3% | 3.4%(+12.8)#24 | 3.8%(+12.4)#1,149 |
| 25. | Browerville | 16.3% | 3.4%(+12.8)#25 | 3.8%(+12.4)#1,153 |
| 26. | Newfolden | 16.2% | 3.4%(+12.7)#26 | 3.8%(+12.4)#1,163 |
| 27. | Lake Bronson | 15.7% | 3.4%(+12.2)#27 | 3.8%(+11.9)#1,246 |
| 28. | Henriette | 15.4% | 3.4%(+11.9)#28 | 3.8%(+11.6)#1,311 |
| 29. | Dent | 15.0% | 3.4%(+11.6)#29 | 3.8%(+11.2)#1,370 |
| 30. | Trosky | 14.3% | 3.4%(+10.8)#30 | 3.8%(+10.5)#1,544 |
| 31. | Browns Valley | 14.0% | 3.4%(+10.5)#31 | 3.8%(+10.2)#1,616 |
| 32. | Goodridge | 13.9% | 3.4%(+10.4)#32 | 3.8%(+10.1)#1,644 |
| 33. | Clinton | 13.8% | 3.4%(+10.3)#33 | 3.8%(+9.92)#1,684 |
| 34. | Littlefork | 13.7% | 3.4%(+10.3)#34 | 3.8%(+9.88)#1,700 |
| 35. | Waltham | 13.7% | 3.4%(+10.2)#35 | 3.8%(+9.85)#1,707 |
| 36. | Badger | 13.6% | 3.4%(+10.2)#36 | 3.8%(+9.81)#1,715 |
| 37. | Rushmore | 13.5% | 3.4%(+10.1)#37 | 3.8%(+9.72)#1,755 |
| 38. | Fairfax | 13.5% | 3.4%(+10.0)#38 | 3.8%(+9.64)#1,774 |
| 39. | St Hilaire | 13.3% | 3.4%(+9.89)#39 | 3.8%(+9.50)#1,809 |
| 40. | Garvin | 13.3% | 3.4%(+9.89)#40 | 3.8%(+9.50)#1,817 |
| 41. | Mcgregor | 13.1% | 3.4%(+9.65)#41 | 3.8%(+9.26)#1,893 |
| 42. | Nelson | 13.0% | 3.4%(+9.52)#42 | 3.8%(+9.13)#1,938 |
| 43. | Mahnomen | 12.8% | 3.4%(+9.38)#43 | 3.8%(+8.99)#1,990 |
| 44. | Thief River Falls | 12.8% | 3.4%(+9.38)#44 | 3.8%(+8.99)#1,995 |
| 45. | Stephen | 12.0% | 3.4%(+8.61)#45 | 3.8%(+8.22)#2,270 |
| 46. | Melrose | 12.0% | 3.4%(+8.59)#46 | 3.8%(+8.20)#2,275 |
| 47. | Lexington | 11.9% | 3.4%(+8.41)#47 | 3.8%(+8.02)#2,349 |
| 48. | Heron Lake | 11.8% | 3.4%(+8.36)#48 | 3.8%(+7.97)#2,371 |
| 49. | Currie | 11.8% | 3.4%(+8.32)#49 | 3.8%(+7.93)#2,391 |
| 50. | Walker | 11.7% | 3.4%(+8.24)#50 | 3.8%(+7.85)#2,427 |
| 51. | Bingham Lake | 11.7% | 3.4%(+8.23)#51 | 3.8%(+7.84)#2,433 |
| 52. | Brookston | 11.4% | 3.4%(+7.99)#52 | 3.8%(+7.60)#2,529 |
| 53. | Greenbush | 11.4% | 3.4%(+7.94)#53 | 3.8%(+7.55)#2,548 |
| 54. | Clarissa | 11.3% | 3.4%(+7.90)#54 | 3.8%(+7.51)#2,562 |
| 55. | Frontenac | 11.3% | 3.4%(+7.83)#55 | 3.8%(+7.44)#2,598 |
| 56. | Bowlus | 11.2% | 3.4%(+7.74)#56 | 3.8%(+7.35)#2,639 |
| 57. | Eveleth | 11.2% | 3.4%(+7.72)#57 | 3.8%(+7.33)#2,647 |
| 58. | Verndale | 11.1% | 3.4%(+7.67)#58 | 3.8%(+7.28)#2,670 |
| 59. | St Anthony City Stearns County | 11.1% | 3.4%(+7.67)#59 | 3.8%(+7.28)#2,688 |
| 60. | Magnolia | 10.9% | 3.4%(+7.48)#60 | 3.8%(+7.09)#2,770 |
| 61. | Federal Dam | 10.9% | 3.4%(+7.47)#61 | 3.8%(+7.08)#2,776 |
| 62. | Gibbon | 10.8% | 3.4%(+7.40)#62 | 3.8%(+7.01)#2,808 |
| 63. | New Munich | 10.7% | 3.4%(+7.30)#63 | 3.8%(+6.91)#2,852 |
| 64. | Baker | 10.7% | 3.4%(+7.27)#64 | 3.8%(+6.88)#2,869 |
| 65. | Buffalo Lake | 10.7% | 3.4%(+7.22)#65 | 3.8%(+6.83)#2,898 |
| 66. | Genola | 10.6% | 3.4%(+7.20)#66 | 3.8%(+6.81)#2,913 |
| 67. | Halstad | 10.6% | 3.4%(+7.14)#67 | 3.8%(+6.75)#2,932 |
| 68. | Kasota | 10.6% | 3.4%(+7.12)#68 | 3.8%(+6.73)#2,951 |
| 69. | Kenyon | 10.5% | 3.4%(+7.09)#69 | 3.8%(+6.70)#2,963 |
| 70. | Hackensack | 10.5% | 3.4%(+7.09)#70 | 3.8%(+6.70)#2,970 |
| 71. | Westbrook | 10.5% | 3.4%(+7.02)#71 | 3.8%(+6.63)#3,011 |
| 72. | Chisholm | 10.3% | 3.4%(+6.90)#72 | 3.8%(+6.51)#3,084 |
| 73. | Clearbrook | 10.3% | 3.4%(+6.88)#73 | 3.8%(+6.49)#3,095 |
| 74. | Emmons | 10.2% | 3.4%(+6.80)#74 | 3.8%(+6.41)#3,136 |
| 75. | Darwin | 10.2% | 3.4%(+6.72)#75 | 3.8%(+6.33)#3,184 |
| 76. | Climax | 10.1% | 3.4%(+6.69)#76 | 3.8%(+6.30)#3,208 |
| 77. | Brownsdale | 10.1% | 3.4%(+6.65)#77 | 3.8%(+6.26)#3,238 |
| 78. | Baudette | 10.0% | 3.4%(+6.61)#78 | 3.8%(+6.22)#3,261 |
| 79. | Hollandale | 10.0% | 3.4%(+6.56)#79 | 3.8%(+6.17)#3,293 |
| 80. | Racine | 9.9% | 3.4%(+6.48)#80 | 3.8%(+6.09)#3,349 |
| 81. | Ruthton | 9.9% | 3.4%(+6.47)#81 | 3.8%(+6.08)#3,361 |
| 82. | Slayton | 9.9% | 3.4%(+6.46)#82 | 3.8%(+6.07)#3,366 |
| 83. | Bigfork | 9.9% | 3.4%(+6.45)#83 | 3.8%(+6.06)#3,372 |
| 84. | Conger | 9.8% | 3.4%(+6.40)#84 | 3.8%(+6.01)#3,404 |
| 85. | Elba | 9.8% | 3.4%(+6.36)#85 | 3.8%(+5.97)#3,433 |
| 86. | Silver Lake | 9.8% | 3.4%(+6.35)#86 | 3.8%(+5.96)#3,441 |
| 87. | Worthington | 9.6% | 3.4%(+6.15)#87 | 3.8%(+5.76)#3,581 |
| 88. | Chandler | 9.5% | 3.4%(+6.08)#88 | 3.8%(+5.69)#3,628 |
| 89. | Burtrum | 9.5% | 3.4%(+6.08)#89 | 3.8%(+5.69)#3,633 |
| 90. | Glenville | 9.5% | 3.4%(+6.04)#90 | 3.8%(+5.65)#3,673 |
| 91. | Danube | 9.4% | 3.4%(+5.98)#91 | 3.8%(+5.59)#3,742 |
| 92. | New Auburn | 9.4% | 3.4%(+5.93)#92 | 3.8%(+5.54)#3,767 |
| 93. | Roseau | 9.4% | 3.4%(+5.92)#93 | 3.8%(+5.53)#3,785 |
| 94. | Deer River | 9.3% | 3.4%(+5.87)#94 | 3.8%(+5.48)#3,817 |
| 95. | Sacred Heart | 9.3% | 3.4%(+5.85)#95 | 3.8%(+5.46)#3,828 |
| 96. | Akeley | 9.2% | 3.4%(+5.80)#96 | 3.8%(+5.41)#3,865 |
| 97. | Grygla | 9.2% | 3.4%(+5.80)#97 | 3.8%(+5.41)#3,866 |
| 98. | Odin | 9.2% | 3.4%(+5.79)#98 | 3.8%(+5.40)#3,874 |
| 99. | Le Center | 9.2% | 3.4%(+5.74)#99 | 3.8%(+5.35)#3,917 |
| 100. | Tyler | 9.2% | 3.4%(+5.74)#100 | 3.8%(+5.35)#3,921 |
Common Questions
What are the Top 10 Cities with the Highest Percentage of Population Employed in Material Moving in Minnesota?
Top 10 Cities with the Highest Percentage of Population Employed in Material Moving in Minnesota are:
#1
42.9%
#2
33.3%
#3
33.3%
#4
25.5%
#5
22.2%
#6
22.0%
#7
21.6%
#8
20.7%
#9
20.6%
#10
19.2%
What city has the Highest Percentage of Population Employed in Material Moving in Minnesota?
Nimrod has the Highest Percentage of Population Employed in Material Moving in Minnesota with 42.9%.
What is the Percentage of Population Employed in Material Moving in the State of Minnesota?
Percentage of Population Employed in Material Moving in Minnesota is 3.4%.
What is the Percentage of Population Employed in Material Moving in the United States?
Percentage of Population Employed in Material Moving in the United States is 3.8%.