Cities with the Highest Percentage of Population Employed in Material Moving in New York
RELATED REPORTS & OPTIONS
Material Moving
New York
Compare Cities
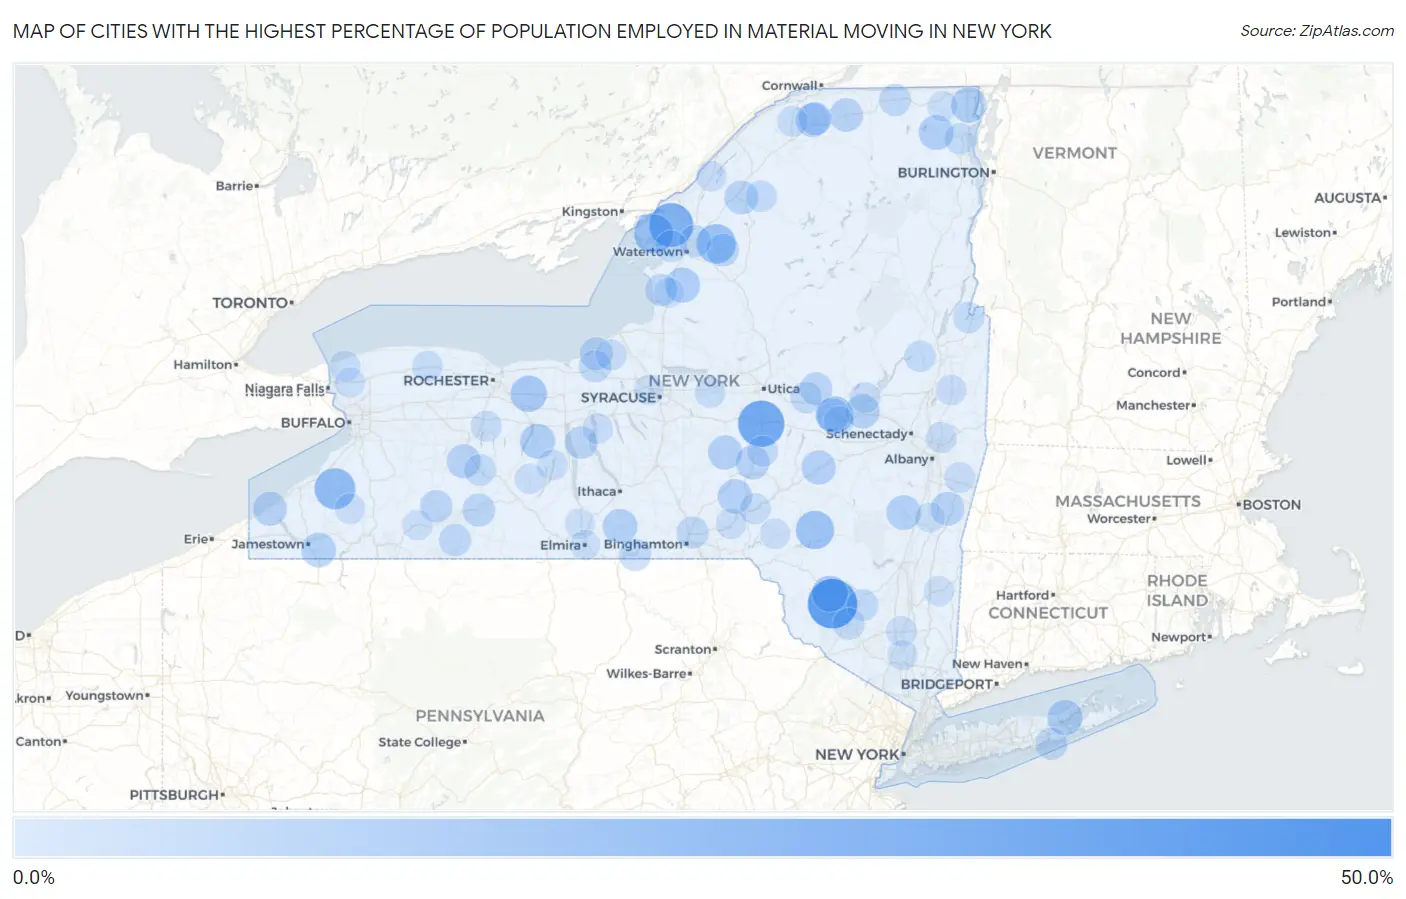
Map of Cities with the Highest Percentage of Population Employed in Material Moving in New York
0.0%
50.0%
Cities with the Highest Percentage of Population Employed in Material Moving in New York
| City | % Employed | vs State | vs National | |
| 1. | Wells Bridge | 41.5% | 2.5%(+39.0)#1 | 3.8%(+37.6)#154 |
| 2. | South Fallsburg | 35.9% | 2.5%(+33.4)#2 | 3.8%(+32.0)#207 |
| 3. | East Durham | 33.9% | 2.5%(+31.4)#3 | 3.8%(+30.1)#235 |
| 4. | Bridgewater | 31.2% | 2.5%(+28.7)#4 | 3.8%(+27.4)#285 |
| 5. | North Blenheim | 31.0% | 2.5%(+28.5)#5 | 3.8%(+27.1)#288 |
| 6. | Depauville | 27.8% | 2.5%(+25.3)#6 | 3.8%(+24.0)#355 |
| 7. | Springfield Center | 24.4% | 2.5%(+21.9)#7 | 3.8%(+20.6)#470 |
| 8. | Perrysburg | 23.3% | 2.5%(+20.8)#8 | 3.8%(+19.4)#525 |
| 9. | Three Mile Bay | 21.1% | 2.5%(+18.6)#9 | 3.8%(+17.2)#656 |
| 10. | Herrings | 21.1% | 2.5%(+18.6)#10 | 3.8%(+17.2)#658 |
| 11. | Andes | 19.6% | 2.5%(+17.1)#11 | 3.8%(+15.8)#754 |
| 12. | Rosendale | 18.9% | 2.5%(+16.4)#12 | 3.8%(+15.1)#811 |
| 13. | East Worcester | 18.1% | 2.5%(+15.6)#13 | 3.8%(+14.3)#900 |
| 14. | Nelliston | 17.8% | 2.5%(+15.3)#14 | 3.8%(+14.0)#929 |
| 15. | Macedon | 16.9% | 2.5%(+14.4)#15 | 3.8%(+13.1)#1,051 |
| 16. | Loch Sheldrake | 16.5% | 2.5%(+14.0)#16 | 3.8%(+12.6)#1,119 |
| 17. | Chazy | 15.5% | 2.5%(+13.0)#17 | 3.8%(+11.7)#1,280 |
| 18. | South Edmeston | 15.2% | 2.5%(+12.7)#18 | 3.8%(+11.4)#1,334 |
| 19. | Jamesport | 15.0% | 2.5%(+12.5)#19 | 3.8%(+11.2)#1,374 |
| 20. | Lorraine | 15.0% | 2.5%(+12.5)#20 | 3.8%(+11.2)#1,382 |
| 21. | Kiamesha Lake | 15.0% | 2.5%(+12.5)#21 | 3.8%(+11.1)#1,384 |
| 22. | Rushville | 14.8% | 2.5%(+12.3)#22 | 3.8%(+10.9)#1,424 |
| 23. | Dannemora | 14.7% | 2.5%(+12.2)#23 | 3.8%(+10.8)#1,450 |
| 24. | Spencer | 14.4% | 2.5%(+11.9)#24 | 3.8%(+10.6)#1,505 |
| 25. | Cairo | 14.3% | 2.5%(+11.8)#25 | 3.8%(+10.5)#1,526 |
| 26. | Frewsburg | 14.2% | 2.5%(+11.8)#26 | 3.8%(+10.4)#1,560 |
| 27. | Hankins | 14.1% | 2.5%(+11.6)#27 | 3.8%(+10.2)#1,597 |
| 28. | Guilford | 13.9% | 2.5%(+11.4)#28 | 3.8%(+10.1)#1,633 |
| 29. | Fonda | 13.8% | 2.5%(+11.3)#29 | 3.8%(+9.94)#1,679 |
| 30. | Smyrna | 13.8% | 2.5%(+11.3)#30 | 3.8%(+9.92)#1,685 |
| 31. | Marcy | 13.7% | 2.5%(+11.2)#31 | 3.8%(+9.86)#1,703 |
| 32. | Worcester | 13.6% | 2.5%(+11.1)#32 | 3.8%(+9.79)#1,729 |
| 33. | Winthrop | 13.6% | 2.5%(+11.1)#33 | 3.8%(+9.77)#1,734 |
| 34. | Tuscarora | 13.5% | 2.5%(+11.0)#34 | 3.8%(+9.63)#1,779 |
| 35. | Hailesboro | 13.4% | 2.5%(+11.0)#35 | 3.8%(+9.60)#1,784 |
| 36. | Westfield | 13.4% | 2.5%(+10.9)#36 | 3.8%(+9.53)#1,798 |
| 37. | Ghent | 13.3% | 2.5%(+10.8)#37 | 3.8%(+9.48)#1,823 |
| 38. | New Berlin | 13.2% | 2.5%(+10.8)#38 | 3.8%(+9.40)#1,839 |
| 39. | Brushton | 13.2% | 2.5%(+10.7)#39 | 3.8%(+9.37)#1,853 |
| 40. | Fort Plain | 13.1% | 2.5%(+10.6)#40 | 3.8%(+9.27)#1,888 |
| 41. | Schuyler Lake | 13.0% | 2.5%(+10.6)#41 | 3.8%(+9.21)#1,913 |
| 42. | East Herkimer | 12.7% | 2.5%(+10.3)#42 | 3.8%(+8.90)#2,019 |
| 43. | Brasher Falls | 12.4% | 2.5%(+9.95)#43 | 3.8%(+8.60)#2,133 |
| 44. | Mclean | 12.4% | 2.5%(+9.90)#44 | 3.8%(+8.55)#2,151 |
| 45. | Almond | 12.0% | 2.5%(+9.54)#45 | 3.8%(+8.19)#2,282 |
| 46. | Carthage | 11.9% | 2.5%(+9.44)#46 | 3.8%(+8.09)#2,318 |
| 47. | Fair Haven | 11.8% | 2.5%(+9.35)#47 | 3.8%(+8.00)#2,355 |
| 48. | Romulus | 11.8% | 2.5%(+9.29)#48 | 3.8%(+7.93)#2,388 |
| 49. | Dolgeville | 11.6% | 2.5%(+9.09)#49 | 3.8%(+7.74)#2,474 |
| 50. | Belfast | 11.4% | 2.5%(+8.93)#50 | 3.8%(+7.58)#2,537 |
| 51. | Chenango Bridge | 11.2% | 2.5%(+8.68)#51 | 3.8%(+7.33)#2,648 |
| 52. | Ellisburg | 11.1% | 2.5%(+8.63)#52 | 3.8%(+7.28)#2,680 |
| 53. | West Hampton Dunes | 11.1% | 2.5%(+8.63)#53 | 3.8%(+7.28)#2,684 |
| 54. | Calcium | 11.1% | 2.5%(+8.61)#54 | 3.8%(+7.26)#2,695 |
| 55. | Wellsville | 11.0% | 2.5%(+8.51)#55 | 3.8%(+7.15)#2,739 |
| 56. | Red Creek | 11.0% | 2.5%(+8.47)#56 | 3.8%(+7.12)#2,754 |
| 57. | Nichols | 10.9% | 2.5%(+8.41)#57 | 3.8%(+7.06)#2,785 |
| 58. | Chateaugay | 10.7% | 2.5%(+8.26)#58 | 3.8%(+6.91)#2,853 |
| 59. | Ellenville | 10.6% | 2.5%(+8.07)#59 | 3.8%(+6.72)#2,956 |
| 60. | Dexter | 10.4% | 2.5%(+7.89)#60 | 3.8%(+6.54)#3,066 |
| 61. | Wurtsboro | 10.4% | 2.5%(+7.89)#61 | 3.8%(+6.53)#3,070 |
| 62. | Woodsville | 10.3% | 2.5%(+7.87)#62 | 3.8%(+6.51)#3,081 |
| 63. | Little Falls | 10.3% | 2.5%(+7.83)#63 | 3.8%(+6.48)#3,101 |
| 64. | Edwards | 10.0% | 2.5%(+7.52)#64 | 3.8%(+6.17)#3,290 |
| 65. | Plattsburgh West | 9.9% | 2.5%(+7.39)#65 | 3.8%(+6.04)#3,381 |
| 66. | Hadley | 9.7% | 2.5%(+7.24)#66 | 3.8%(+5.89)#3,493 |
| 67. | Whitehall | 9.7% | 2.5%(+7.18)#67 | 3.8%(+5.83)#3,533 |
| 68. | Hannibal | 9.6% | 2.5%(+7.09)#68 | 3.8%(+5.73)#3,600 |
| 69. | Unadilla | 9.5% | 2.5%(+7.06)#69 | 3.8%(+5.70)#3,616 |
| 70. | Ransomville | 9.3% | 2.5%(+6.87)#70 | 3.8%(+5.52)#3,795 |
| 71. | South Lima | 9.3% | 2.5%(+6.82)#71 | 3.8%(+5.47)#3,822 |
| 72. | Fort Covington | 9.3% | 2.5%(+6.81)#72 | 3.8%(+5.46)#3,832 |
| 73. | Edmeston | 9.2% | 2.5%(+6.72)#73 | 3.8%(+5.37)#3,892 |
| 74. | Norfolk | 9.2% | 2.5%(+6.72)#74 | 3.8%(+5.37)#3,893 |
| 75. | Waterford | 9.2% | 2.5%(+6.69)#75 | 3.8%(+5.34)#3,934 |
| 76. | Wampsville | 9.2% | 2.5%(+6.68)#76 | 3.8%(+5.33)#3,937 |
| 77. | Gloversville | 9.1% | 2.5%(+6.66)#77 | 3.8%(+5.31)#3,960 |
| 78. | Albion | 9.1% | 2.5%(+6.62)#78 | 3.8%(+5.27)#3,981 |
| 79. | East Nassau | 9.1% | 2.5%(+6.57)#79 | 3.8%(+5.22)#4,034 |
| 80. | Afton | 9.0% | 2.5%(+6.54)#80 | 3.8%(+5.19)#4,063 |
| 81. | Keuka Park | 9.0% | 2.5%(+6.52)#81 | 3.8%(+5.17)#4,085 |
| 82. | Union Springs | 8.9% | 2.5%(+6.37)#82 | 3.8%(+5.02)#4,188 |
| 83. | Cattaraugus | 8.8% | 2.5%(+6.30)#83 | 3.8%(+4.95)#4,247 |
| 84. | Hammond | 8.7% | 2.5%(+6.22)#84 | 3.8%(+4.87)#4,315 |
| 85. | Balmville | 8.6% | 2.5%(+6.15)#85 | 3.8%(+4.80)#4,377 |
| 86. | Walton | 8.6% | 2.5%(+6.15)#86 | 3.8%(+4.80)#4,383 |
| 87. | Prattsburgh | 8.6% | 2.5%(+6.12)#87 | 3.8%(+4.77)#4,422 |
| 88. | Victory | 8.6% | 2.5%(+6.11)#88 | 3.8%(+4.76)#4,426 |
| 89. | Niagara University | 8.6% | 2.5%(+6.09)#89 | 3.8%(+4.74)#4,437 |
| 90. | Cuba | 8.5% | 2.5%(+6.00)#90 | 3.8%(+4.65)#4,520 |
| 91. | Sanborn | 8.5% | 2.5%(+5.99)#91 | 3.8%(+4.64)#4,528 |
| 92. | Pine Valley | 8.4% | 2.5%(+5.95)#92 | 3.8%(+4.59)#4,578 |
| 93. | Millbrook | 8.4% | 2.5%(+5.88)#93 | 3.8%(+4.53)#4,654 |
| 94. | Elmira | 8.4% | 2.5%(+5.87)#94 | 3.8%(+4.52)#4,658 |
| 95. | West Point | 8.3% | 2.5%(+5.86)#95 | 3.8%(+4.51)#4,662 |
| 96. | Lakeland | 8.3% | 2.5%(+5.85)#96 | 3.8%(+4.50)#4,663 |
| 97. | Mannsville | 8.3% | 2.5%(+5.85)#97 | 3.8%(+4.50)#4,667 |
| 98. | Lorenz Park | 8.3% | 2.5%(+5.82)#98 | 3.8%(+4.47)#4,708 |
| 99. | Canajoharie | 8.3% | 2.5%(+5.77)#99 | 3.8%(+4.42)#4,762 |
| 100. | Altona | 8.2% | 2.5%(+5.74)#100 | 3.8%(+4.39)#4,798 |
Common Questions
What are the Top 10 Cities with the Highest Percentage of Population Employed in Material Moving in New York?
Top 10 Cities with the Highest Percentage of Population Employed in Material Moving in New York are:
#1
35.9%
#2
31.2%
#3
27.8%
#4
23.3%
#5
21.1%
#6
21.1%
#7
19.6%
#8
17.8%
#9
16.9%
#10
16.5%
What city has the Highest Percentage of Population Employed in Material Moving in New York?
South Fallsburg has the Highest Percentage of Population Employed in Material Moving in New York with 35.9%.
What is the Percentage of Population Employed in Material Moving in the State of New York?
Percentage of Population Employed in Material Moving in New York is 2.5%.
What is the Percentage of Population Employed in Material Moving in the United States?
Percentage of Population Employed in Material Moving in the United States is 3.8%.