Cities with the Highest Percentage of Population Employed in Material Moving in Arizona
RELATED REPORTS & OPTIONS
Material Moving
Arizona
Compare Cities
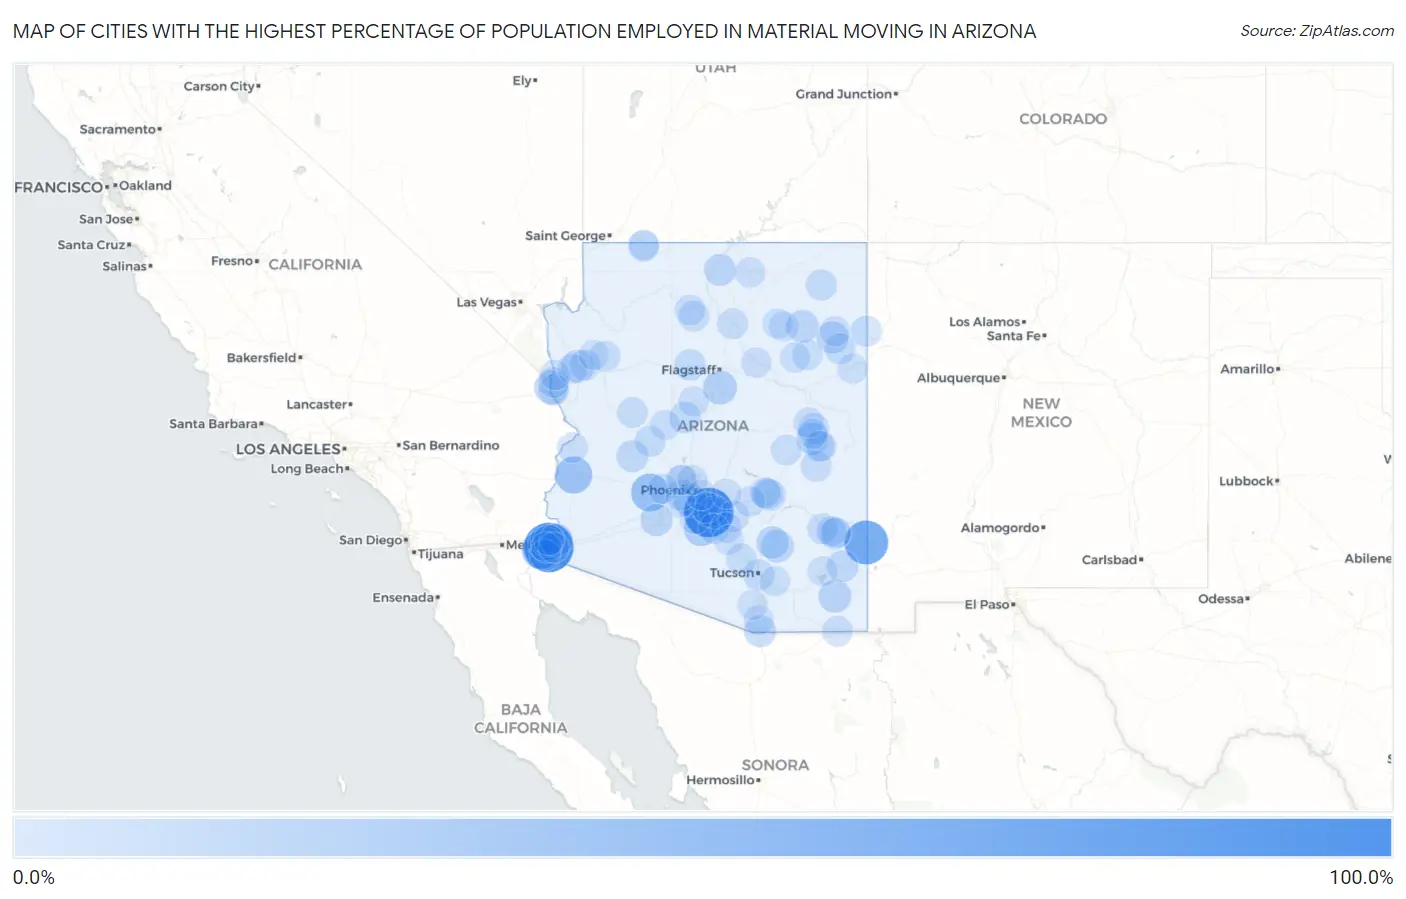
Map of Cities with the Highest Percentage of Population Employed in Material Moving in Arizona
0.0%
100.0%
Cities with the Highest Percentage of Population Employed in Material Moving in Arizona
| City | % Employed | vs State | vs National | |
| 1. | Rancho Mesa Verde | 100.0% | 3.6%(+96.4)#1 | 3.8%(+96.2)#1 |
| 2. | Sweet Water Village | 100.0% | 3.6%(+96.4)#2 | 3.8%(+96.2)#6 |
| 3. | Franklin | 71.0% | 3.6%(+67.4)#3 | 3.8%(+67.2)#45 |
| 4. | Gadsden | 43.8% | 3.6%(+40.2)#4 | 3.8%(+40.0)#131 |
| 5. | Wintersburg | 41.4% | 3.6%(+37.8)#5 | 3.8%(+37.6)#155 |
| 6. | Quartzsite | 37.3% | 3.6%(+33.7)#6 | 3.8%(+33.5)#191 |
| 7. | Stanfield | 25.4% | 3.6%(+21.8)#7 | 3.8%(+21.6)#427 |
| 8. | Munds Park | 22.4% | 3.6%(+18.8)#8 | 3.8%(+18.5)#574 |
| 9. | Mormon Lake | 21.9% | 3.6%(+18.3)#9 | 3.8%(+18.0)#600 |
| 10. | Wall Lane | 21.3% | 3.6%(+17.7)#10 | 3.8%(+17.5)#638 |
| 11. | Donovan Estates | 21.1% | 3.6%(+17.5)#11 | 3.8%(+17.2)#652 |
| 12. | Stotonic Village | 20.2% | 3.6%(+16.6)#12 | 3.8%(+16.4)#712 |
| 13. | Willow Valley | 20.1% | 3.6%(+16.5)#13 | 3.8%(+16.3)#715 |
| 14. | Komatke | 19.4% | 3.6%(+15.8)#14 | 3.8%(+15.6)#767 |
| 15. | El Prado Estates | 17.9% | 3.6%(+14.3)#15 | 3.8%(+14.1)#914 |
| 16. | Sunizona | 17.5% | 3.6%(+13.9)#16 | 3.8%(+13.7)#967 |
| 17. | Upper Santan Village | 16.5% | 3.6%(+12.9)#17 | 3.8%(+12.7)#1,113 |
| 18. | So Hi | 16.1% | 3.6%(+12.5)#18 | 3.8%(+12.3)#1,171 |
| 19. | San Manuel | 16.1% | 3.6%(+12.5)#19 | 3.8%(+12.3)#1,175 |
| 20. | Keams Canyon | 15.8% | 3.6%(+12.2)#20 | 3.8%(+12.0)#1,216 |
| 21. | Mammoth | 14.7% | 3.6%(+11.1)#21 | 3.8%(+10.8)#1,446 |
| 22. | Gila Bend | 13.8% | 3.6%(+10.2)#22 | 3.8%(+9.93)#1,681 |
| 23. | Bitter Springs | 13.1% | 3.6%(+9.52)#23 | 3.8%(+9.28)#1,884 |
| 24. | Nogales | 13.1% | 3.6%(+9.46)#24 | 3.8%(+9.23)#1,897 |
| 25. | Cornfields | 13.0% | 3.6%(+9.44)#25 | 3.8%(+9.21)#1,904 |
| 26. | Aguila | 12.9% | 3.6%(+9.33)#26 | 3.8%(+9.09)#1,954 |
| 27. | Bowie | 12.2% | 3.6%(+8.60)#27 | 3.8%(+8.36)#2,222 |
| 28. | Wagon Wheel | 12.0% | 3.6%(+8.36)#28 | 3.8%(+8.13)#2,303 |
| 29. | Pinal | 11.1% | 3.6%(+7.51)#29 | 3.8%(+7.28)#2,675 |
| 30. | Dewey Humboldt | 10.9% | 3.6%(+7.35)#30 | 3.8%(+7.12)#2,759 |
| 31. | Williams | 10.5% | 3.6%(+6.94)#31 | 3.8%(+6.71)#2,960 |
| 32. | South Tucson | 9.7% | 3.6%(+6.14)#32 | 3.8%(+5.91)#3,480 |
| 33. | Solomon | 9.7% | 3.6%(+6.11)#33 | 3.8%(+5.88)#3,500 |
| 34. | Oak Creek Canyon | 9.7% | 3.6%(+6.08)#34 | 3.8%(+5.85)#3,525 |
| 35. | Rough Rock | 9.4% | 3.6%(+5.82)#35 | 3.8%(+5.59)#3,740 |
| 36. | White Mountain Lake | 9.2% | 3.6%(+5.62)#36 | 3.8%(+5.39)#3,881 |
| 37. | Fort Defiance | 9.2% | 3.6%(+5.58)#37 | 3.8%(+5.35)#3,912 |
| 38. | Klagetoh | 9.1% | 3.6%(+5.49)#38 | 3.8%(+5.26)#4,008 |
| 39. | Congress | 8.6% | 3.6%(+4.96)#39 | 3.8%(+4.73)#4,455 |
| 40. | Hondah | 8.0% | 3.6%(+4.44)#40 | 3.8%(+4.21)#4,992 |
| 41. | Florence | 8.0% | 3.6%(+4.43)#41 | 3.8%(+4.20)#5,000 |
| 42. | Centennial Park | 8.0% | 3.6%(+4.40)#42 | 3.8%(+4.17)#5,025 |
| 43. | New Kingman Butler | 7.9% | 3.6%(+4.29)#43 | 3.8%(+4.05)#5,187 |
| 44. | Cameron | 7.8% | 3.6%(+4.23)#44 | 3.8%(+4.00)#5,267 |
| 45. | Ak Chin Village | 7.7% | 3.6%(+4.09)#45 | 3.8%(+3.86)#5,414 |
| 46. | Valentine | 7.7% | 3.6%(+4.09)#46 | 3.8%(+3.86)#5,446 |
| 47. | Tusayan | 7.7% | 3.6%(+4.07)#47 | 3.8%(+3.83)#5,473 |
| 48. | Cibecue | 7.4% | 3.6%(+3.78)#48 | 3.8%(+3.54)#5,845 |
| 49. | Pima | 7.4% | 3.6%(+3.75)#49 | 3.8%(+3.52)#5,875 |
| 50. | Seven Mile | 7.3% | 3.6%(+3.74)#50 | 3.8%(+3.51)#5,884 |
| 51. | Avondale | 7.2% | 3.6%(+3.64)#51 | 3.8%(+3.41)#6,042 |
| 52. | Central Heights Midland City | 7.1% | 3.6%(+3.48)#52 | 3.8%(+3.25)#6,248 |
| 53. | Mohave Valley | 7.0% | 3.6%(+3.44)#53 | 3.8%(+3.21)#6,316 |
| 54. | San Luis | 7.0% | 3.6%(+3.42)#54 | 3.8%(+3.19)#6,346 |
| 55. | Pirtleville | 6.9% | 3.6%(+3.30)#55 | 3.8%(+3.07)#6,531 |
| 56. | Nelson | 6.8% | 3.6%(+3.24)#56 | 3.8%(+3.01)#6,635 |
| 57. | Goodyear Village | 6.8% | 3.6%(+3.17)#57 | 3.8%(+2.94)#6,743 |
| 58. | Bagdad | 6.8% | 3.6%(+3.16)#58 | 3.8%(+2.93)#6,754 |
| 59. | Fort Mohave | 6.6% | 3.6%(+2.97)#59 | 3.8%(+2.74)#7,068 |
| 60. | Grand Canyon Village | 6.1% | 3.6%(+2.48)#60 | 3.8%(+2.25)#7,893 |
| 61. | Bullhead City | 6.0% | 3.6%(+2.42)#61 | 3.8%(+2.19)#8,008 |
| 62. | San Jose | 6.0% | 3.6%(+2.36)#62 | 3.8%(+2.13)#8,122 |
| 63. | Safford | 5.9% | 3.6%(+2.34)#63 | 3.8%(+2.11)#8,159 |
| 64. | Indian Wells | 5.9% | 3.6%(+2.28)#64 | 3.8%(+2.05)#8,265 |
| 65. | Parker | 5.8% | 3.6%(+2.23)#65 | 3.8%(+1.99)#8,388 |
| 66. | Mcnary | 5.8% | 3.6%(+2.20)#66 | 3.8%(+1.97)#8,438 |
| 67. | Leupp | 5.7% | 3.6%(+2.12)#67 | 3.8%(+1.88)#8,602 |
| 68. | Jerome | 5.7% | 3.6%(+2.10)#68 | 3.8%(+1.87)#8,645 |
| 69. | Casa Grande | 5.5% | 3.6%(+1.93)#69 | 3.8%(+1.70)#9,001 |
| 70. | Burnside | 5.5% | 3.6%(+1.92)#70 | 3.8%(+1.69)#9,028 |
| 71. | Kaibito | 5.5% | 3.6%(+1.91)#71 | 3.8%(+1.68)#9,037 |
| 72. | Coolidge | 5.5% | 3.6%(+1.91)#72 | 3.8%(+1.68)#9,040 |
| 73. | Claypool | 5.5% | 3.6%(+1.89)#73 | 3.8%(+1.66)#9,080 |
| 74. | Somerton | 5.4% | 3.6%(+1.76)#74 | 3.8%(+1.53)#9,338 |
| 75. | Taylor | 5.3% | 3.6%(+1.75)#75 | 3.8%(+1.51)#9,380 |
| 76. | Superior | 5.2% | 3.6%(+1.61)#76 | 3.8%(+1.38)#9,695 |
| 77. | Glendale | 5.2% | 3.6%(+1.57)#77 | 3.8%(+1.34)#9,787 |
| 78. | Dilkon | 5.1% | 3.6%(+1.55)#78 | 3.8%(+1.32)#9,840 |
| 79. | Kykotsmovi Village | 5.0% | 3.6%(+1.45)#79 | 3.8%(+1.22)#10,049 |
| 80. | Yuma | 5.0% | 3.6%(+1.42)#80 | 3.8%(+1.19)#10,102 |
| 81. | Wilhoit | 5.0% | 3.6%(+1.40)#81 | 3.8%(+1.17)#10,136 |
| 82. | Golden Valley | 4.9% | 3.6%(+1.33)#82 | 3.8%(+1.10)#10,301 |
| 83. | Picacho | 4.9% | 3.6%(+1.30)#83 | 3.8%(+1.07)#10,376 |
| 84. | El Mirage | 4.9% | 3.6%(+1.29)#84 | 3.8%(+1.06)#10,414 |
| 85. | Rio Rico | 4.8% | 3.6%(+1.16)#85 | 3.8%(+0.929)#10,778 |
| 86. | Goodyear | 4.7% | 3.6%(+1.13)#86 | 3.8%(+0.898)#10,856 |
| 87. | Rincon Valley | 4.7% | 3.6%(+1.10)#87 | 3.8%(+0.867)#10,937 |
| 88. | Shongopovi | 4.7% | 3.6%(+1.06)#88 | 3.8%(+0.831)#11,028 |
| 89. | Guadalupe | 4.6% | 3.6%(+1.04)#89 | 3.8%(+0.811)#11,094 |
| 90. | Buckeye | 4.6% | 3.6%(+1.02)#90 | 3.8%(+0.793)#11,143 |
| 91. | Willcox | 4.5% | 3.6%(+0.924)#91 | 3.8%(+0.693)#11,400 |
| 92. | Colorado City | 4.5% | 3.6%(+0.919)#92 | 3.8%(+0.687)#11,424 |
| 93. | Show Low | 4.5% | 3.6%(+0.913)#93 | 3.8%(+0.681)#11,437 |
| 94. | Phoenix | 4.5% | 3.6%(+0.881)#94 | 3.8%(+0.650)#11,518 |
| 95. | Valle Vista | 4.5% | 3.6%(+0.872)#95 | 3.8%(+0.641)#11,549 |
| 96. | Kaibab Estates West | 4.3% | 3.6%(+0.737)#96 | 3.8%(+0.506)#11,912 |
| 97. | Apache Junction | 4.3% | 3.6%(+0.733)#97 | 3.8%(+0.502)#11,926 |
| 98. | Sanders | 4.2% | 3.6%(+0.638)#98 | 3.8%(+0.407)#12,194 |
| 99. | Arivaca Junction | 4.2% | 3.6%(+0.618)#99 | 3.8%(+0.387)#12,251 |
| 100. | Avenue B And C | 4.2% | 3.6%(+0.589)#100 | 3.8%(+0.358)#12,344 |
Common Questions
What are the Top 10 Cities with the Highest Percentage of Population Employed in Material Moving in Arizona?
Top 10 Cities with the Highest Percentage of Population Employed in Material Moving in Arizona are:
#1
100.0%
#2
100.0%
#3
71.0%
#4
43.8%
#5
41.4%
#6
37.3%
#7
25.4%
#8
22.4%
#9
21.3%
#10
21.1%
What city has the Highest Percentage of Population Employed in Material Moving in Arizona?
Rancho Mesa Verde has the Highest Percentage of Population Employed in Material Moving in Arizona with 100.0%.
What is the Percentage of Population Employed in Material Moving in the State of Arizona?
Percentage of Population Employed in Material Moving in Arizona is 3.6%.
What is the Percentage of Population Employed in Material Moving in the United States?
Percentage of Population Employed in Material Moving in the United States is 3.8%.