Cities with the Highest Percentage of Population Employed in Material Moving in Texas
RELATED REPORTS & OPTIONS
Material Moving
Texas
Compare Cities
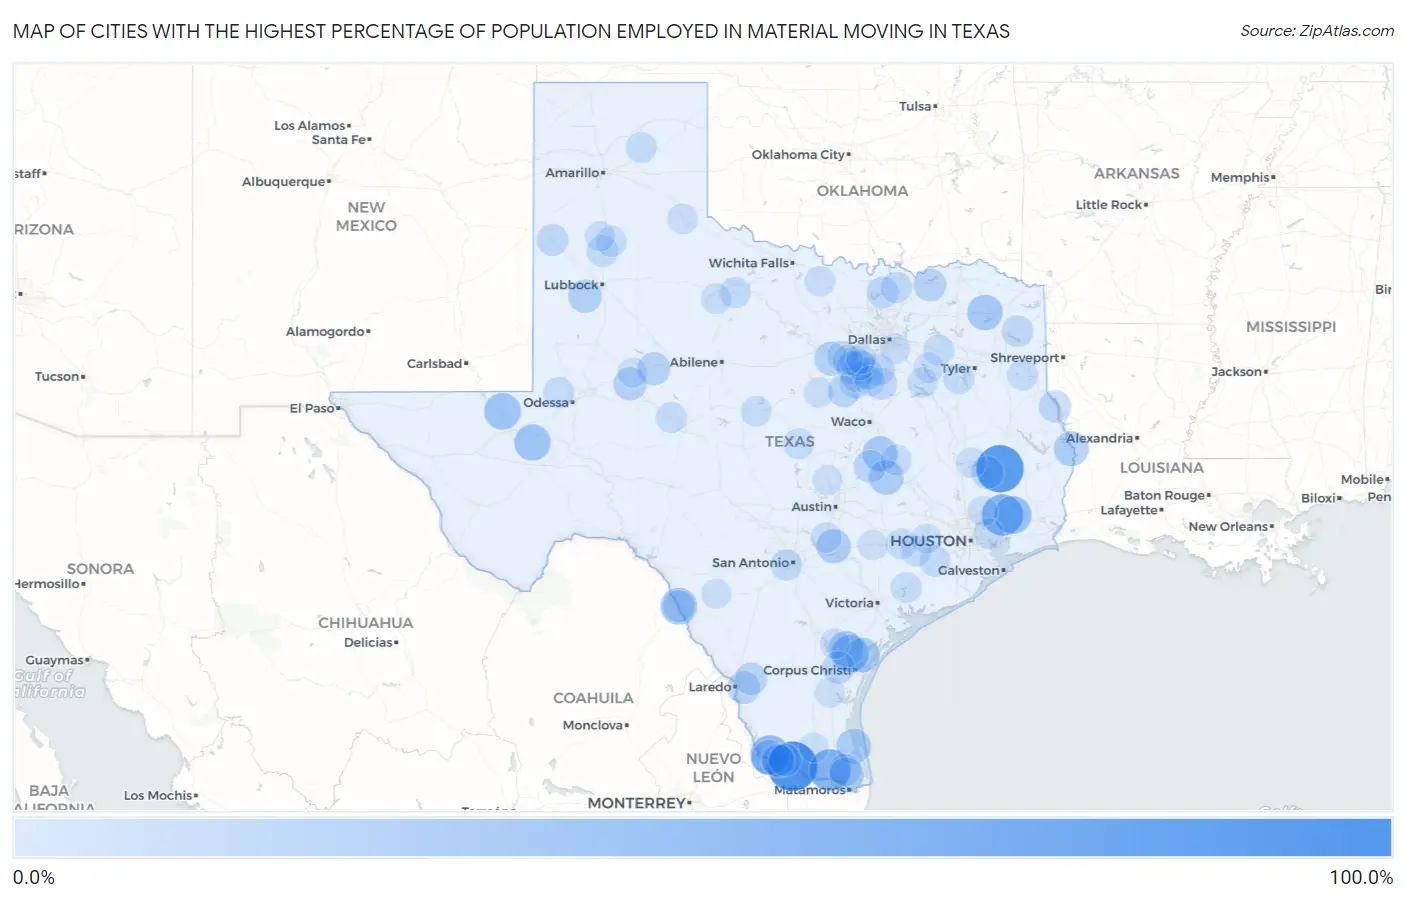
Map of Cities with the Highest Percentage of Population Employed in Material Moving in Texas
0.0%
100.0%
Cities with the Highest Percentage of Population Employed in Material Moving in Texas
| City | % Employed | vs State | vs National | |
| 1. | Havana | 100.0% | 3.9%(+96.1)#1 | 3.8%(+96.2)#2 |
| 2. | Harwood | 100.0% | 3.9%(+96.1)#2 | 3.8%(+96.2)#19 |
| 3. | Seven Oaks | 90.0% | 3.9%(+86.1)#3 | 3.8%(+86.2)#33 |
| 4. | Ratamosa | 63.3% | 3.9%(+59.5)#4 | 3.8%(+59.5)#58 |
| 5. | Dayton Lakes | 62.5% | 3.9%(+58.6)#5 | 3.8%(+58.7)#60 |
| 6. | La Esperanza | 53.3% | 3.9%(+49.5)#6 | 3.8%(+49.5)#88 |
| 7. | Hull | 46.7% | 3.9%(+42.9)#7 | 3.8%(+42.9)#117 |
| 8. | La Paloma Addition | 44.3% | 3.9%(+40.4)#8 | 3.8%(+40.5)#128 |
| 9. | Mentone | 41.7% | 3.9%(+37.8)#9 | 3.8%(+37.8)#152 |
| 10. | Fabrica | 41.1% | 3.9%(+37.2)#10 | 3.8%(+37.2)#158 |
| 11. | Coyanosa | 40.0% | 3.9%(+36.1)#11 | 3.8%(+36.2)#166 |
| 12. | Yancey | 37.9% | 3.9%(+34.0)#12 | 3.8%(+34.0)#185 |
| 13. | Winfield | 36.2% | 3.9%(+32.3)#13 | 3.8%(+32.4)#200 |
| 14. | St Paul | 35.3% | 3.9%(+31.4)#14 | 3.8%(+31.4)#216 |
| 15. | Rosebud | 34.4% | 3.9%(+30.6)#15 | 3.8%(+30.6)#227 |
| 16. | Port Mansfield | 33.3% | 3.9%(+29.5)#16 | 3.8%(+29.5)#242 |
| 17. | South Toledo Bend | 33.0% | 3.9%(+29.1)#17 | 3.8%(+29.2)#254 |
| 18. | La Rosita | 32.9% | 3.9%(+29.0)#18 | 3.8%(+29.0)#256 |
| 19. | Milano | 32.7% | 3.9%(+28.8)#19 | 3.8%(+28.8)#260 |
| 20. | Tradewinds | 31.9% | 3.9%(+28.0)#20 | 3.8%(+28.1)#268 |
| 21. | Green Valley Farms | 31.5% | 3.9%(+27.7)#21 | 3.8%(+27.7)#277 |
| 22. | Kingsbury | 30.9% | 3.9%(+27.0)#22 | 3.8%(+27.1)#290 |
| 23. | Waka | 30.6% | 3.9%(+26.7)#23 | 3.8%(+26.7)#299 |
| 24. | Oak Trail Shores | 28.4% | 3.9%(+24.6)#24 | 3.8%(+24.6)#343 |
| 25. | Ropesville | 27.0% | 3.9%(+23.2)#25 | 3.8%(+23.2)#380 |
| 26. | Forsan | 26.4% | 3.9%(+22.5)#26 | 3.8%(+22.6)#396 |
| 27. | Lake Colorado City | 26.0% | 3.9%(+22.1)#27 | 3.8%(+22.2)#405 |
| 28. | The Homesteads | 25.3% | 3.9%(+21.4)#28 | 3.8%(+21.5)#431 |
| 29. | Chaparrito | 24.7% | 3.9%(+20.9)#29 | 3.8%(+20.9)#459 |
| 30. | Santa Cruz | 24.2% | 3.9%(+20.4)#30 | 3.8%(+20.4)#477 |
| 31. | Ranchitos East | 24.2% | 3.9%(+20.3)#31 | 3.8%(+20.4)#481 |
| 32. | Dodd City | 24.1% | 3.9%(+20.2)#32 | 3.8%(+20.3)#485 |
| 33. | Cedar Point | 23.6% | 3.9%(+19.8)#33 | 3.8%(+19.8)#504 |
| 34. | Allison | 23.3% | 3.9%(+19.4)#34 | 3.8%(+19.4)#526 |
| 35. | Ranchitos Las Lomas | 23.0% | 3.9%(+19.1)#35 | 3.8%(+19.1)#538 |
| 36. | Gause | 22.8% | 3.9%(+19.0)#36 | 3.8%(+19.0)#548 |
| 37. | Buckholts | 22.8% | 3.9%(+18.9)#37 | 3.8%(+19.0)#550 |
| 38. | La Victoria | 22.7% | 3.9%(+18.8)#38 | 3.8%(+18.9)#555 |
| 39. | Coyote Flats | 22.5% | 3.9%(+18.6)#39 | 3.8%(+18.7)#567 |
| 40. | Cleburne | 22.3% | 3.9%(+18.4)#40 | 3.8%(+18.5)#576 |
| 41. | Huxley | 22.0% | 3.9%(+18.1)#41 | 3.8%(+18.2)#590 |
| 42. | North San Pedro | 21.9% | 3.9%(+18.0)#42 | 3.8%(+18.1)#598 |
| 43. | Seco Mines | 21.8% | 3.9%(+18.0)#43 | 3.8%(+18.0)#605 |
| 44. | Villa Del Sol | 21.7% | 3.9%(+17.8)#44 | 3.8%(+17.9)#611 |
| 45. | Mound | 21.7% | 3.9%(+17.8)#45 | 3.8%(+17.9)#612 |
| 46. | Morgan | 21.7% | 3.9%(+17.8)#46 | 3.8%(+17.8)#615 |
| 47. | Blum | 20.5% | 3.9%(+16.6)#47 | 3.8%(+16.7)#694 |
| 48. | Milford | 20.4% | 3.9%(+16.5)#48 | 3.8%(+16.6)#701 |
| 49. | Maypearl | 20.3% | 3.9%(+16.4)#49 | 3.8%(+16.4)#709 |
| 50. | Muleshoe | 20.0% | 3.9%(+16.2)#50 | 3.8%(+16.2)#718 |
| 51. | Avinger | 19.9% | 3.9%(+16.0)#51 | 3.8%(+16.0)#735 |
| 52. | Grandview | 19.7% | 3.9%(+15.9)#52 | 3.8%(+15.9)#743 |
| 53. | Tioga | 19.7% | 3.9%(+15.8)#53 | 3.8%(+15.9)#749 |
| 54. | Hale Center | 19.0% | 3.9%(+15.1)#54 | 3.8%(+15.1)#804 |
| 55. | Dorchester | 18.2% | 3.9%(+14.3)#55 | 3.8%(+14.4)#895 |
| 56. | Lackland Afb | 17.9% | 3.9%(+14.1)#56 | 3.8%(+14.1)#917 |
| 57. | Rio Vista | 17.8% | 3.9%(+13.9)#57 | 3.8%(+13.9)#933 |
| 58. | Goldsmith | 17.4% | 3.9%(+13.6)#58 | 3.8%(+13.6)#984 |
| 59. | Goree | 17.2% | 3.9%(+13.3)#59 | 3.8%(+13.4)#1,011 |
| 60. | Kendleton | 17.0% | 3.9%(+13.1)#60 | 3.8%(+13.2)#1,037 |
| 61. | Carlsbad | 16.8% | 3.9%(+12.9)#61 | 3.8%(+12.9)#1,067 |
| 62. | Myrtle Springs | 16.4% | 3.9%(+12.6)#62 | 3.8%(+12.6)#1,121 |
| 63. | Skellytown | 16.4% | 3.9%(+12.5)#63 | 3.8%(+12.6)#1,122 |
| 64. | East Columbia | 16.4% | 3.9%(+12.5)#64 | 3.8%(+12.5)#1,132 |
| 65. | Calvert | 16.3% | 3.9%(+12.5)#65 | 3.8%(+12.5)#1,134 |
| 66. | Beckville | 16.3% | 3.9%(+12.4)#66 | 3.8%(+12.5)#1,139 |
| 67. | Bangs | 16.2% | 3.9%(+12.4)#67 | 3.8%(+12.4)#1,154 |
| 68. | Lometa | 16.2% | 3.9%(+12.3)#68 | 3.8%(+12.3)#1,164 |
| 69. | Moore Station | 16.2% | 3.9%(+12.3)#69 | 3.8%(+12.3)#1,165 |
| 70. | Seth Ward | 16.0% | 3.9%(+12.1)#70 | 3.8%(+12.2)#1,194 |
| 71. | Ganado | 15.6% | 3.9%(+11.7)#71 | 3.8%(+11.7)#1,263 |
| 72. | Eagle Lake | 15.5% | 3.9%(+11.6)#72 | 3.8%(+11.7)#1,277 |
| 73. | Glidden | 15.5% | 3.9%(+11.6)#73 | 3.8%(+11.6)#1,287 |
| 74. | Barrett | 15.3% | 3.9%(+11.4)#74 | 3.8%(+11.5)#1,323 |
| 75. | Redwood | 15.3% | 3.9%(+11.4)#75 | 3.8%(+11.4)#1,327 |
| 76. | Cresson | 15.1% | 3.9%(+11.2)#76 | 3.8%(+11.3)#1,352 |
| 77. | O Brien | 14.8% | 3.9%(+10.9)#77 | 3.8%(+11.0)#1,419 |
| 78. | Keene | 14.8% | 3.9%(+10.9)#78 | 3.8%(+10.9)#1,426 |
| 79. | Bellevue | 14.7% | 3.9%(+10.8)#79 | 3.8%(+10.8)#1,448 |
| 80. | Estelline | 14.6% | 3.9%(+10.8)#80 | 3.8%(+10.8)#1,460 |
| 81. | Hutchins | 14.5% | 3.9%(+10.6)#81 | 3.8%(+10.7)#1,486 |
| 82. | Joshua | 14.3% | 3.9%(+10.4)#82 | 3.8%(+10.5)#1,519 |
| 83. | Godley | 14.1% | 3.9%(+10.2)#83 | 3.8%(+10.2)#1,593 |
| 84. | Shelbyville | 14.0% | 3.9%(+10.1)#84 | 3.8%(+10.1)#1,621 |
| 85. | Mabank | 13.8% | 3.9%(+9.96)#85 | 3.8%(+10.0)#1,659 |
| 86. | Tynan | 13.7% | 3.9%(+9.80)#86 | 3.8%(+9.84)#1,710 |
| 87. | Kerens | 13.7% | 3.9%(+9.79)#87 | 3.8%(+9.84)#1,711 |
| 88. | Trinity | 13.6% | 3.9%(+9.68)#88 | 3.8%(+9.72)#1,752 |
| 89. | Patton Village | 13.6% | 3.9%(+9.67)#89 | 3.8%(+9.72)#1,754 |
| 90. | Sealy | 13.5% | 3.9%(+9.64)#90 | 3.8%(+9.69)#1,762 |
| 91. | Itasca | 13.5% | 3.9%(+9.58)#91 | 3.8%(+9.63)#1,777 |
| 92. | Ricardo | 13.4% | 3.9%(+9.49)#92 | 3.8%(+9.54)#1,794 |
| 93. | Hico | 13.2% | 3.9%(+9.34)#93 | 3.8%(+9.39)#1,844 |
| 94. | Edmonson | 13.2% | 3.9%(+9.33)#94 | 3.8%(+9.38)#1,851 |
| 95. | Flatonia | 13.1% | 3.9%(+9.27)#95 | 3.8%(+9.32)#1,877 |
| 96. | Coahoma | 13.1% | 3.9%(+9.22)#96 | 3.8%(+9.27)#1,891 |
| 97. | Liberty Hill | 13.1% | 3.9%(+9.18)#97 | 3.8%(+9.23)#1,899 |
| 98. | Briaroaks | 13.0% | 3.9%(+9.16)#98 | 3.8%(+9.21)#1,902 |
| 99. | La Pryor | 12.8% | 3.9%(+8.96)#99 | 3.8%(+9.01)#1,984 |
| 100. | Linn | 12.8% | 3.9%(+8.91)#100 | 3.8%(+8.95)#2,003 |
Common Questions
What are the Top 10 Cities with the Highest Percentage of Population Employed in Material Moving in Texas?
Top 10 Cities with the Highest Percentage of Population Employed in Material Moving in Texas are:
#1
100.0%
#2
90.0%
#3
63.3%
#4
62.5%
#5
53.3%
#6
46.7%
#7
44.3%
#8
41.7%
#9
41.1%
#10
40.0%
What city has the Highest Percentage of Population Employed in Material Moving in Texas?
Havana has the Highest Percentage of Population Employed in Material Moving in Texas with 100.0%.
What is the Percentage of Population Employed in Material Moving in the State of Texas?
Percentage of Population Employed in Material Moving in Texas is 3.9%.
What is the Percentage of Population Employed in Material Moving in the United States?
Percentage of Population Employed in Material Moving in the United States is 3.8%.