Cities with the Highest Percentage of Population Employed in Material Moving in Vermont
RELATED REPORTS & OPTIONS
Material Moving
Vermont
Compare Cities
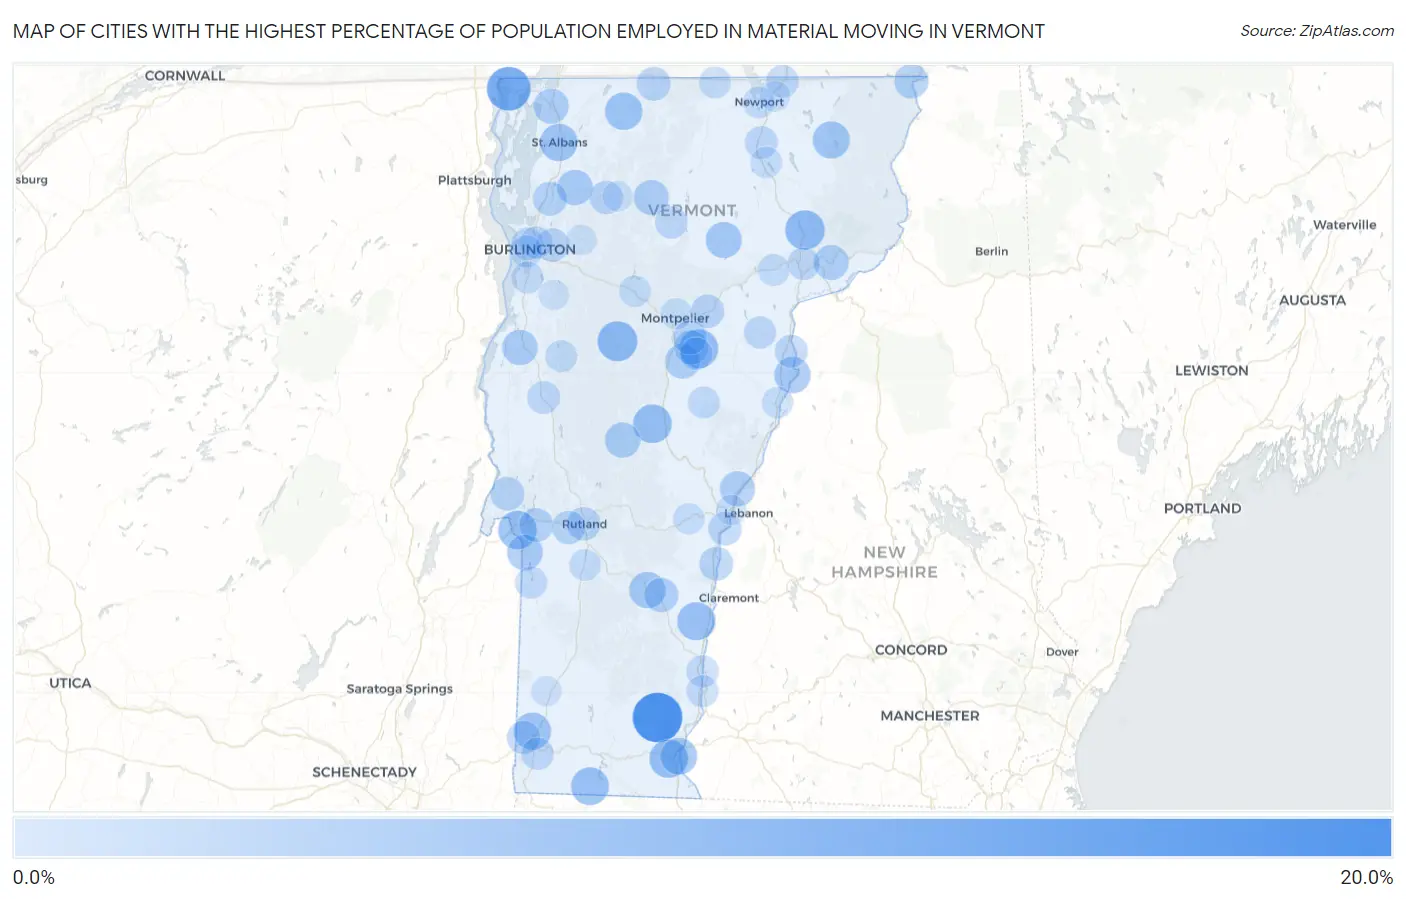
Map of Cities with the Highest Percentage of Population Employed in Material Moving in Vermont
0.0%
20.0%
Cities with the Highest Percentage of Population Employed in Material Moving in Vermont
| City | % Employed | vs State | vs National | |
| 1. | Newfane | 19.3% | 2.3%(+17.0)#1 | 3.8%(+15.5)#774 |
| 2. | Algiers | 15.6% | 2.3%(+13.3)#2 | 3.8%(+11.8)#1,259 |
| 3. | Gilman | 15.1% | 2.3%(+12.8)#3 | 3.8%(+11.3)#1,354 |
| 4. | Alburgh | 13.3% | 2.3%(+11.0)#4 | 3.8%(+9.47)#1,825 |
| 5. | Middletown Springs | 13.2% | 2.3%(+10.9)#5 | 3.8%(+9.33)#1,872 |
| 6. | Bakersfield | 11.6% | 2.3%(+9.34)#6 | 3.8%(+7.81)#2,440 |
| 7. | Waitsfield | 9.5% | 2.3%(+7.19)#7 | 3.8%(+5.65)#3,670 |
| 8. | Lyndonville | 9.0% | 2.3%(+6.71)#8 | 3.8%(+5.18)#4,081 |
| 9. | Sutton | 8.6% | 2.3%(+6.31)#9 | 3.8%(+4.77)#4,415 |
| 10. | Websterville | 8.5% | 2.3%(+6.20)#10 | 3.8%(+4.67)#4,504 |
| 11. | Randolph | 8.2% | 2.3%(+5.93)#11 | 3.8%(+4.40)#4,791 |
| 12. | Fair Haven | 8.1% | 2.3%(+5.85)#12 | 3.8%(+4.31)#4,879 |
| 13. | North Hyde Park | 8.1% | 2.3%(+5.80)#13 | 3.8%(+4.27)#4,940 |
| 14. | West Brattleboro | 8.1% | 2.3%(+5.80)#14 | 3.8%(+4.26)#4,946 |
| 15. | Lunenburg | 7.9% | 2.3%(+5.58)#15 | 3.8%(+4.04)#5,204 |
| 16. | Springfield | 7.6% | 2.3%(+5.34)#16 | 3.8%(+3.81)#5,502 |
| 17. | Readsboro | 7.4% | 2.3%(+5.11)#17 | 3.8%(+3.58)#5,802 |
| 18. | West Woodstock | 7.2% | 2.3%(+4.88)#18 | 3.8%(+3.34)#6,131 |
| 19. | Enosburg Falls | 7.0% | 2.3%(+4.74)#19 | 3.8%(+3.21)#6,322 |
| 20. | St Albans | 7.0% | 2.3%(+4.70)#20 | 3.8%(+3.17)#6,389 |
| 21. | Proctor | 6.9% | 2.3%(+4.59)#21 | 3.8%(+3.06)#6,565 |
| 22. | South Shaftsbury | 6.8% | 2.3%(+4.55)#22 | 3.8%(+3.01)#6,624 |
| 23. | Island Pond | 6.6% | 2.3%(+4.35)#23 | 3.8%(+2.82)#6,959 |
| 24. | Brattleboro | 6.2% | 2.3%(+3.95)#24 | 3.8%(+2.41)#7,607 |
| 25. | Ludlow | 6.0% | 2.3%(+3.71)#25 | 3.8%(+2.17)#8,042 |
| 26. | Newbury | 5.9% | 2.3%(+3.65)#26 | 3.8%(+2.12)#8,150 |
| 27. | Hardwick | 5.7% | 2.3%(+3.44)#27 | 3.8%(+1.90)#8,578 |
| 28. | Poultney | 5.4% | 2.3%(+3.07)#28 | 3.8%(+1.53)#9,332 |
| 29. | Castleton Four Corners | 5.2% | 2.3%(+2.88)#29 | 3.8%(+1.35)#9,766 |
| 30. | Fairfax | 5.1% | 2.3%(+2.84)#30 | 3.8%(+1.30)#9,860 |
| 31. | Vergennes | 5.0% | 2.3%(+2.73)#31 | 3.8%(+1.20)#10,092 |
| 32. | Rochester | 4.9% | 2.3%(+2.56)#32 | 3.8%(+1.02)#10,503 |
| 33. | Swanton | 4.8% | 2.3%(+2.48)#33 | 3.8%(+0.941)#10,722 |
| 34. | Norwich | 4.7% | 2.3%(+2.43)#34 | 3.8%(+0.894)#10,865 |
| 35. | Johnson | 4.7% | 2.3%(+2.39)#35 | 3.8%(+0.857)#10,956 |
| 36. | Williamstown | 4.5% | 2.3%(+2.21)#36 | 3.8%(+0.680)#11,443 |
| 37. | Concord | 4.5% | 2.3%(+2.21)#37 | 3.8%(+0.674)#11,462 |
| 38. | Canaan | 4.2% | 2.3%(+1.87)#38 | 3.8%(+0.336)#12,405 |
| 39. | Proctorsville | 3.9% | 2.3%(+1.59)#39 | 3.8%(+0.053)#13,218 |
| 40. | South Barre | 3.8% | 2.3%(+1.50)#40 | 3.8%(-0.034)#13,486 |
| 41. | Milton | 3.8% | 2.3%(+1.48)#41 | 3.8%(-0.054)#13,532 |
| 42. | Barre | 3.6% | 2.3%(+1.31)#42 | 3.8%(-0.225)#14,052 |
| 43. | Castleton | 3.6% | 2.3%(+1.25)#43 | 3.8%(-0.280)#14,243 |
| 44. | Richford | 3.5% | 2.3%(+1.20)#44 | 3.8%(-0.336)#14,411 |
| 45. | Windsor | 3.4% | 2.3%(+1.14)#45 | 3.8%(-0.398)#14,624 |
| 46. | Benson | 3.4% | 2.3%(+1.11)#46 | 3.8%(-0.421)#14,695 |
| 47. | St. George | 3.3% | 2.3%(+1.05)#47 | 3.8%(-0.481)#14,874 |
| 48. | Rutland | 3.2% | 2.3%(+0.937)#48 | 3.8%(-0.598)#15,213 |
| 49. | Plainfield | 3.2% | 2.3%(+0.879)#49 | 3.8%(-0.656)#15,414 |
| 50. | North Hartland | 3.1% | 2.3%(+0.846)#50 | 3.8%(-0.689)#15,506 |
| 51. | West Rutland | 3.1% | 2.3%(+0.829)#51 | 3.8%(-0.705)#15,550 |
| 52. | North Bennington | 3.1% | 2.3%(+0.792)#52 | 3.8%(-0.743)#15,653 |
| 53. | Essex Junction | 3.0% | 2.3%(+0.744)#53 | 3.8%(-0.791)#15,805 |
| 54. | Cambridge | 3.0% | 2.3%(+0.667)#54 | 3.8%(-0.867)#16,068 |
| 55. | Wells River | 2.5% | 2.3%(+0.247)#55 | 3.8%(-1.29)#17,374 |
| 56. | Middlebury | 2.5% | 2.3%(+0.214)#56 | 3.8%(-1.32)#17,488 |
| 57. | Wolcott | 2.5% | 2.3%(+0.204)#57 | 3.8%(-1.33)#17,524 |
| 58. | Huntington | 2.4% | 2.3%(+0.143)#58 | 3.8%(-1.39)#17,715 |
| 59. | Lincoln | 2.4% | 2.3%(+0.143)#59 | 3.8%(-1.39)#17,722 |
| 60. | Derby Line | 2.4% | 2.3%(+0.110)#60 | 3.8%(-1.42)#17,829 |
| 61. | Orleans | 2.3% | 2.3%(+0.010)#61 | 3.8%(-1.52)#18,167 |
| 62. | Graniteville | 2.2% | 2.3%(-0.122)#62 | 3.8%(-1.66)#18,593 |
| 63. | Bennington | 2.1% | 2.3%(-0.220)#63 | 3.8%(-1.75)#18,908 |
| 64. | Burlington | 2.1% | 2.3%(-0.221)#64 | 3.8%(-1.76)#18,910 |
| 65. | Morrisville | 2.1% | 2.3%(-0.240)#65 | 3.8%(-1.77)#18,977 |
| 66. | Winooski | 2.0% | 2.3%(-0.257)#66 | 3.8%(-1.79)#19,033 |
| 67. | St Johnsbury | 2.0% | 2.3%(-0.295)#67 | 3.8%(-1.83)#19,140 |
| 68. | North Clarendon | 2.0% | 2.3%(-0.296)#68 | 3.8%(-1.83)#19,150 |
| 69. | Groton | 2.0% | 2.3%(-0.304)#69 | 3.8%(-1.84)#19,171 |
| 70. | South Burlington | 1.9% | 2.3%(-0.412)#70 | 3.8%(-1.95)#19,494 |
| 71. | Bellows Falls | 1.9% | 2.3%(-0.420)#71 | 3.8%(-1.95)#19,513 |
| 72. | Westminster | 1.9% | 2.3%(-0.437)#72 | 3.8%(-1.97)#19,564 |
| 73. | Shelburne | 1.8% | 2.3%(-0.485)#73 | 3.8%(-2.02)#19,717 |
| 74. | Wells | 1.8% | 2.3%(-0.510)#74 | 3.8%(-2.04)#19,793 |
| 75. | Stamford | 1.7% | 2.3%(-0.601)#75 | 3.8%(-2.14)#20,060 |
| 76. | Bristol | 1.7% | 2.3%(-0.621)#76 | 3.8%(-2.16)#20,123 |
| 77. | Chelsea | 1.6% | 2.3%(-0.691)#77 | 3.8%(-2.23)#20,340 |
| 78. | Danville | 1.6% | 2.3%(-0.733)#78 | 3.8%(-2.27)#20,480 |
| 79. | North Troy | 1.5% | 2.3%(-0.803)#79 | 3.8%(-2.34)#20,730 |
| 80. | Newport | 1.4% | 2.3%(-0.883)#80 | 3.8%(-2.42)#20,971 |
| 81. | Waterbury | 1.4% | 2.3%(-0.902)#81 | 3.8%(-2.44)#21,016 |
| 82. | Wallingford | 1.3% | 2.3%(-0.997)#82 | 3.8%(-2.53)#21,299 |
| 83. | Bradford | 1.3% | 2.3%(-1.04)#83 | 3.8%(-2.57)#21,425 |
| 84. | Barton | 1.3% | 2.3%(-1.04)#84 | 3.8%(-2.57)#21,434 |
| 85. | Woodstock | 1.2% | 2.3%(-1.11)#85 | 3.8%(-2.64)#21,610 |
| 86. | Montpelier | 0.96% | 2.3%(-1.34)#86 | 3.8%(-2.87)#22,238 |
| 87. | Derby Center | 0.50% | 2.3%(-1.80)#87 | 3.8%(-3.33)#23,281 |
| 88. | Jericho | 0.44% | 2.3%(-1.85)#88 | 3.8%(-3.39)#23,366 |
| 89. | Jeffersonville | 0.23% | 2.3%(-2.06)#89 | 3.8%(-3.60)#23,597 |
| 90. | Arlington | 0.22% | 2.3%(-2.07)#90 | 3.8%(-3.61)#23,603 |
| 91. | Hinesburg | 0.20% | 2.3%(-2.09)#91 | 3.8%(-3.63)#23,623 |
| 92. | White River Junction | 0.15% | 2.3%(-2.15)#92 | 3.8%(-3.68)#23,655 |
1
2Common Questions
What are the Top 10 Cities with the Highest Percentage of Population Employed in Material Moving in Vermont?
Top 10 Cities with the Highest Percentage of Population Employed in Material Moving in Vermont are:
#1
19.3%
#2
13.3%
#3
9.5%
#4
9.0%
#5
8.5%
#6
8.2%
#7
8.1%
#8
8.1%
#9
7.6%
#10
7.4%
What city has the Highest Percentage of Population Employed in Material Moving in Vermont?
Newfane has the Highest Percentage of Population Employed in Material Moving in Vermont with 19.3%.
What is the Percentage of Population Employed in Material Moving in the State of Vermont?
Percentage of Population Employed in Material Moving in Vermont is 2.3%.
What is the Percentage of Population Employed in Material Moving in the United States?
Percentage of Population Employed in Material Moving in the United States is 3.8%.