Cities with the Highest Percentage of Population Employed in Material Moving in Connecticut
RELATED REPORTS & OPTIONS
Material Moving
Connecticut
Compare Cities
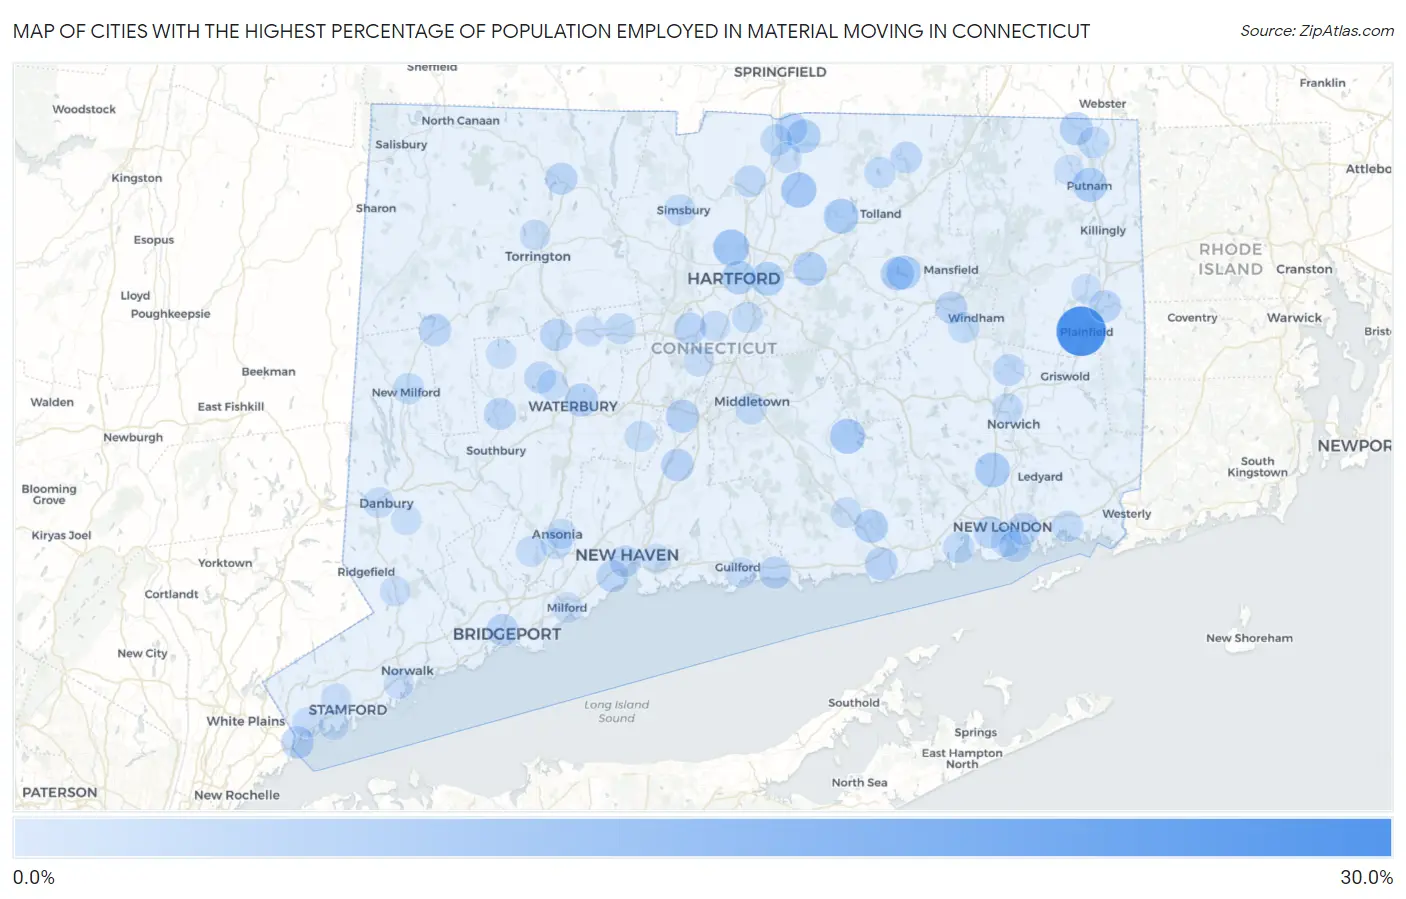
Map of Cities with the Highest Percentage of Population Employed in Material Moving in Connecticut
0.0%
30.0%
Cities with the Highest Percentage of Population Employed in Material Moving in Connecticut
| City | % Employed | vs State | vs National | |
| 1. | Plainfield Village | 29.1% | 2.8%(+26.3)#1 | 3.8%(+25.3)#327 |
| 2. | Mechanicsville | 15.8% | 2.8%(+13.0)#2 | 3.8%(+12.0)#1,223 |
| 3. | Route 7 Gateway | 11.4% | 2.8%(+8.57)#3 | 3.8%(+7.54)#2,549 |
| 4. | Blue Hills | 9.6% | 2.8%(+6.83)#4 | 3.8%(+5.80)#3,556 |
| 5. | Quasset Lake | 9.0% | 2.8%(+6.16)#5 | 3.8%(+5.14)#4,109 |
| 6. | Gaylordsville | 9.0% | 2.8%(+6.15)#6 | 3.8%(+5.12)#4,116 |
| 7. | Broad Brook | 8.8% | 2.8%(+5.96)#7 | 3.8%(+4.94)#4,261 |
| 8. | Moodus | 8.2% | 2.8%(+5.39)#8 | 3.8%(+4.37)#4,825 |
| 9. | Rockville | 8.2% | 2.8%(+5.35)#9 | 3.8%(+4.33)#4,867 |
| 10. | Oxoboxo River | 8.1% | 2.8%(+5.28)#10 | 3.8%(+4.26)#4,947 |
| 11. | Botsford | 7.5% | 2.8%(+4.69)#11 | 3.8%(+3.66)#5,695 |
| 12. | Putnam | 7.2% | 2.8%(+4.38)#12 | 3.8%(+3.36)#6,097 |
| 13. | Cornwall Bridge | 7.1% | 2.8%(+4.34)#13 | 3.8%(+3.31)#6,174 |
| 14. | South Coventry | 6.8% | 2.8%(+4.01)#14 | 3.8%(+2.99)#6,657 |
| 15. | East Hartford | 6.6% | 2.8%(+3.80)#15 | 3.8%(+2.78)#7,018 |
| 16. | Hazardville | 6.5% | 2.8%(+3.68)#16 | 3.8%(+2.66)#7,193 |
| 17. | Hartford | 6.5% | 2.8%(+3.65)#17 | 3.8%(+2.62)#7,245 |
| 18. | Manchester | 6.4% | 2.8%(+3.56)#18 | 3.8%(+2.54)#7,395 |
| 19. | Essex Village | 6.2% | 2.8%(+3.41)#19 | 3.8%(+2.39)#7,632 |
| 20. | Coventry Lake | 6.1% | 2.8%(+3.30)#20 | 3.8%(+2.28)#7,826 |
| 21. | Riverton | 5.9% | 2.8%(+3.11)#21 | 3.8%(+2.09)#8,199 |
| 22. | Stepney | 5.9% | 2.8%(+3.09)#22 | 3.8%(+2.07)#8,239 |
| 23. | Quinebaug | 5.9% | 2.8%(+3.05)#23 | 3.8%(+2.03)#8,318 |
| 24. | Waterbury | 5.8% | 2.8%(+2.99)#24 | 3.8%(+1.97)#8,443 |
| 25. | Meriden | 5.7% | 2.8%(+2.90)#25 | 3.8%(+1.88)#8,624 |
| 26. | Inglenook | 5.4% | 2.8%(+2.62)#26 | 3.8%(+1.60)#9,201 |
| 27. | Old Saybrook Center | 5.3% | 2.8%(+2.51)#27 | 3.8%(+1.49)#9,442 |
| 28. | Byram | 5.0% | 2.8%(+2.21)#28 | 3.8%(+1.18)#10,118 |
| 29. | Wallingford Center | 5.0% | 2.8%(+2.19)#29 | 3.8%(+1.17)#10,164 |
| 30. | Thomaston | 4.7% | 2.8%(+1.93)#30 | 3.8%(+0.907)#10,831 |
| 31. | New Preston | 4.7% | 2.8%(+1.92)#31 | 3.8%(+0.893)#10,872 |
| 32. | Sherwood Manor | 4.6% | 2.8%(+1.81)#32 | 3.8%(+0.786)#11,159 |
| 33. | New Britain | 4.5% | 2.8%(+1.74)#33 | 3.8%(+0.720)#11,319 |
| 34. | Long Hill | 4.5% | 2.8%(+1.73)#34 | 3.8%(+0.703)#11,380 |
| 35. | Moosup | 4.5% | 2.8%(+1.70)#35 | 3.8%(+0.678)#11,448 |
| 36. | Willimantic | 4.5% | 2.8%(+1.66)#36 | 3.8%(+0.635)#11,561 |
| 37. | Bridgeport | 4.4% | 2.8%(+1.54)#37 | 3.8%(+0.521)#11,839 |
| 38. | Winsted | 4.3% | 2.8%(+1.54)#38 | 3.8%(+0.511)#11,902 |
| 39. | Waterford | 4.3% | 2.8%(+1.53)#39 | 3.8%(+0.504)#11,919 |
| 40. | Naugatuck Borough | 4.3% | 2.8%(+1.47)#40 | 3.8%(+0.446)#12,086 |
| 41. | Bridgewater | 4.2% | 2.8%(+1.36)#41 | 3.8%(+0.336)#12,416 |
| 42. | West Haven | 4.2% | 2.8%(+1.35)#42 | 3.8%(+0.329)#12,442 |
| 43. | Madison Center | 4.1% | 2.8%(+1.34)#43 | 3.8%(+0.316)#12,469 |
| 44. | Woodbury Center | 4.1% | 2.8%(+1.28)#44 | 3.8%(+0.261)#12,602 |
| 45. | Windsor Locks | 4.0% | 2.8%(+1.19)#45 | 3.8%(+0.166)#12,906 |
| 46. | Watertown | 4.0% | 2.8%(+1.17)#46 | 3.8%(+0.149)#12,941 |
| 47. | Baltic | 3.8% | 2.8%(+0.976)#47 | 3.8%(-0.047)#13,515 |
| 48. | New Haven | 3.8% | 2.8%(+0.962)#48 | 3.8%(-0.061)#13,563 |
| 49. | Groton | 3.8% | 2.8%(+0.946)#49 | 3.8%(-0.078)#13,609 |
| 50. | Stafford Springs | 3.6% | 2.8%(+0.828)#50 | 3.8%(-0.196)#13,976 |
| 51. | Crystal Lake | 3.5% | 2.8%(+0.734)#51 | 3.8%(-0.290)#14,261 |
| 52. | Staples | 3.5% | 2.8%(+0.702)#52 | 3.8%(-0.322)#14,379 |
| 53. | Thompsonville | 3.5% | 2.8%(+0.684)#53 | 3.8%(-0.340)#14,427 |
| 54. | Jewett City Borough | 3.5% | 2.8%(+0.657)#54 | 3.8%(-0.367)#14,514 |
| 55. | Middletown | 3.5% | 2.8%(+0.654)#55 | 3.8%(-0.370)#14,523 |
| 56. | North Grosvenor Dale | 3.3% | 2.8%(+0.504)#56 | 3.8%(-0.520)#15,004 |
| 57. | New London | 3.3% | 2.8%(+0.474)#57 | 3.8%(-0.550)#15,084 |
| 58. | Simsbury Center | 3.3% | 2.8%(+0.470)#58 | 3.8%(-0.554)#15,101 |
| 59. | New Canaan | 3.3% | 2.8%(+0.460)#59 | 3.8%(-0.564)#15,138 |
| 60. | Bristol | 3.3% | 2.8%(+0.450)#60 | 3.8%(-0.574)#15,162 |
| 61. | New Milford | 3.2% | 2.8%(+0.366)#61 | 3.8%(-0.658)#15,426 |
| 62. | Niantic | 3.2% | 2.8%(+0.351)#62 | 3.8%(-0.672)#15,462 |
| 63. | South Windham | 3.1% | 2.8%(+0.285)#63 | 3.8%(-0.739)#15,643 |
| 64. | Fairfield University | 3.0% | 2.8%(+0.228)#64 | 3.8%(-0.796)#15,824 |
| 65. | Norwich | 3.0% | 2.8%(+0.198)#65 | 3.8%(-0.826)#15,932 |
| 66. | East | 3.0% | 2.8%(+0.195)#66 | 3.8%(-0.828)#15,940 |
| 67. | Derby | 3.0% | 2.8%(+0.163)#67 | 3.8%(-0.861)#16,048 |
| 68. | Litchfield Borough | 2.9% | 2.8%(+0.081)#68 | 3.8%(-0.943)#16,319 |
| 69. | Sacred Heart University | 2.7% | 2.8%(-0.063)#69 | 3.8%(-1.09)#16,763 |
| 70. | Mystic | 2.7% | 2.8%(-0.082)#70 | 3.8%(-1.11)#16,822 |
| 71. | Wethersfield | 2.7% | 2.8%(-0.109)#71 | 3.8%(-1.13)#16,907 |
| 72. | Cheshire Village | 2.7% | 2.8%(-0.147)#72 | 3.8%(-1.17)#17,021 |
| 73. | Southwood Acres | 2.5% | 2.8%(-0.279)#73 | 3.8%(-1.30)#17,429 |
| 74. | Shelton | 2.5% | 2.8%(-0.286)#74 | 3.8%(-1.31)#17,459 |
| 75. | Newington | 2.5% | 2.8%(-0.308)#75 | 3.8%(-1.33)#17,529 |
| 76. | Torrington | 2.4% | 2.8%(-0.403)#76 | 3.8%(-1.43)#17,839 |
| 77. | Deep River Center | 2.4% | 2.8%(-0.415)#77 | 3.8%(-1.44)#17,870 |
| 78. | Danbury | 2.4% | 2.8%(-0.424)#78 | 3.8%(-1.45)#17,890 |
| 79. | Oakville | 2.4% | 2.8%(-0.446)#79 | 3.8%(-1.47)#17,990 |
| 80. | Northford | 2.3% | 2.8%(-0.476)#80 | 3.8%(-1.50)#18,080 |
| 81. | Stratford Downtown | 2.3% | 2.8%(-0.512)#81 | 3.8%(-1.54)#18,216 |
| 82. | Kensington | 2.3% | 2.8%(-0.527)#82 | 3.8%(-1.55)#18,255 |
| 83. | Stonington Borough | 2.1% | 2.8%(-0.658)#83 | 3.8%(-1.68)#18,668 |
| 84. | Stamford | 2.1% | 2.8%(-0.663)#84 | 3.8%(-1.69)#18,683 |
| 85. | Greenwich | 2.1% | 2.8%(-0.739)#85 | 3.8%(-1.76)#18,936 |
| 86. | Milford City Balance | 2.0% | 2.8%(-0.781)#86 | 3.8%(-1.80)#19,064 |
| 87. | Ansonia | 1.9% | 2.8%(-0.871)#87 | 3.8%(-1.89)#19,326 |
| 88. | Georgetown | 1.9% | 2.8%(-0.878)#88 | 3.8%(-1.90)#19,352 |
| 89. | Norwalk | 1.9% | 2.8%(-0.898)#89 | 3.8%(-1.92)#19,427 |
| 90. | Bethlehem Village | 1.9% | 2.8%(-0.948)#90 | 3.8%(-1.97)#19,567 |
| 91. | Guilford Center | 1.9% | 2.8%(-0.949)#91 | 3.8%(-1.97)#19,571 |
| 92. | Bethel | 1.8% | 2.8%(-0.986)#92 | 3.8%(-2.01)#19,684 |
| 93. | Terryville | 1.8% | 2.8%(-1.00)#93 | 3.8%(-2.03)#19,731 |
| 94. | South Wilton | 1.8% | 2.8%(-1.06)#94 | 3.8%(-2.08)#19,906 |
| 95. | Wauregan | 1.7% | 2.8%(-1.09)#95 | 3.8%(-2.12)#20,013 |
| 96. | Lordship | 1.7% | 2.8%(-1.12)#96 | 3.8%(-2.15)#20,096 |
| 97. | South Woodstock | 1.6% | 2.8%(-1.17)#97 | 3.8%(-2.20)#20,237 |
| 98. | Old Greenwich | 1.6% | 2.8%(-1.17)#98 | 3.8%(-2.20)#20,243 |
| 99. | East Haven | 1.6% | 2.8%(-1.20)#99 | 3.8%(-2.23)#20,348 |
| 100. | Coleytown | 1.5% | 2.8%(-1.28)#100 | 3.8%(-2.30)#20,608 |
Common Questions
What are the Top 10 Cities with the Highest Percentage of Population Employed in Material Moving in Connecticut?
Top 10 Cities with the Highest Percentage of Population Employed in Material Moving in Connecticut are:
#1
29.1%
#2
9.6%
#3
8.8%
#4
8.2%
#5
8.2%
#6
8.1%
#7
7.2%
#8
6.8%
#9
6.6%
#10
6.5%
What city has the Highest Percentage of Population Employed in Material Moving in Connecticut?
Plainfield Village has the Highest Percentage of Population Employed in Material Moving in Connecticut with 29.1%.
What is the Percentage of Population Employed in Material Moving in the State of Connecticut?
Percentage of Population Employed in Material Moving in Connecticut is 2.8%.
What is the Percentage of Population Employed in Material Moving in the United States?
Percentage of Population Employed in Material Moving in the United States is 3.8%.