Cities with the Highest Percentage of Population Employed in Material Moving in Hawaii
RELATED REPORTS & OPTIONS
Material Moving
Hawaii
Compare Cities
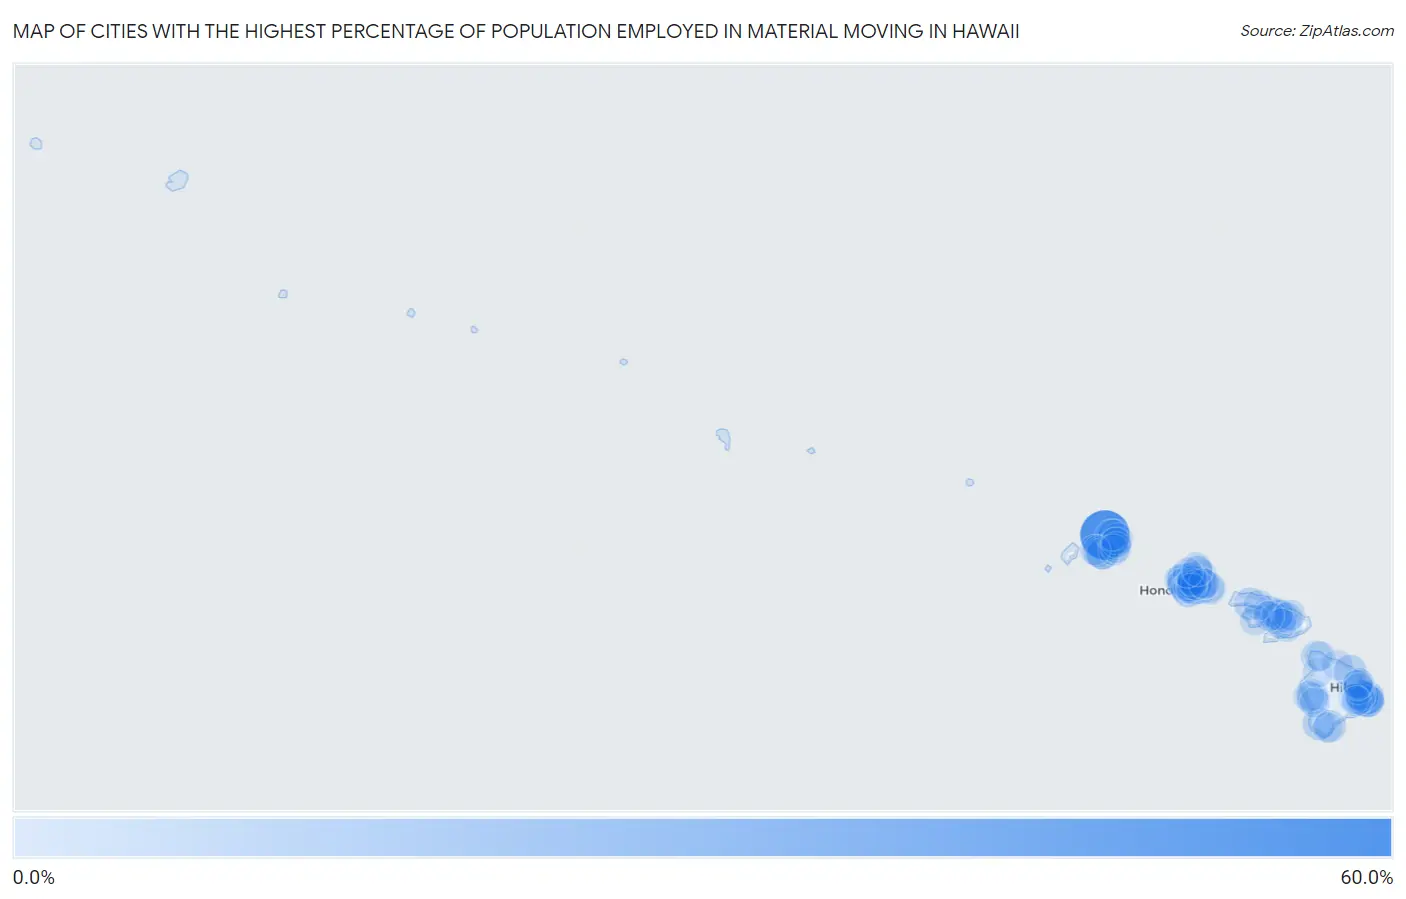
Map of Cities with the Highest Percentage of Population Employed in Material Moving in Hawaii
0.0%
60.0%
Cities with the Highest Percentage of Population Employed in Material Moving in Hawaii
| City | % Employed | vs State | vs National | |
| 1. | Wainiha | 56.4% | 2.9%(+53.5)#1 | 3.8%(+52.5)#77 |
| 2. | Ainaloa | 14.1% | 2.9%(+11.2)#2 | 3.8%(+10.3)#1,580 |
| 3. | Pahoa | 13.1% | 2.9%(+10.2)#3 | 3.8%(+9.32)#1,876 |
| 4. | Kalaeloa | 13.0% | 2.9%(+10.1)#4 | 3.8%(+9.17)#1,925 |
| 5. | Hanapepe | 10.9% | 2.9%(+7.96)#5 | 3.8%(+7.03)#2,797 |
| 6. | Hawaiian Beaches | 10.7% | 2.9%(+7.83)#6 | 3.8%(+6.90)#2,854 |
| 7. | Laupahoehoe | 9.5% | 2.9%(+6.59)#7 | 3.8%(+5.66)#3,656 |
| 8. | Orchidlands Estates | 8.0% | 2.9%(+5.05)#8 | 3.8%(+4.12)#5,087 |
| 9. | Hawaiian Ocean View | 7.8% | 2.9%(+4.93)#9 | 3.8%(+4.00)#5,262 |
| 10. | Kaunakakai | 7.2% | 2.9%(+4.27)#10 | 3.8%(+3.34)#6,137 |
| 11. | Naalehu | 7.1% | 2.9%(+4.22)#11 | 3.8%(+3.29)#6,207 |
| 12. | Waimea Cdp Kauai County | 6.9% | 2.9%(+4.04)#12 | 3.8%(+3.11)#6,474 |
| 13. | Kahului | 6.7% | 2.9%(+3.76)#13 | 3.8%(+2.83)#6,940 |
| 14. | Waihee Waiehu | 6.3% | 2.9%(+3.36)#14 | 3.8%(+2.43)#7,555 |
| 15. | Pakala Village | 6.2% | 2.9%(+3.25)#15 | 3.8%(+2.32)#7,750 |
| 16. | Waianae | 5.9% | 2.9%(+2.98)#16 | 3.8%(+2.06)#8,248 |
| 17. | Waipio Acres | 5.7% | 2.9%(+2.83)#17 | 3.8%(+1.90)#8,575 |
| 18. | Nanakuli | 5.7% | 2.9%(+2.75)#18 | 3.8%(+1.82)#8,756 |
| 19. | Leilani Estates | 5.6% | 2.9%(+2.68)#19 | 3.8%(+1.76)#8,883 |
| 20. | Waimanalo Beach | 5.6% | 2.9%(+2.68)#20 | 3.8%(+1.76)#8,884 |
| 21. | Fern Acres | 5.5% | 2.9%(+2.64)#21 | 3.8%(+1.72)#8,977 |
| 22. | Wailua Homesteads | 5.5% | 2.9%(+2.60)#22 | 3.8%(+1.68)#9,050 |
| 23. | Iroquois Point | 5.2% | 2.9%(+2.26)#23 | 3.8%(+1.33)#9,812 |
| 24. | East Kapolei | 5.1% | 2.9%(+2.21)#24 | 3.8%(+1.28)#9,903 |
| 25. | Waipahu | 5.1% | 2.9%(+2.21)#25 | 3.8%(+1.28)#9,908 |
| 26. | Eleele | 5.1% | 2.9%(+2.18)#26 | 3.8%(+1.26)#9,959 |
| 27. | Kealakekua | 5.1% | 2.9%(+2.18)#27 | 3.8%(+1.25)#9,977 |
| 28. | Keokea | 5.0% | 2.9%(+2.07)#28 | 3.8%(+1.14)#10,229 |
| 29. | Honalo | 4.9% | 2.9%(+2.04)#29 | 3.8%(+1.11)#10,280 |
| 30. | Wheeler Afb | 4.7% | 2.9%(+1.83)#30 | 3.8%(+0.901)#10,848 |
| 31. | Anahola | 4.6% | 2.9%(+1.68)#31 | 3.8%(+0.752)#11,250 |
| 32. | Mahinahina | 4.5% | 2.9%(+1.57)#32 | 3.8%(+0.645)#11,538 |
| 33. | Hickam Housing | 4.4% | 2.9%(+1.51)#33 | 3.8%(+0.583)#11,687 |
| 34. | Kalihiwai | 4.4% | 2.9%(+1.48)#34 | 3.8%(+0.556)#11,754 |
| 35. | Waimanalo | 4.3% | 2.9%(+1.40)#35 | 3.8%(+0.473)#12,007 |
| 36. | Schofield Barracks | 4.2% | 2.9%(+1.32)#36 | 3.8%(+0.393)#12,239 |
| 37. | Makaha | 4.2% | 2.9%(+1.31)#37 | 3.8%(+0.384)#12,258 |
| 38. | Kurtistown | 4.2% | 2.9%(+1.30)#38 | 3.8%(+0.372)#12,297 |
| 39. | Makaha Valley | 4.2% | 2.9%(+1.26)#39 | 3.8%(+0.336)#12,414 |
| 40. | Hawi | 4.1% | 2.9%(+1.18)#40 | 3.8%(+0.248)#12,655 |
| 41. | Papaikou | 4.1% | 2.9%(+1.16)#41 | 3.8%(+0.236)#12,689 |
| 42. | Waikapu | 4.1% | 2.9%(+1.15)#42 | 3.8%(+0.220)#12,740 |
| 43. | Kailua Cdp Hawaii County | 4.0% | 2.9%(+1.13)#43 | 3.8%(+0.199)#12,798 |
| 44. | Pearl City | 3.9% | 2.9%(+1.03)#44 | 3.8%(+0.105)#13,079 |
| 45. | Kilauea | 3.9% | 2.9%(+0.953)#45 | 3.8%(+0.025)#13,294 |
| 46. | Kahaluu Keauhou | 3.8% | 2.9%(+0.900)#46 | 3.8%(-0.028)#13,468 |
| 47. | Waimea Cdp Hawaii County | 3.8% | 2.9%(+0.881)#47 | 3.8%(-0.047)#13,516 |
| 48. | Ewa Beach | 3.8% | 2.9%(+0.872)#48 | 3.8%(-0.056)#13,541 |
| 49. | Kaaawa | 3.8% | 2.9%(+0.862)#49 | 3.8%(-0.066)#13,575 |
| 50. | Wahiawa | 3.7% | 2.9%(+0.807)#50 | 3.8%(-0.121)#13,742 |
| 51. | Halawa | 3.7% | 2.9%(+0.802)#51 | 3.8%(-0.127)#13,756 |
| 52. | Puhi | 3.6% | 2.9%(+0.744)#52 | 3.8%(-0.184)#13,932 |
| 53. | Waikoloa Beach Resort | 3.6% | 2.9%(+0.734)#53 | 3.8%(-0.194)#13,964 |
| 54. | Waipio | 3.6% | 2.9%(+0.724)#54 | 3.8%(-0.204)#13,992 |
| 55. | Ewa Villages | 3.6% | 2.9%(+0.716)#55 | 3.8%(-0.213)#14,013 |
| 56. | Ahuimanu | 3.5% | 2.9%(+0.623)#56 | 3.8%(-0.305)#14,313 |
| 57. | Kahuku | 3.4% | 2.9%(+0.515)#57 | 3.8%(-0.413)#14,669 |
| 58. | Hanamaulu | 3.2% | 2.9%(+0.331)#58 | 3.8%(-0.597)#15,212 |
| 59. | Wailuku | 3.2% | 2.9%(+0.327)#59 | 3.8%(-0.601)#15,226 |
| 60. | Haiku Pauwela | 3.2% | 2.9%(+0.321)#60 | 3.8%(-0.607)#15,259 |
| 61. | Kapolei | 3.2% | 2.9%(+0.271)#61 | 3.8%(-0.657)#15,425 |
| 62. | Paukaa | 3.2% | 2.9%(+0.260)#62 | 3.8%(-0.668)#15,457 |
| 63. | Lanai City | 3.2% | 2.9%(+0.253)#63 | 3.8%(-0.675)#15,472 |
| 64. | Helemano | 3.1% | 2.9%(+0.223)#64 | 3.8%(-0.705)#15,548 |
| 65. | Maili | 3.1% | 2.9%(+0.164)#65 | 3.8%(-0.764)#15,735 |
| 66. | Hilo | 2.9% | 2.9%(+0.042)#66 | 3.8%(-0.886)#16,126 |
| 67. | Waiahole-Waikane | 2.9% | 2.9%(+0.013)#67 | 3.8%(-0.915)#16,222 |
| 68. | Aiea | 2.9% | 2.9%(-0.027)#68 | 3.8%(-0.955)#16,358 |
| 69. | Haliimaile | 2.9% | 2.9%(-0.031)#69 | 3.8%(-0.959)#16,374 |
| 70. | Urban Honolulu | 2.7% | 2.9%(-0.220)#70 | 3.8%(-1.15)#16,957 |
| 71. | Honokaa | 2.7% | 2.9%(-0.235)#71 | 3.8%(-1.16)#16,997 |
| 72. | Kaneohe | 2.7% | 2.9%(-0.248)#72 | 3.8%(-1.18)#17,035 |
| 73. | Ualapue | 2.6% | 2.9%(-0.257)#73 | 3.8%(-1.18)#17,060 |
| 74. | Whitmore Village | 2.6% | 2.9%(-0.318)#74 | 3.8%(-1.25)#17,241 |
| 75. | Kailua Cdp Honolulu County | 2.5% | 2.9%(-0.420)#75 | 3.8%(-1.35)#17,573 |
| 76. | West Loch Estate | 2.5% | 2.9%(-0.431)#76 | 3.8%(-1.36)#17,616 |
| 77. | Waikele | 2.4% | 2.9%(-0.470)#77 | 3.8%(-1.40)#17,744 |
| 78. | Kihei | 2.4% | 2.9%(-0.485)#78 | 3.8%(-1.41)#17,787 |
| 79. | Lahaina | 2.4% | 2.9%(-0.497)#79 | 3.8%(-1.42)#17,831 |
| 80. | Honaunau Napoopoo | 2.3% | 2.9%(-0.639)#80 | 3.8%(-1.57)#18,316 |
| 81. | Ko Olina | 2.3% | 2.9%(-0.644)#81 | 3.8%(-1.57)#18,331 |
| 82. | Kekaha | 2.3% | 2.9%(-0.651)#82 | 3.8%(-1.58)#18,349 |
| 83. | Laie | 2.2% | 2.9%(-0.673)#83 | 3.8%(-1.60)#18,407 |
| 84. | Makakilo | 2.1% | 2.9%(-0.761)#84 | 3.8%(-1.69)#18,693 |
| 85. | Royal Kunia | 2.1% | 2.9%(-0.817)#85 | 3.8%(-1.75)#18,866 |
| 86. | Waimalu | 2.1% | 2.9%(-0.829)#86 | 3.8%(-1.76)#18,914 |
| 87. | Mililani Mauka | 2.0% | 2.9%(-0.916)#87 | 3.8%(-1.84)#19,189 |
| 88. | Mililani Town | 2.0% | 2.9%(-0.935)#88 | 3.8%(-1.86)#19,236 |
| 89. | Ewa Gentry | 2.0% | 2.9%(-0.949)#89 | 3.8%(-1.88)#19,275 |
| 90. | Waikoloa Village | 1.9% | 2.9%(-1.03)#90 | 3.8%(-1.96)#19,523 |
| 91. | Mountain View | 1.8% | 2.9%(-1.08)#91 | 3.8%(-2.01)#19,676 |
| 92. | Wainaku | 1.8% | 2.9%(-1.08)#92 | 3.8%(-2.01)#19,677 |
| 93. | Fern Forest | 1.8% | 2.9%(-1.12)#93 | 3.8%(-2.04)#19,789 |
| 94. | Heeia | 1.8% | 2.9%(-1.12)#94 | 3.8%(-2.05)#19,811 |
| 95. | Discovery Harbour | 1.8% | 2.9%(-1.13)#95 | 3.8%(-2.06)#19,834 |
| 96. | Halaula | 1.8% | 2.9%(-1.15)#96 | 3.8%(-2.08)#19,884 |
| 97. | Kaiminani | 1.7% | 2.9%(-1.16)#97 | 3.8%(-2.09)#19,943 |
| 98. | Hauula | 1.7% | 2.9%(-1.25)#98 | 3.8%(-2.18)#20,189 |
| 99. | Kapaa | 1.6% | 2.9%(-1.29)#99 | 3.8%(-2.22)#20,317 |
| 100. | Haleiwa | 1.6% | 2.9%(-1.35)#100 | 3.8%(-2.27)#20,509 |
1
2Common Questions
What are the Top 10 Cities with the Highest Percentage of Population Employed in Material Moving in Hawaii?
Top 10 Cities with the Highest Percentage of Population Employed in Material Moving in Hawaii are:
#1
56.4%
#2
14.1%
#3
13.1%
#4
13.0%
#5
10.9%
#6
10.7%
#7
9.5%
#8
8.0%
#9
7.8%
#10
7.2%
What city has the Highest Percentage of Population Employed in Material Moving in Hawaii?
Wainiha has the Highest Percentage of Population Employed in Material Moving in Hawaii with 56.4%.
What is the Percentage of Population Employed in Material Moving in the State of Hawaii?
Percentage of Population Employed in Material Moving in Hawaii is 2.9%.
What is the Percentage of Population Employed in Material Moving in the United States?
Percentage of Population Employed in Material Moving in the United States is 3.8%.