Cities with the Highest Percentage of Population Employed in Material Moving in New Mexico
RELATED REPORTS & OPTIONS
Material Moving
New Mexico
Compare Cities
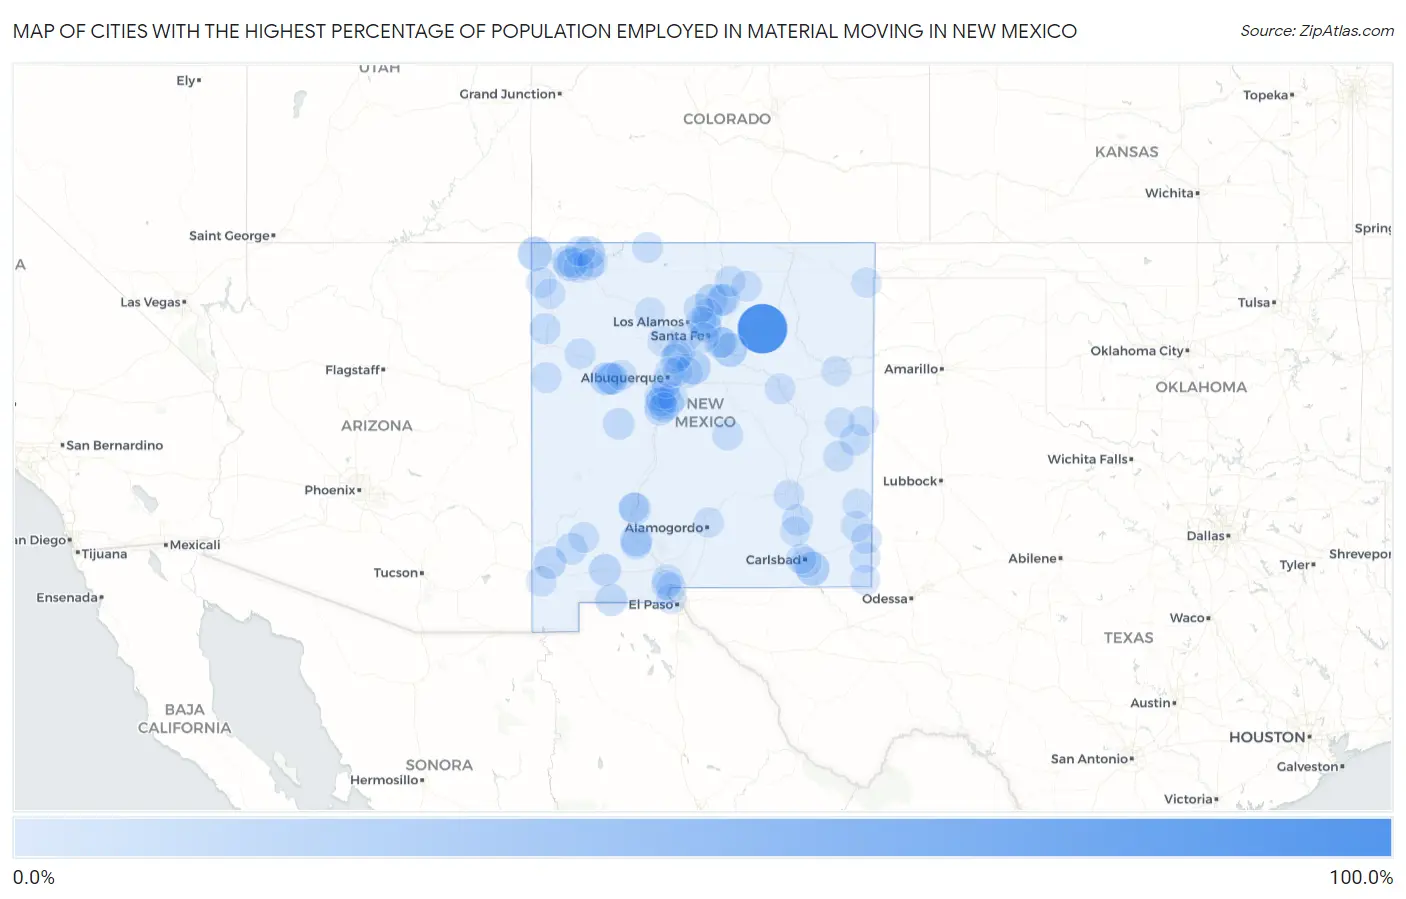
Map of Cities with the Highest Percentage of Population Employed in Material Moving in New Mexico
0.0%
100.0%
Cities with the Highest Percentage of Population Employed in Material Moving in New Mexico
| City | % Employed | vs State | vs National | |
| 1. | Watrous | 100.0% | 3.2%(+96.8)#1 | 3.8%(+96.2)#14 |
| 2. | Placitas Cdp Dona Ana County | 51.2% | 3.2%(+48.0)#2 | 3.8%(+47.3)#93 |
| 3. | Canon | 35.2% | 3.2%(+32.1)#3 | 3.8%(+31.4)#217 |
| 4. | Ojo Encino | 27.3% | 3.2%(+24.1)#4 | 3.8%(+23.4)#376 |
| 5. | Prewitt | 25.8% | 3.2%(+22.7)#5 | 3.8%(+22.0)#414 |
| 6. | Beclabito | 22.8% | 3.2%(+19.7)#6 | 3.8%(+19.0)#549 |
| 7. | North San Ysidro | 21.6% | 3.2%(+18.4)#7 | 3.8%(+17.8)#619 |
| 8. | Loving | 21.6% | 3.2%(+18.4)#8 | 3.8%(+17.8)#620 |
| 9. | San Pedro | 21.2% | 3.2%(+18.0)#9 | 3.8%(+17.3)#648 |
| 10. | Totah Vista | 17.1% | 3.2%(+14.0)#10 | 3.8%(+13.3)#1,023 |
| 11. | Rio Chiquito | 16.7% | 3.2%(+13.5)#11 | 3.8%(+12.8)#1,078 |
| 12. | Lindrith | 15.9% | 3.2%(+12.7)#12 | 3.8%(+12.1)#1,212 |
| 13. | Anzac Village | 15.8% | 3.2%(+12.6)#13 | 3.8%(+12.0)#1,232 |
| 14. | North Light Plant | 15.8% | 3.2%(+12.6)#14 | 3.8%(+11.9)#1,235 |
| 15. | Las Maravillas | 15.1% | 3.2%(+12.0)#15 | 3.8%(+11.3)#1,347 |
| 16. | Manuelito | 14.3% | 3.2%(+11.1)#16 | 3.8%(+10.5)#1,553 |
| 17. | Salem | 14.1% | 3.2%(+10.9)#17 | 3.8%(+10.3)#1,590 |
| 18. | Glen Acres | 13.4% | 3.2%(+10.2)#18 | 3.8%(+9.55)#1,791 |
| 19. | Ojo Amarillo | 13.0% | 3.2%(+9.80)#19 | 3.8%(+9.13)#1,935 |
| 20. | Elephant Butte | 12.9% | 3.2%(+9.77)#20 | 3.8%(+9.10)#1,949 |
| 21. | Deming | 12.8% | 3.2%(+9.59)#21 | 3.8%(+8.93)#2,014 |
| 22. | Dixon | 12.7% | 3.2%(+9.58)#22 | 3.8%(+8.91)#2,016 |
| 23. | Vadito | 12.2% | 3.2%(+9.00)#23 | 3.8%(+8.33)#2,235 |
| 24. | Columbus | 12.0% | 3.2%(+8.81)#24 | 3.8%(+8.15)#2,302 |
| 25. | Mccartys Village | 11.3% | 3.2%(+8.10)#25 | 3.8%(+7.44)#2,597 |
| 26. | Acomita Lake | 11.0% | 3.2%(+7.86)#26 | 3.8%(+7.19)#2,718 |
| 27. | Nenahnezad | 10.6% | 3.2%(+7.46)#27 | 3.8%(+6.79)#2,917 |
| 28. | White Signal | 10.6% | 3.2%(+7.42)#28 | 3.8%(+6.76)#2,931 |
| 29. | Cuyamungue Grant | 10.5% | 3.2%(+7.29)#29 | 3.8%(+6.63)#3,009 |
| 30. | Alamo | 10.3% | 3.2%(+7.11)#30 | 3.8%(+6.44)#3,120 |
| 31. | Belen | 10.1% | 3.2%(+6.96)#31 | 3.8%(+6.29)#3,210 |
| 32. | Rio Lucio | 9.4% | 3.2%(+6.27)#32 | 3.8%(+5.60)#3,719 |
| 33. | Upper Fruitland | 9.2% | 3.2%(+6.04)#33 | 3.8%(+5.37)#3,891 |
| 34. | Nakaibito | 8.8% | 3.2%(+5.66)#34 | 3.8%(+4.99)#4,217 |
| 35. | Vado | 8.7% | 3.2%(+5.58)#35 | 3.8%(+4.92)#4,276 |
| 36. | La Cueva | 8.7% | 3.2%(+5.57)#36 | 3.8%(+4.90)#4,285 |
| 37. | Hatch | 8.4% | 3.2%(+5.28)#37 | 3.8%(+4.61)#4,559 |
| 38. | Dona Ana | 8.4% | 3.2%(+5.23)#38 | 3.8%(+4.57)#4,610 |
| 39. | San Felipe Pueblo | 8.4% | 3.2%(+5.20)#39 | 3.8%(+4.54)#4,639 |
| 40. | Pueblitos | 8.1% | 3.2%(+4.94)#40 | 3.8%(+4.28)#4,922 |
| 41. | Lake Arthur | 8.0% | 3.2%(+4.83)#41 | 3.8%(+4.17)#5,028 |
| 42. | Portales | 7.9% | 3.2%(+4.69)#42 | 3.8%(+4.03)#5,221 |
| 43. | Elida | 7.6% | 3.2%(+4.45)#43 | 3.8%(+3.79)#5,529 |
| 44. | Haystack | 7.5% | 3.2%(+4.33)#44 | 3.8%(+3.67)#5,685 |
| 45. | Tortugas | 7.4% | 3.2%(+4.24)#45 | 3.8%(+3.58)#5,793 |
| 46. | Corona | 7.4% | 3.2%(+4.24)#46 | 3.8%(+3.58)#5,811 |
| 47. | Chimayo | 7.4% | 3.2%(+4.24)#47 | 3.8%(+3.57)#5,818 |
| 48. | Tesuque Pueblo | 7.2% | 3.2%(+4.02)#48 | 3.8%(+3.36)#6,109 |
| 49. | Valle Vista | 6.8% | 3.2%(+3.58)#49 | 3.8%(+2.92)#6,765 |
| 50. | Carlsbad | 6.6% | 3.2%(+3.40)#50 | 3.8%(+2.73)#7,087 |
| 51. | Sandia Knolls | 6.5% | 3.2%(+3.38)#51 | 3.8%(+2.71)#7,117 |
| 52. | Dulce | 6.5% | 3.2%(+3.38)#52 | 3.8%(+2.71)#7,119 |
| 53. | Taos Pueblo | 6.5% | 3.2%(+3.36)#53 | 3.8%(+2.70)#7,135 |
| 54. | Angel Fire | 6.5% | 3.2%(+3.35)#54 | 3.8%(+2.68)#7,166 |
| 55. | Black Rock | 6.3% | 3.2%(+3.17)#55 | 3.8%(+2.50)#7,458 |
| 56. | Bayard | 6.3% | 3.2%(+3.13)#56 | 3.8%(+2.46)#7,506 |
| 57. | West Hammond | 6.3% | 3.2%(+3.12)#57 | 3.8%(+2.45)#7,522 |
| 58. | Pecos | 6.3% | 3.2%(+3.10)#58 | 3.8%(+2.44)#7,545 |
| 59. | Thoreau | 6.2% | 3.2%(+3.01)#59 | 3.8%(+2.35)#7,710 |
| 60. | Lovington | 6.1% | 3.2%(+2.91)#60 | 3.8%(+2.25)#7,892 |
| 61. | Chamita | 6.1% | 3.2%(+2.90)#61 | 3.8%(+2.24)#7,906 |
| 62. | Los Lunas | 6.0% | 3.2%(+2.84)#62 | 3.8%(+2.17)#8,047 |
| 63. | Santa Rosa | 5.9% | 3.2%(+2.77)#63 | 3.8%(+2.11)#8,170 |
| 64. | Los Chaves | 5.9% | 3.2%(+2.76)#64 | 3.8%(+2.10)#8,189 |
| 65. | Meadow Lake | 5.8% | 3.2%(+2.67)#65 | 3.8%(+2.00)#8,368 |
| 66. | Napi Headquarters | 5.8% | 3.2%(+2.65)#66 | 3.8%(+1.99)#8,406 |
| 67. | Eunice | 5.6% | 3.2%(+2.45)#67 | 3.8%(+1.79)#8,824 |
| 68. | Bosque Farms | 5.4% | 3.2%(+2.22)#68 | 3.8%(+1.56)#9,271 |
| 69. | Cotton City | 5.4% | 3.2%(+2.21)#69 | 3.8%(+1.55)#9,297 |
| 70. | Encinal | 5.3% | 3.2%(+2.10)#70 | 3.8%(+1.43)#9,562 |
| 71. | Algodones | 5.2% | 3.2%(+2.07)#71 | 3.8%(+1.41)#9,627 |
| 72. | Sunland Park | 5.2% | 3.2%(+2.00)#72 | 3.8%(+1.33)#9,804 |
| 73. | Sanostee | 5.1% | 3.2%(+1.92)#73 | 3.8%(+1.25)#9,967 |
| 74. | South Valley | 5.1% | 3.2%(+1.92)#74 | 3.8%(+1.25)#9,972 |
| 75. | Hobbs | 4.9% | 3.2%(+1.78)#75 | 3.8%(+1.12)#10,272 |
| 76. | Cochiti Lake | 4.9% | 3.2%(+1.71)#76 | 3.8%(+1.05)#10,445 |
| 77. | La Luz | 4.8% | 3.2%(+1.60)#77 | 3.8%(+0.932)#10,741 |
| 78. | Jaconita | 4.7% | 3.2%(+1.57)#78 | 3.8%(+0.909)#10,825 |
| 79. | Happy Valley | 4.6% | 3.2%(+1.47)#79 | 3.8%(+0.809)#11,100 |
| 80. | Jemez Pueblo | 4.6% | 3.2%(+1.44)#80 | 3.8%(+0.778)#11,179 |
| 81. | Rio Communities | 4.6% | 3.2%(+1.42)#81 | 3.8%(+0.754)#11,247 |
| 82. | Roswell | 4.6% | 3.2%(+1.41)#82 | 3.8%(+0.745)#11,262 |
| 83. | Newcomb | 4.5% | 3.2%(+1.35)#83 | 3.8%(+0.686)#11,427 |
| 84. | Bloomfield | 4.5% | 3.2%(+1.32)#84 | 3.8%(+0.660)#11,495 |
| 85. | Jal | 4.4% | 3.2%(+1.27)#85 | 3.8%(+0.609)#11,632 |
| 86. | Tatum | 4.4% | 3.2%(+1.20)#86 | 3.8%(+0.540)#11,797 |
| 87. | Clovis | 4.4% | 3.2%(+1.19)#87 | 3.8%(+0.528)#11,824 |
| 88. | Santa Ana Pueblo | 4.2% | 3.2%(+1.02)#88 | 3.8%(+0.354)#12,356 |
| 89. | La Plata | 4.1% | 3.2%(+0.982)#89 | 3.8%(+0.318)#12,463 |
| 90. | Melrose | 4.1% | 3.2%(+0.944)#90 | 3.8%(+0.279)#12,555 |
| 91. | Anthony | 4.1% | 3.2%(+0.898)#91 | 3.8%(+0.233)#12,699 |
| 92. | Artesia | 4.0% | 3.2%(+0.840)#92 | 3.8%(+0.175)#12,863 |
| 93. | North Valley | 4.0% | 3.2%(+0.813)#93 | 3.8%(+0.149)#12,942 |
| 94. | Truth Or Consequences | 3.9% | 3.2%(+0.728)#94 | 3.8%(+0.063)#13,190 |
| 95. | Agua Fria | 3.7% | 3.2%(+0.577)#95 | 3.8%(-0.087)#13,647 |
| 96. | Clayton | 3.7% | 3.2%(+0.570)#96 | 3.8%(-0.094)#13,664 |
| 97. | Cuba | 3.7% | 3.2%(+0.538)#97 | 3.8%(-0.127)#13,768 |
| 98. | Tucumcari | 3.7% | 3.2%(+0.519)#98 | 3.8%(-0.145)#13,818 |
| 99. | Chamberino | 3.6% | 3.2%(+0.476)#99 | 3.8%(-0.188)#13,949 |
| 100. | Sandia Heights | 3.6% | 3.2%(+0.439)#100 | 3.8%(-0.225)#14,048 |
Common Questions
What are the Top 10 Cities with the Highest Percentage of Population Employed in Material Moving in New Mexico?
Top 10 Cities with the Highest Percentage of Population Employed in Material Moving in New Mexico are:
#1
100.0%
#2
22.8%
#3
21.6%
#4
21.6%
#5
21.2%
#6
15.8%
#7
15.8%
#8
15.1%
#9
14.1%
#10
13.4%
What city has the Highest Percentage of Population Employed in Material Moving in New Mexico?
Watrous has the Highest Percentage of Population Employed in Material Moving in New Mexico with 100.0%.
What is the Percentage of Population Employed in Material Moving in the State of New Mexico?
Percentage of Population Employed in Material Moving in New Mexico is 3.2%.
What is the Percentage of Population Employed in Material Moving in the United States?
Percentage of Population Employed in Material Moving in the United States is 3.8%.