Woodlake, CA Map & Demographics
Woodlake Map
Woodlake Overview
$18,006
PER CAPITA INCOME
$48,879
AVG FAMILY INCOME
$44,719
AVG HOUSEHOLD INCOME
30.2%
WAGE / INCOME GAP [ % ]
69.8¢/ $1
WAGE / INCOME GAP [ $ ]
0.45
INEQUALITY / GINI INDEX
7,495
TOTAL POPULATION
3,563
MALE POPULATION
3,932
FEMALE POPULATION
90.62
MALES / 100 FEMALES
110.36
FEMALES / 100 MALES
28.7
MEDIAN AGE
3.9
AVG FAMILY SIZE
3.5
AVG HOUSEHOLD SIZE
3,003
LABOR FORCE [ PEOPLE ]
55.3%
PERCENT IN LABOR FORCE
9.1%
UNEMPLOYMENT RATE
Woodlake Zip Codes
Woodlake Area Codes
Income in Woodlake
Income Overview in Woodlake
Per Capita Income in Woodlake is $18,006, while median incomes of families and households are $48,879 and $44,719 respectively.
| Characteristic | Number | Measure |
| Per Capita Income | 7,495 | $18,006 |
| Median Family Income | 1,800 | $48,879 |
| Mean Family Income | 1,800 | $66,275 |
| Median Household Income | 2,121 | $44,719 |
| Mean Household Income | 2,121 | $61,756 |
| Income Deficit | 1,800 | $0 |
| Wage / Income Gap (%) | 7,495 | 30.24% |
| Wage / Income Gap ($) | 7,495 | 69.76¢ per $1 |
| Gini / Inequality Index | 7,495 | 0.45 |
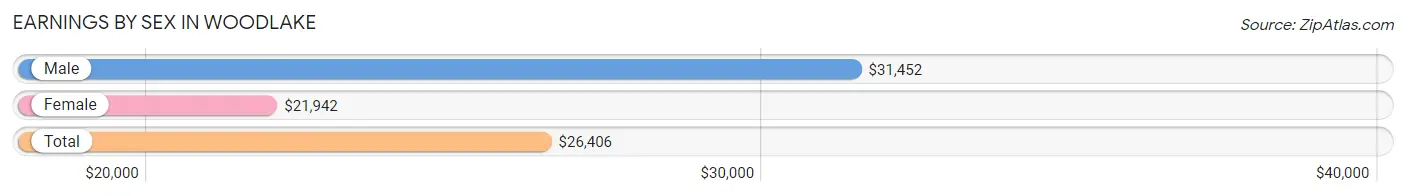
Earnings by Sex in Woodlake
Average Earnings in Woodlake are $26,406, $31,452 for men and $21,942 for women, a difference of 30.2%.
| Sex | Number | Average Earnings |
| Male | 1,711 (53.0%) | $31,452 |
| Female | 1,518 (47.0%) | $21,942 |
| Total | 3,229 (100.0%) | $26,406 |
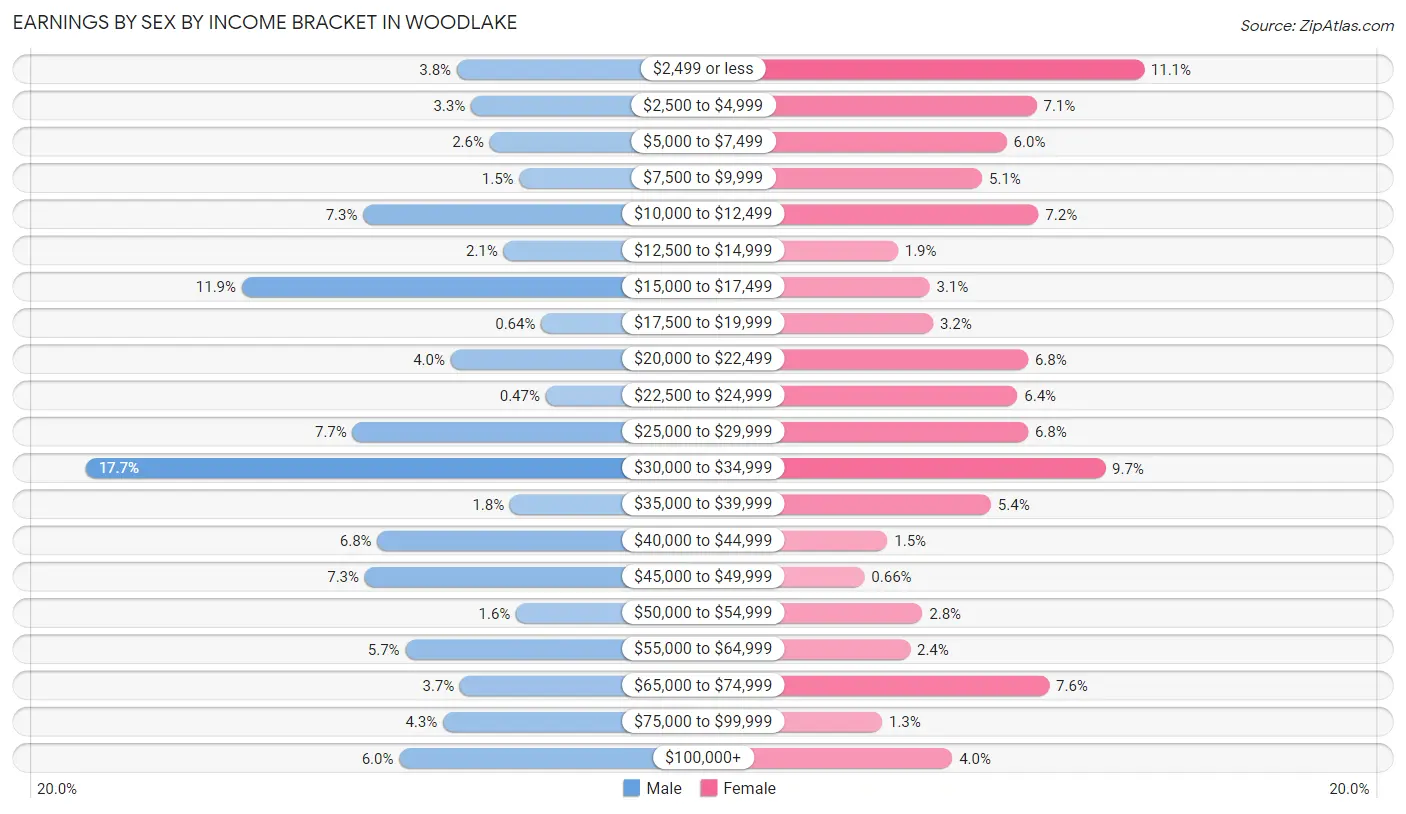
Earnings by Sex by Income Bracket in Woodlake
The most common earnings brackets in Woodlake are $30,000 to $34,999 for men (303 | 17.7%) and $2,499 or less for women (169 | 11.1%).
| Income | Male | Female |
| $2,499 or less | 65 (3.8%) | 169 (11.1%) |
| $2,500 to $4,999 | 56 (3.3%) | 108 (7.1%) |
| $5,000 to $7,499 | 44 (2.6%) | 91 (6.0%) |
| $7,500 to $9,999 | 25 (1.5%) | 77 (5.1%) |
| $10,000 to $12,499 | 125 (7.3%) | 109 (7.2%) |
| $12,500 to $14,999 | 35 (2.1%) | 29 (1.9%) |
| $15,000 to $17,499 | 203 (11.9%) | 47 (3.1%) |
| $17,500 to $19,999 | 11 (0.6%) | 49 (3.2%) |
| $20,000 to $22,499 | 69 (4.0%) | 103 (6.8%) |
| $22,500 to $24,999 | 8 (0.5%) | 97 (6.4%) |
| $25,000 to $29,999 | 132 (7.7%) | 103 (6.8%) |
| $30,000 to $34,999 | 303 (17.7%) | 147 (9.7%) |
| $35,000 to $39,999 | 31 (1.8%) | 82 (5.4%) |
| $40,000 to $44,999 | 116 (6.8%) | 23 (1.5%) |
| $45,000 to $49,999 | 124 (7.2%) | 10 (0.7%) |
| $50,000 to $54,999 | 27 (1.6%) | 43 (2.8%) |
| $55,000 to $64,999 | 98 (5.7%) | 36 (2.4%) |
| $65,000 to $74,999 | 63 (3.7%) | 115 (7.6%) |
| $75,000 to $99,999 | 74 (4.3%) | 20 (1.3%) |
| $100,000+ | 102 (6.0%) | 60 (4.0%) |
| Total | 1,711 (100.0%) | 1,518 (100.0%) |
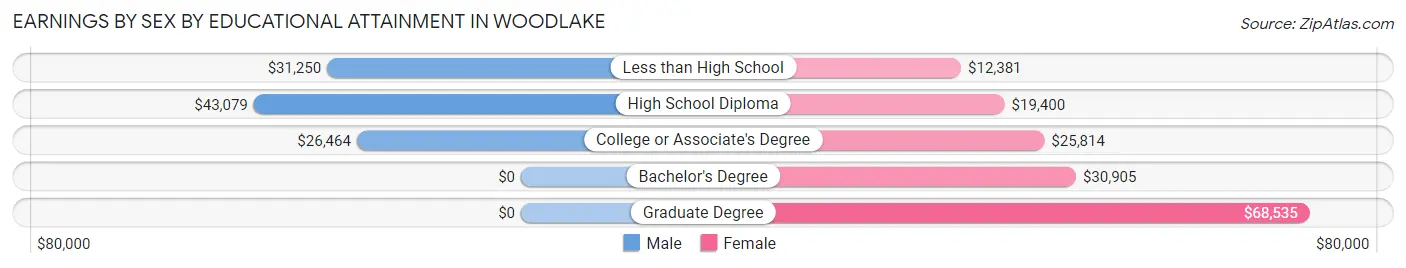
Earnings by Sex by Educational Attainment in Woodlake
Average earnings in Woodlake are $33,264 for men and $23,802 for women, a difference of 28.4%. Men with an educational attainment of high school diploma enjoy the highest average annual earnings of $43,079, while those with college or associate's degree education earn the least with $26,464. Women with an educational attainment of graduate degree earn the most with the average annual earnings of $68,535, while those with less than high school education have the smallest earnings of $12,381.
| Educational Attainment | Male Income | Female Income |
| Less than High School | $31,250 | $12,381 |
| High School Diploma | $43,079 | $19,400 |
| College or Associate's Degree | $26,464 | $25,814 |
| Bachelor's Degree | - | - |
| Graduate Degree | - | - |
| Total | $33,264 | $23,802 |
Family Income in Woodlake
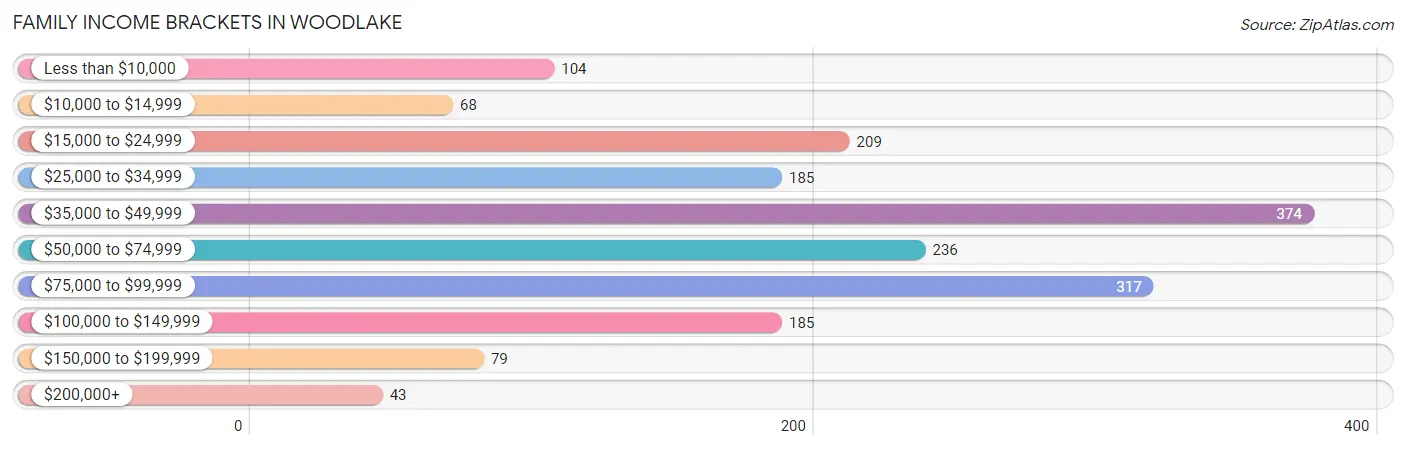
Family Income Brackets in Woodlake
According to the Woodlake family income data, there are 374 families falling into the $35,000 to $49,999 income range, which is the most common income bracket and makes up 20.8% of all families. Conversely, the $200,000+ income bracket is the least frequent group with only 43 families (2.4%) belonging to this category.
| Income Bracket | # Families | % Families |
| Less than $10,000 | 104 | 5.8% |
| $10,000 to $14,999 | 68 | 3.8% |
| $15,000 to $24,999 | 209 | 11.6% |
| $25,000 to $34,999 | 185 | 10.3% |
| $35,000 to $49,999 | 374 | 20.8% |
| $50,000 to $74,999 | 236 | 13.1% |
| $75,000 to $99,999 | 317 | 17.6% |
| $100,000 to $149,999 | 185 | 10.3% |
| $150,000 to $199,999 | 79 | 4.4% |
| $200,000+ | 43 | 2.4% |
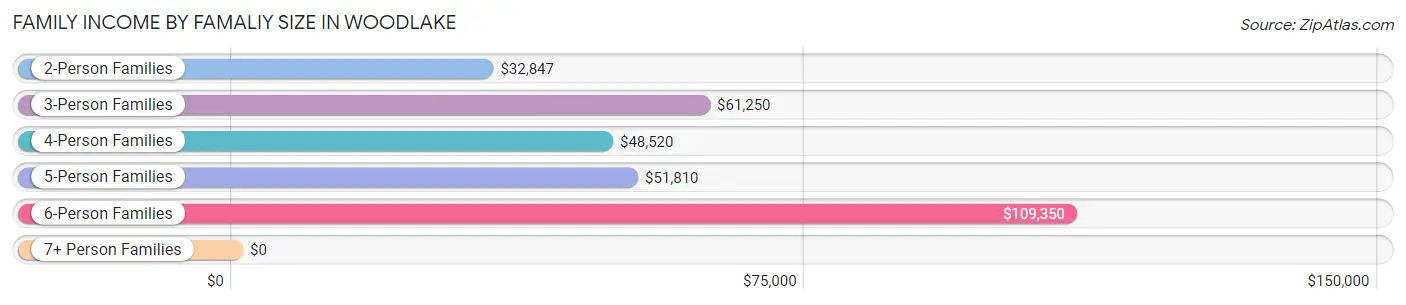
Family Income by Famaliy Size in Woodlake
6-person families (127 | 7.1%) account for the highest median family income in Woodlake with $109,350 per family, while 3-person families (480 | 26.7%) have the highest median income of $20,417 per family member.
| Income Bracket | # Families | Median Income |
| 2-Person Families | 398 (22.1%) | $32,847 |
| 3-Person Families | 480 (26.7%) | $61,250 |
| 4-Person Families | 439 (24.4%) | $48,520 |
| 5-Person Families | 292 (16.2%) | $51,810 |
| 6-Person Families | 127 (7.1%) | $109,350 |
| 7+ Person Families | 64 (3.6%) | $0 |
| Total | 1,800 (100.0%) | $48,879 |
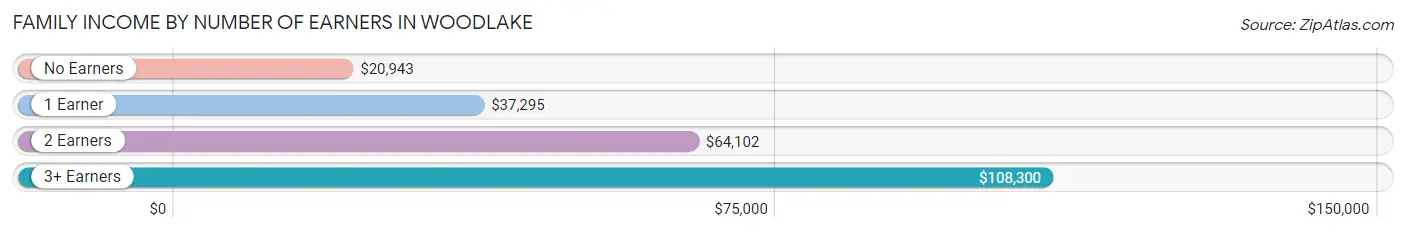
Family Income by Number of Earners in Woodlake
The median family income in Woodlake is $48,879, with families comprising 3+ earners (302) having the highest median family income of $108,300, while families with no earners (185) have the lowest median family income of $20,943, accounting for 16.8% and 10.3% of families, respectively.
| Number of Earners | # Families | Median Income |
| No Earners | 185 (10.3%) | $20,943 |
| 1 Earner | 810 (45.0%) | $37,295 |
| 2 Earners | 503 (27.9%) | $64,102 |
| 3+ Earners | 302 (16.8%) | $108,300 |
| Total | 1,800 (100.0%) | $48,879 |
Household Income in Woodlake
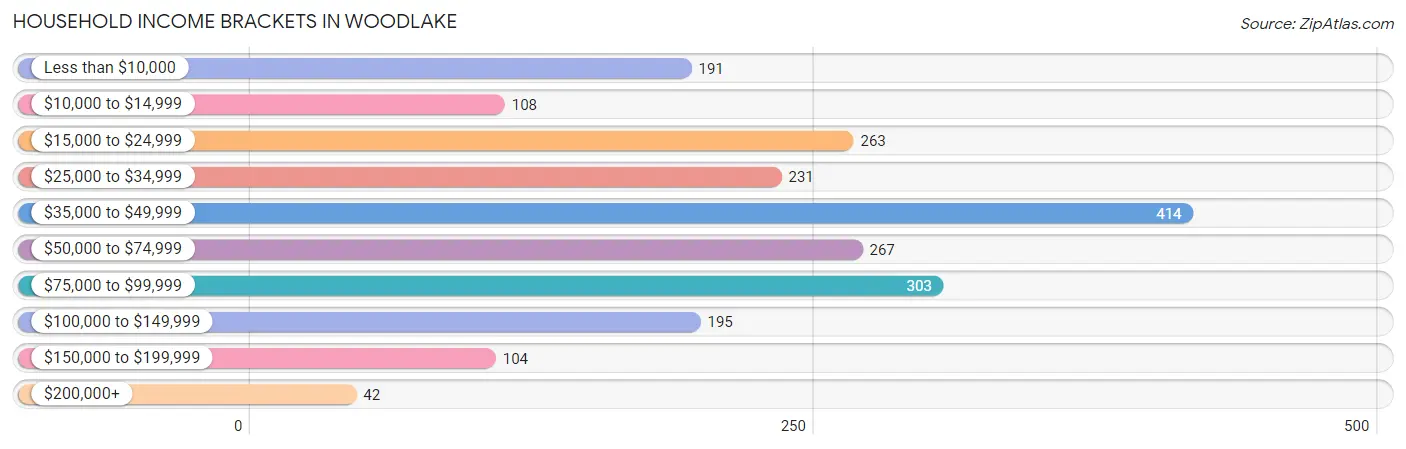
Household Income Brackets in Woodlake
With 414 households falling in the category, the $35,000 to $49,999 income range is the most frequent in Woodlake, accounting for 19.5% of all households. In contrast, only 42 households (2.0%) fall into the $200,000+ income bracket, making it the least populous group.
| Income Bracket | # Households | % Households |
| Less than $10,000 | 191 | 9.0% |
| $10,000 to $14,999 | 108 | 5.1% |
| $15,000 to $24,999 | 263 | 12.4% |
| $25,000 to $34,999 | 231 | 10.9% |
| $35,000 to $49,999 | 414 | 19.5% |
| $50,000 to $74,999 | 267 | 12.6% |
| $75,000 to $99,999 | 303 | 14.3% |
| $100,000 to $149,999 | 195 | 9.2% |
| $150,000 to $199,999 | 104 | 4.9% |
| $200,000+ | 42 | 2.0% |
Household Income by Householder Age in Woodlake
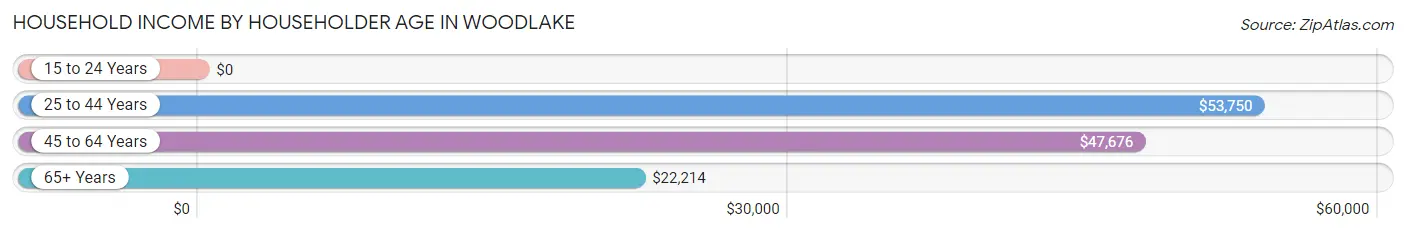
The median household income in Woodlake is $44,719, with the highest median household income of $53,750 found in the 25 to 44 years age bracket for the primary householder. A total of 880 households (41.5%) fall into this category.
| Income Bracket | # Households | Median Income |
| 15 to 24 Years | 0 (0.0%) | $0 |
| 25 to 44 Years | 880 (41.5%) | $53,750 |
| 45 to 64 Years | 830 (39.1%) | $47,676 |
| 65+ Years | 411 (19.4%) | $22,214 |
| Total | 2,121 (100.0%) | $44,719 |
Poverty in Woodlake
Income Below Poverty by Sex and Age in Woodlake
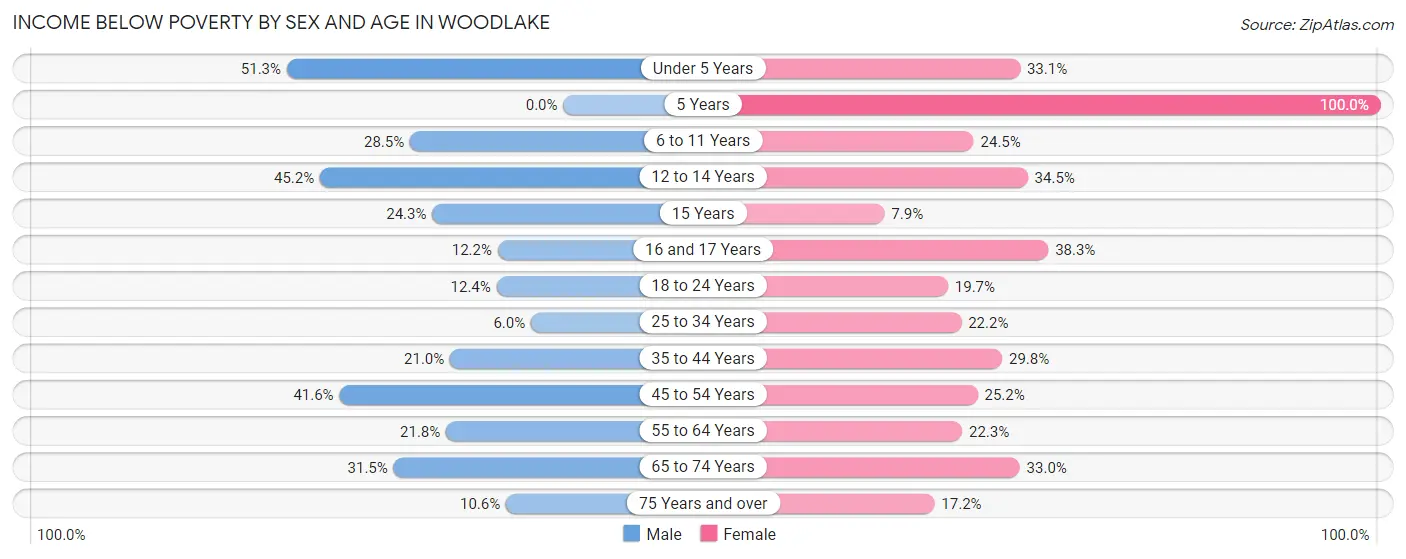
With 23.0% poverty level for males and 26.0% for females among the residents of Woodlake, under 5 year old males and 5 year old females are the most vulnerable to poverty, with 97 males (51.3%) and 27 females (100.0%) in their respective age groups living below the poverty level.
| Age Bracket | Male | Female |
| Under 5 Years | 97 (51.3%) | 168 (33.1%) |
| 5 Years | 0 (0.0%) | 27 (100.0%) |
| 6 to 11 Years | 130 (28.4%) | 81 (24.5%) |
| 12 to 14 Years | 42 (45.2%) | 59 (34.5%) |
| 15 Years | 27 (24.3%) | 14 (7.9%) |
| 16 and 17 Years | 23 (12.2%) | 59 (38.3%) |
| 18 to 24 Years | 58 (12.4%) | 75 (19.7%) |
| 25 to 34 Years | 33 (6.0%) | 139 (22.2%) |
| 35 to 44 Years | 99 (21.0%) | 119 (29.7%) |
| 45 to 54 Years | 170 (41.6%) | 99 (25.2%) |
| 55 to 64 Years | 84 (21.8%) | 75 (22.3%) |
| 65 to 74 Years | 46 (31.5%) | 68 (33.0%) |
| 75 Years and over | 10 (10.6%) | 38 (17.2%) |
| Total | 819 (23.0%) | 1,021 (26.0%) |
Income Above Poverty by Sex and Age in Woodlake
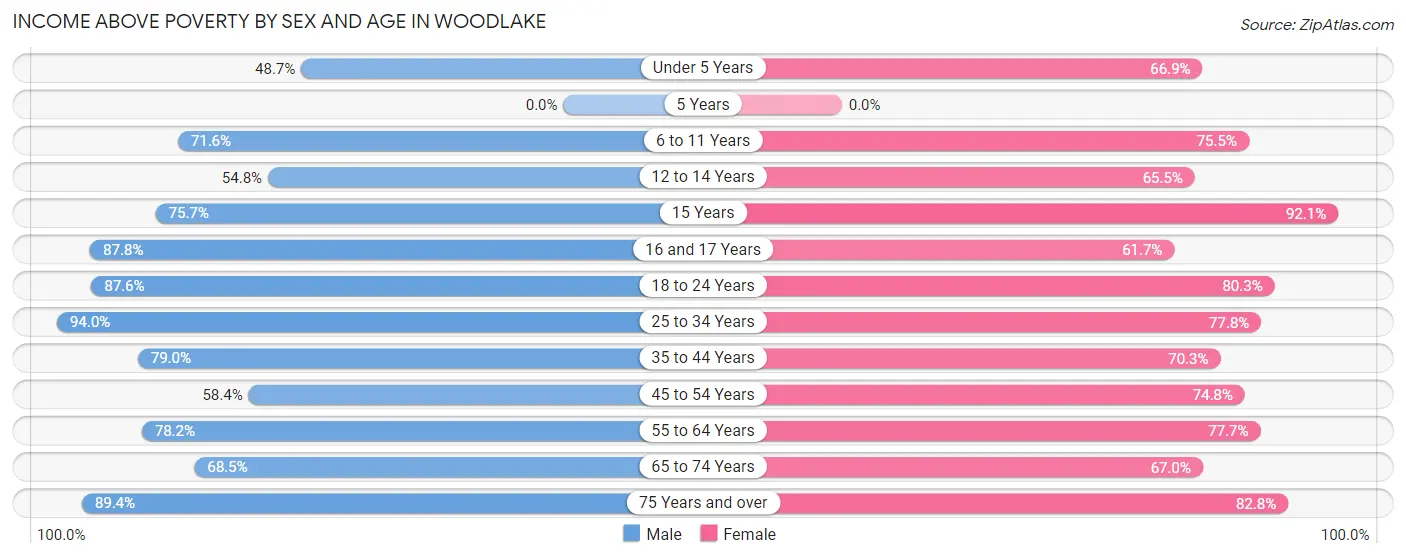
According to the poverty statistics in Woodlake, males aged 25 to 34 years and females aged 15 years are the age groups that are most secure financially, with 94.0% of males and 92.1% of females in these age groups living above the poverty line.
| Age Bracket | Male | Female |
| Under 5 Years | 92 (48.7%) | 340 (66.9%) |
| 5 Years | 0 (0.0%) | 0 (0.0%) |
| 6 to 11 Years | 327 (71.6%) | 250 (75.5%) |
| 12 to 14 Years | 51 (54.8%) | 112 (65.5%) |
| 15 Years | 84 (75.7%) | 163 (92.1%) |
| 16 and 17 Years | 166 (87.8%) | 95 (61.7%) |
| 18 to 24 Years | 410 (87.6%) | 306 (80.3%) |
| 25 to 34 Years | 517 (94.0%) | 488 (77.8%) |
| 35 to 44 Years | 372 (79.0%) | 281 (70.3%) |
| 45 to 54 Years | 239 (58.4%) | 294 (74.8%) |
| 55 to 64 Years | 302 (78.2%) | 261 (77.7%) |
| 65 to 74 Years | 100 (68.5%) | 138 (67.0%) |
| 75 Years and over | 84 (89.4%) | 183 (82.8%) |
| Total | 2,744 (77.0%) | 2,911 (74.0%) |
Income Below Poverty Among Married-Couple Families in Woodlake
The poverty statistics for married-couple families in Woodlake show that 13.9% or 174 of the total 1,250 families live below the poverty line. Families with 5 or more children have the highest poverty rate of 100.0%, comprising of 12 families. On the other hand, families with 3 or 4 children have the lowest poverty rate of 0.0%, which includes 0 families.
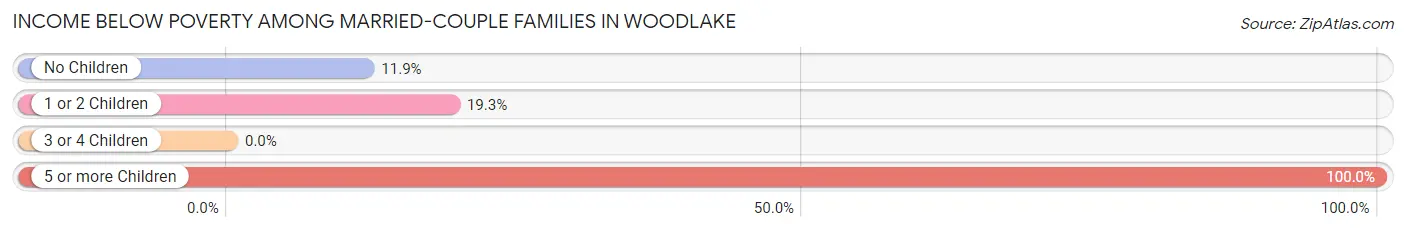
| Children | Above Poverty | Below Poverty |
| No Children | 490 (88.1%) | 66 (11.9%) |
| 1 or 2 Children | 401 (80.7%) | 96 (19.3%) |
| 3 or 4 Children | 185 (100.0%) | 0 (0.0%) |
| 5 or more Children | 0 (0.0%) | 12 (100.0%) |
| Total | 1,076 (86.1%) | 174 (13.9%) |
Income Below Poverty Among Single-Parent Households in Woodlake
According to the poverty data in Woodlake, 12.3% or 21 single-father households and 55.7% or 211 single-mother households are living below the poverty line. Among single-father households, those with no children have the highest poverty rate, with 7 households (15.9%) experiencing poverty. Likewise, among single-mother households, those with 5 or more children have the highest poverty rate, with 41 households (100.0%) falling below the poverty line.
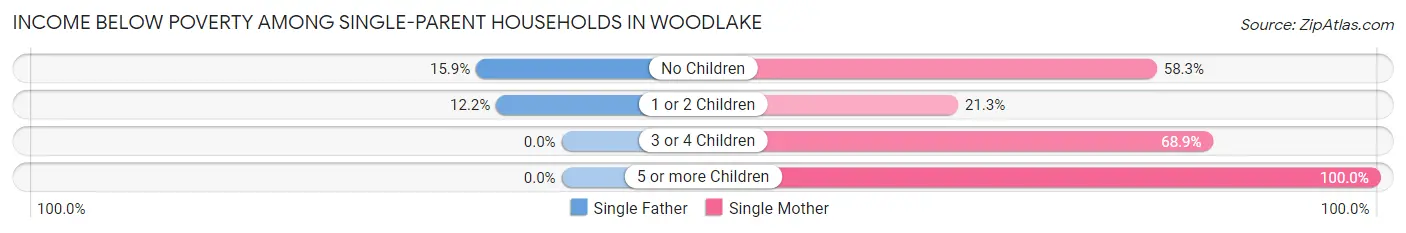
| Children | Single Father | Single Mother |
| No Children | 7 (15.9%) | 63 (58.3%) |
| 1 or 2 Children | 14 (12.2%) | 23 (21.3%) |
| 3 or 4 Children | 0 (0.0%) | 84 (68.9%) |
| 5 or more Children | 0 (0.0%) | 41 (100.0%) |
| Total | 21 (12.3%) | 211 (55.7%) |
Income Below Poverty Among Married-Couple vs Single-Parent Households in Woodlake
The poverty data for Woodlake shows that 174 of the married-couple family households (13.9%) and 232 of the single-parent households (42.2%) are living below the poverty level. Within the married-couple family households, those with 5 or more children have the highest poverty rate, with 12 households (100.0%) falling below the poverty line. Among the single-parent households, those with 5 or more children have the highest poverty rate, with 41 household (100.0%) living below poverty.
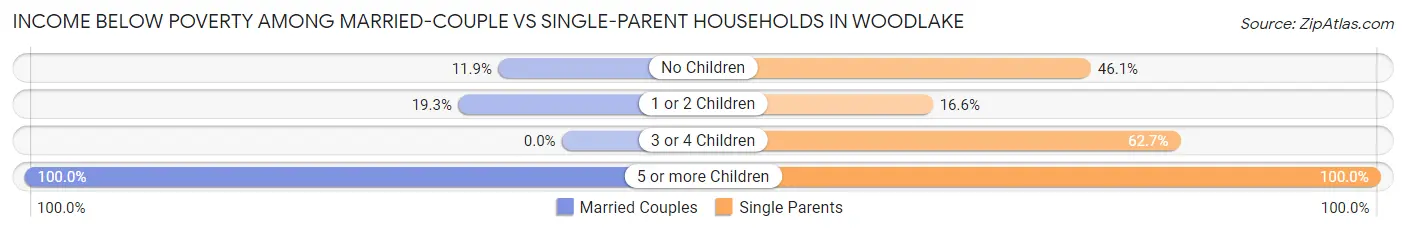
| Children | Married-Couple Families | Single-Parent Households |
| No Children | 66 (11.9%) | 70 (46.1%) |
| 1 or 2 Children | 96 (19.3%) | 37 (16.6%) |
| 3 or 4 Children | 0 (0.0%) | 84 (62.7%) |
| 5 or more Children | 12 (100.0%) | 41 (100.0%) |
| Total | 174 (13.9%) | 232 (42.2%) |
Race in Woodlake
The most populous races in Woodlake are Hispanic or Latino (6,710 | 89.5%), Some other Race (3,574 | 47.7%), and White / Caucasian (2,595 | 34.6%).
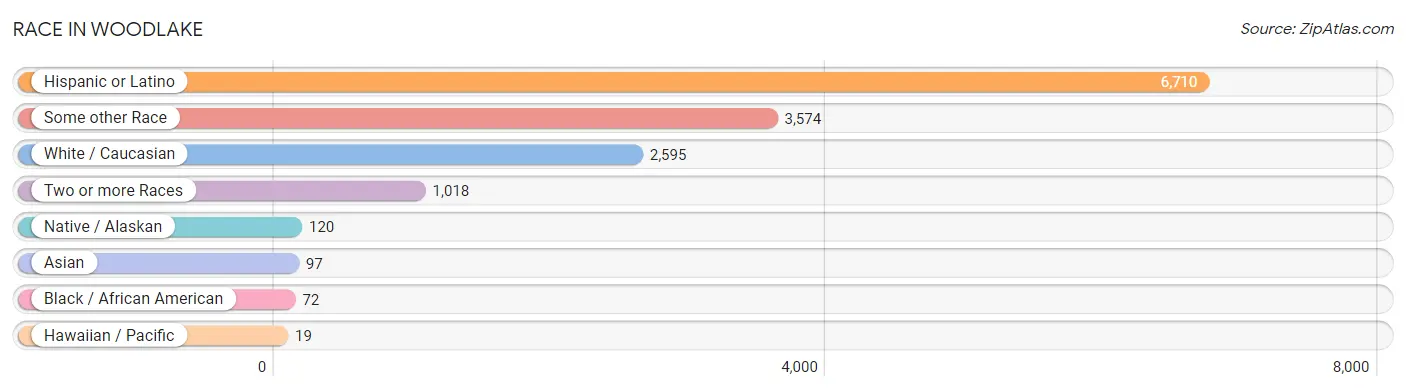
| Race | # Population | % Population |
| Asian | 97 | 1.3% |
| Black / African American | 72 | 1.0% |
| Hawaiian / Pacific | 19 | 0.3% |
| Hispanic or Latino | 6,710 | 89.5% |
| Native / Alaskan | 120 | 1.6% |
| White / Caucasian | 2,595 | 34.6% |
| Two or more Races | 1,018 | 13.6% |
| Some other Race | 3,574 | 47.7% |
| Total | 7,495 | 100.0% |
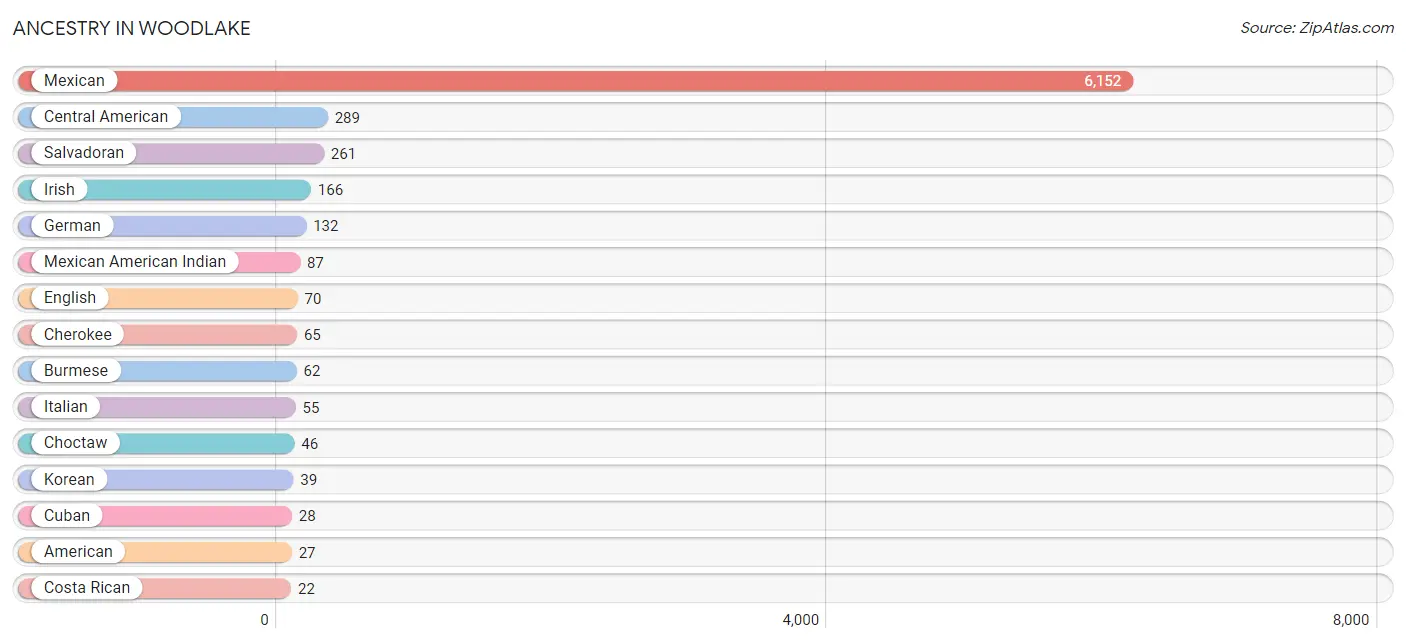
Ancestry in Woodlake
The most populous ancestries reported in Woodlake are Mexican (6,152 | 82.1%), Central American (289 | 3.9%), Salvadoran (261 | 3.5%), Irish (166 | 2.2%), and German (132 | 1.8%), together accounting for 93.4% of all Woodlake residents.
| Ancestry | # Population | % Population |
| American | 27 | 0.4% |
| Arab | 11 | 0.2% |
| Burmese | 62 | 0.8% |
| Central American | 289 | 3.9% |
| Central American Indian | 13 | 0.2% |
| Cherokee | 65 | 0.9% |
| Choctaw | 46 | 0.6% |
| Costa Rican | 22 | 0.3% |
| Cuban | 28 | 0.4% |
| English | 70 | 0.9% |
| European | 8 | 0.1% |
| French | 8 | 0.1% |
| German | 132 | 1.8% |
| Guatemalan | 6 | 0.1% |
| Irish | 166 | 2.2% |
| Italian | 55 | 0.7% |
| Japanese | 13 | 0.2% |
| Korean | 39 | 0.5% |
| Mexican | 6,152 | 82.1% |
| Mexican American Indian | 87 | 1.2% |
| Puerto Rican | 13 | 0.2% |
| Salvadoran | 261 | 3.5% |
| Swiss | 6 | 0.1% |
| Thai | 22 | 0.3% |
| Yuman | 9 | 0.1% | View All 25 Rows |
Immigrants in Woodlake
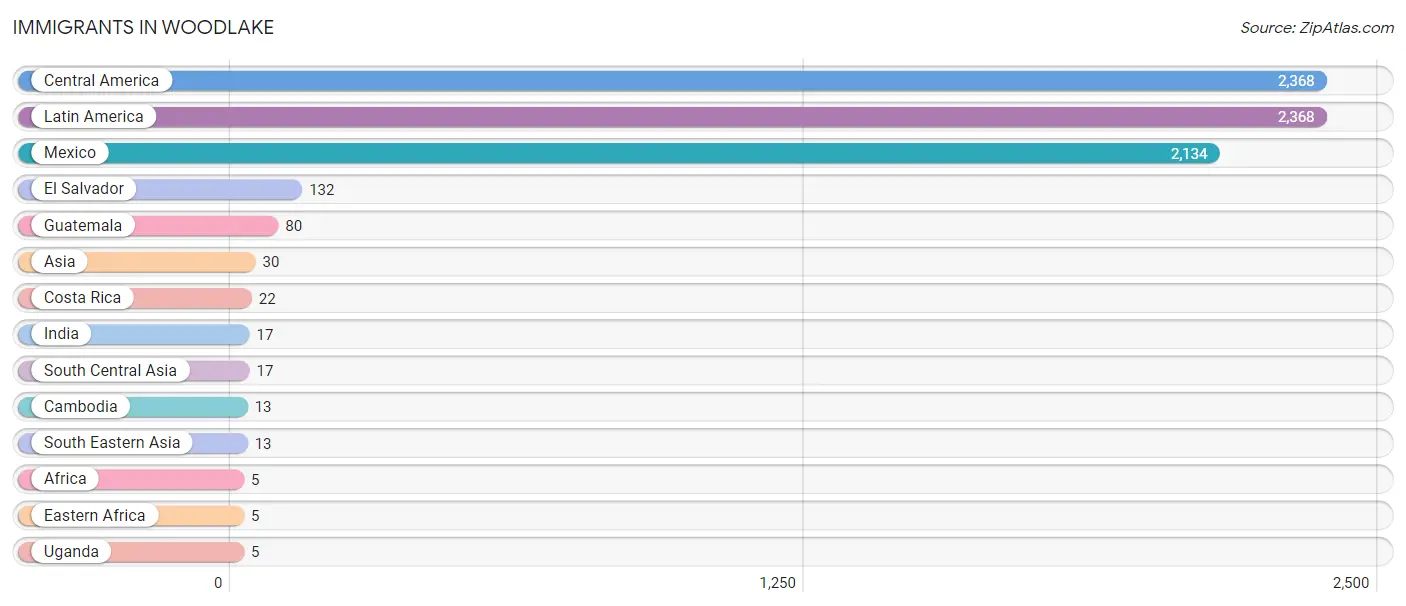
The most numerous immigrant groups reported in Woodlake came from Central America (2,368 | 31.6%), Latin America (2,368 | 31.6%), Mexico (2,134 | 28.5%), El Salvador (132 | 1.8%), and Guatemala (80 | 1.1%), together accounting for 94.5% of all Woodlake residents.
| Immigration Origin | # Population | % Population |
| Africa | 5 | 0.1% |
| Asia | 30 | 0.4% |
| Cambodia | 13 | 0.2% |
| Central America | 2,368 | 31.6% |
| Costa Rica | 22 | 0.3% |
| Eastern Africa | 5 | 0.1% |
| El Salvador | 132 | 1.8% |
| Guatemala | 80 | 1.1% |
| India | 17 | 0.2% |
| Latin America | 2,368 | 31.6% |
| Mexico | 2,134 | 28.5% |
| South Central Asia | 17 | 0.2% |
| South Eastern Asia | 13 | 0.2% |
| Uganda | 5 | 0.1% | View All 14 Rows |
Sex and Age in Woodlake
Sex and Age in Woodlake
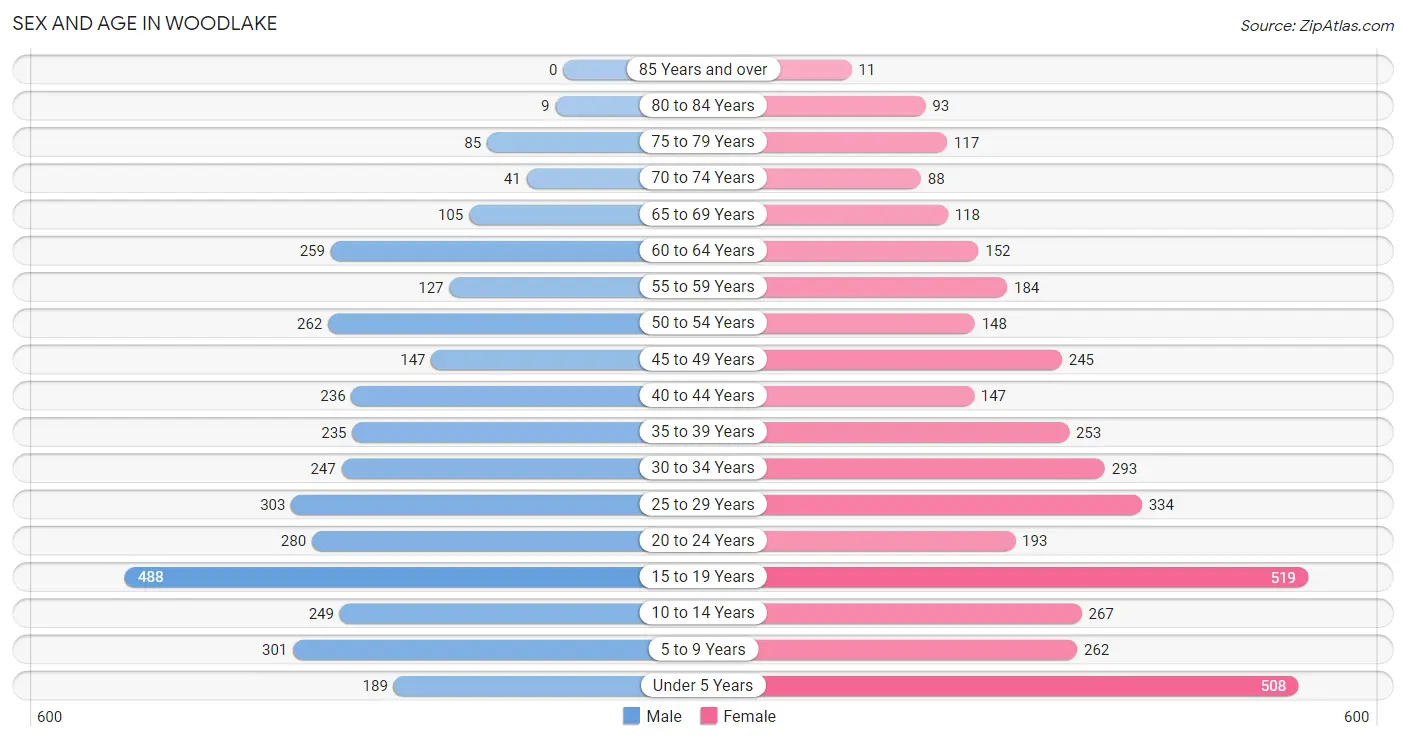
The most populous age groups in Woodlake are 15 to 19 Years (488 | 13.7%) for men and 15 to 19 Years (519 | 13.2%) for women.
| Age Bracket | Male | Female |
| Under 5 Years | 189 (5.3%) | 508 (12.9%) |
| 5 to 9 Years | 301 (8.5%) | 262 (6.7%) |
| 10 to 14 Years | 249 (7.0%) | 267 (6.8%) |
| 15 to 19 Years | 488 (13.7%) | 519 (13.2%) |
| 20 to 24 Years | 280 (7.9%) | 193 (4.9%) |
| 25 to 29 Years | 303 (8.5%) | 334 (8.5%) |
| 30 to 34 Years | 247 (6.9%) | 293 (7.4%) |
| 35 to 39 Years | 235 (6.6%) | 253 (6.4%) |
| 40 to 44 Years | 236 (6.6%) | 147 (3.7%) |
| 45 to 49 Years | 147 (4.1%) | 245 (6.2%) |
| 50 to 54 Years | 262 (7.3%) | 148 (3.8%) |
| 55 to 59 Years | 127 (3.6%) | 184 (4.7%) |
| 60 to 64 Years | 259 (7.3%) | 152 (3.9%) |
| 65 to 69 Years | 105 (2.9%) | 118 (3.0%) |
| 70 to 74 Years | 41 (1.1%) | 88 (2.2%) |
| 75 to 79 Years | 85 (2.4%) | 117 (3.0%) |
| 80 to 84 Years | 9 (0.3%) | 93 (2.4%) |
| 85 Years and over | 0 (0.0%) | 11 (0.3%) |
| Total | 3,563 (100.0%) | 3,932 (100.0%) |
Families and Households in Woodlake
Median Family Size in Woodlake
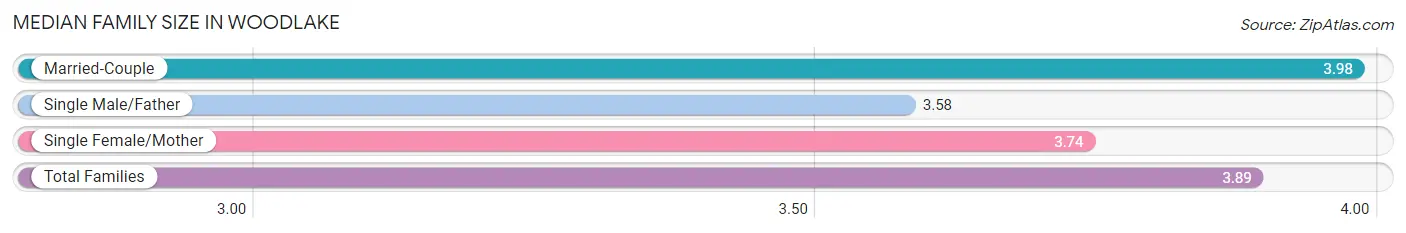
The median family size in Woodlake is 3.89 persons per family, with married-couple families (1,250 | 69.4%) accounting for the largest median family size of 3.98 persons per family. On the other hand, single male/father families (171 | 9.5%) represent the smallest median family size with 3.58 persons per family.
| Family Type | # Families | Family Size |
| Married-Couple | 1,250 (69.4%) | 3.98 |
| Single Male/Father | 171 (9.5%) | 3.58 |
| Single Female/Mother | 379 (21.1%) | 3.74 |
| Total Families | 1,800 (100.0%) | 3.89 |
Median Household Size in Woodlake
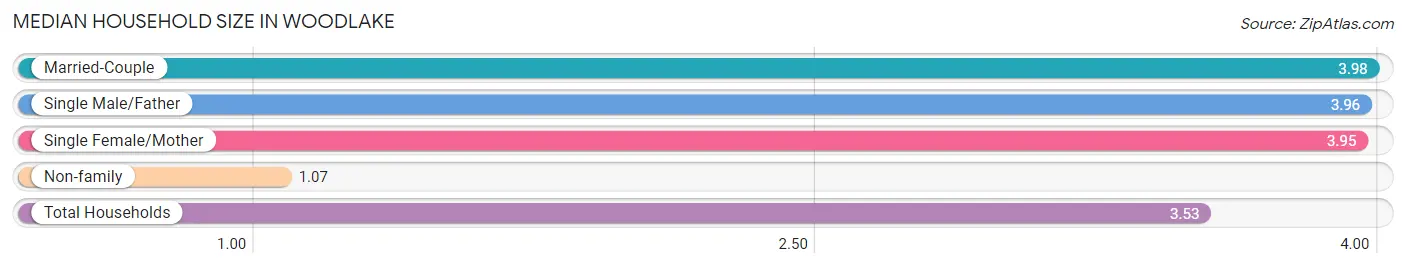
The median household size in Woodlake is 3.53 persons per household, with married-couple households (1,250 | 58.9%) accounting for the largest median household size of 3.98 persons per household. non-family households (321 | 15.1%) represent the smallest median household size with 1.07 persons per household.
| Household Type | # Households | Household Size |
| Married-Couple | 1,250 (58.9%) | 3.98 |
| Single Male/Father | 171 (8.1%) | 3.96 |
| Single Female/Mother | 379 (17.9%) | 3.95 |
| Non-family | 321 (15.1%) | 1.07 |
| Total Households | 2,121 (100.0%) | 3.53 |
Household Size by Marriage Status in Woodlake
Out of a total of 2,121 households in Woodlake, 1,800 (84.9%) are family households, while 321 (15.1%) are nonfamily households. The most numerous type of family households are 4-person households, comprising 519, and the most common type of nonfamily households are 1-person households, comprising 302.
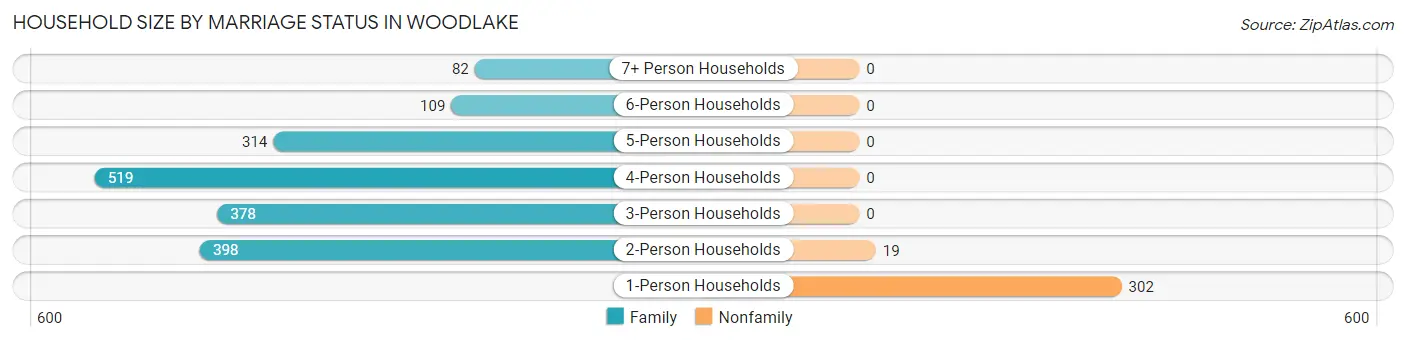
| Household Size | Family Households | Nonfamily Households |
| 1-Person Households | - | 302 (14.2%) |
| 2-Person Households | 398 (18.8%) | 19 (0.9%) |
| 3-Person Households | 378 (17.8%) | 0 (0.0%) |
| 4-Person Households | 519 (24.5%) | 0 (0.0%) |
| 5-Person Households | 314 (14.8%) | 0 (0.0%) |
| 6-Person Households | 109 (5.1%) | 0 (0.0%) |
| 7+ Person Households | 82 (3.9%) | 0 (0.0%) |
| Total | 1,800 (84.9%) | 321 (15.1%) |
Female Fertility in Woodlake
Fertility by Age in Woodlake
Average fertility rate in Woodlake is 76.0 births per 1,000 women. Women in the age bracket of 20 to 34 years have the highest fertility rate with 160.0 births per 1,000 women. Women in the age bracket of 20 to 34 years acount for 85.1% of all women with births.
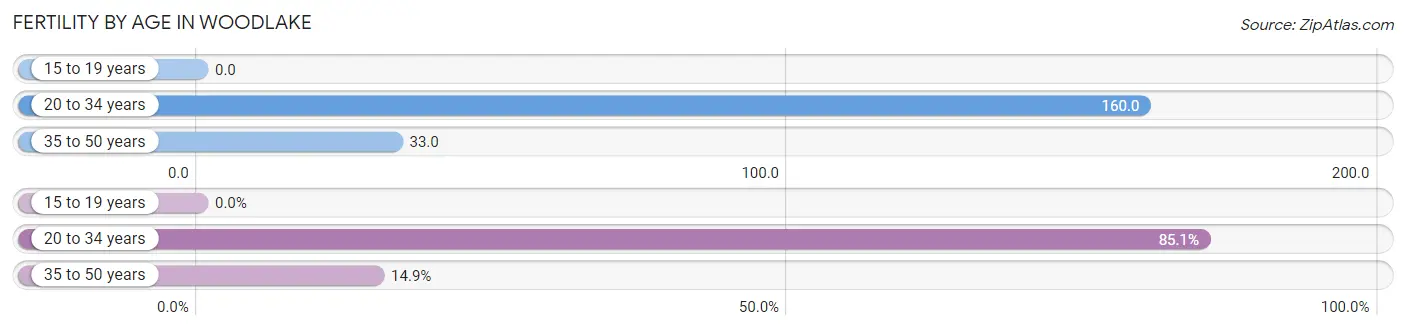
| Age Bracket | Women with Births | Births / 1,000 Women |
| 15 to 19 years | 0 (0.0%) | 0.0 |
| 20 to 34 years | 131 (85.1%) | 160.0 |
| 35 to 50 years | 23 (14.9%) | 33.0 |
| Total | 154 (100.0%) | 76.0 |
Fertility by Age by Marriage Status in Woodlake
41.6% of women with births (154) in Woodlake are married. The highest percentage of unmarried women with births falls into 20 to 34 years age bracket with 68.7% of them unmarried at the time of birth, while the lowest percentage of unmarried women with births belong to 35 to 50 years age bracket with 0.0% of them unmarried.
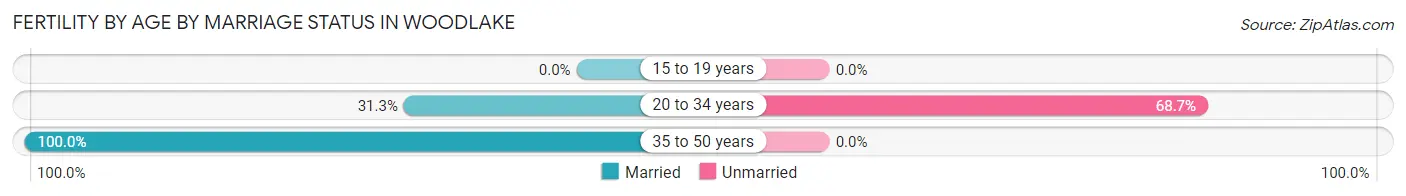
| Age Bracket | Married | Unmarried |
| 15 to 19 years | 0 (0.0%) | 0 (0.0%) |
| 20 to 34 years | 41 (31.3%) | 90 (68.7%) |
| 35 to 50 years | 23 (100.0%) | 0 (0.0%) |
| Total | 64 (41.6%) | 90 (58.4%) |
Fertility by Education in Woodlake
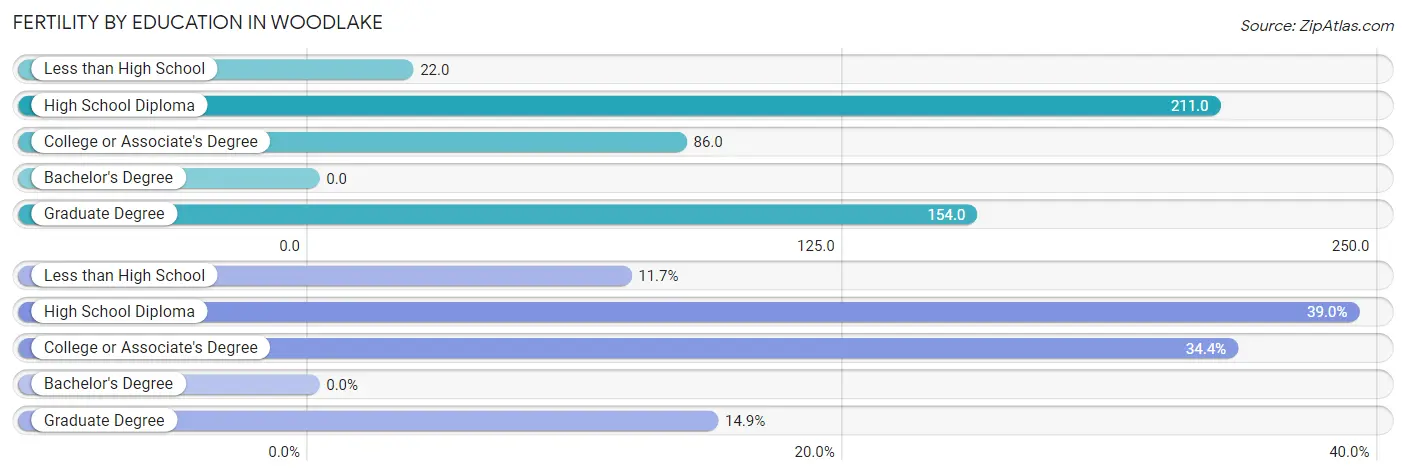
| Educational Attainment | Women with Births | Births / 1,000 Women |
| Less than High School | 18 (11.7%) | 22.0 |
| High School Diploma | 60 (39.0%) | 211.0 |
| College or Associate's Degree | 53 (34.4%) | 86.0 |
| Bachelor's Degree | 0 (0.0%) | 0.0 |
| Graduate Degree | 23 (14.9%) | 154.0 |
| Total | 154 (100.0%) | 76.0 |
Fertility by Education by Marriage Status in Woodlake
58.4% of women with births in Woodlake are unmarried. Women with the educational attainment of graduate degree are most likely to be married with 100.0% of them married at childbirth, while women with the educational attainment of less than high school are least likely to be married with 100.0% of them unmarried at childbirth.
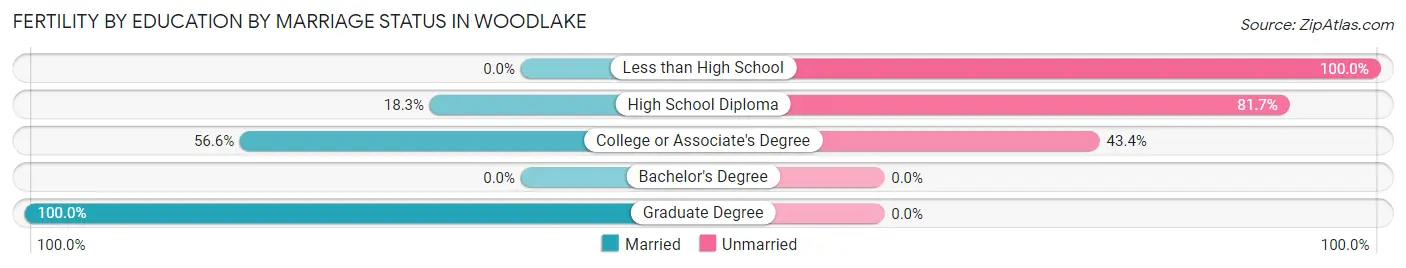
| Educational Attainment | Married | Unmarried |
| Less than High School | 0 (0.0%) | 18 (100.0%) |
| High School Diploma | 11 (18.3%) | 49 (81.7%) |
| College or Associate's Degree | 30 (56.6%) | 23 (43.4%) |
| Bachelor's Degree | 0 (0.0%) | 0 (0.0%) |
| Graduate Degree | 23 (100.0%) | 0 (0.0%) |
| Total | 64 (41.6%) | 90 (58.4%) |
Employment Characteristics in Woodlake
Employment by Class of Employer in Woodlake
Among the 2,653 employed individuals in Woodlake, private company employees (1,877 | 70.8%), local government employees (267 | 10.1%), and not-for-profit organizations (226 | 8.5%) make up the most common classes of employment.
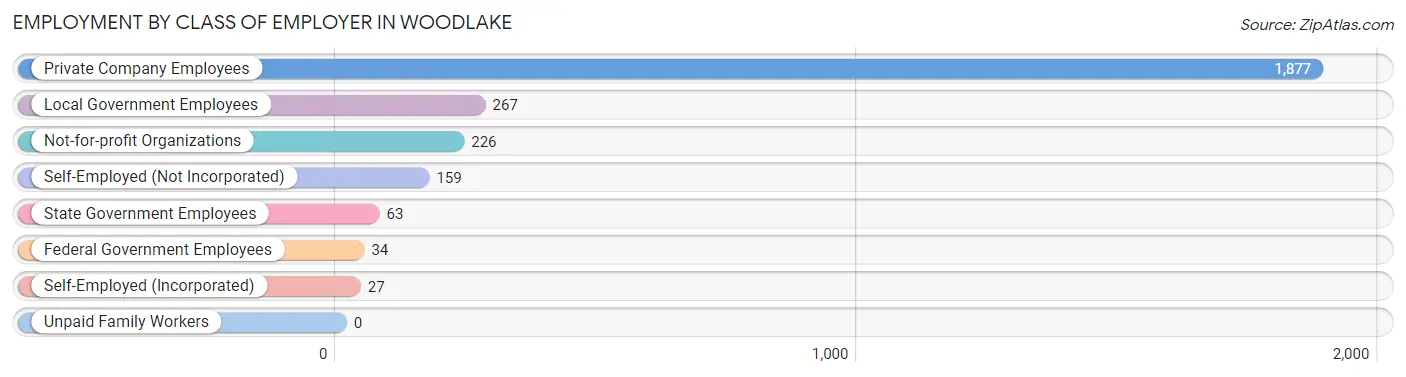
| Employer Class | # Employees | % Employees |
| Private Company Employees | 1,877 | 70.8% |
| Self-Employed (Incorporated) | 27 | 1.0% |
| Self-Employed (Not Incorporated) | 159 | 6.0% |
| Not-for-profit Organizations | 226 | 8.5% |
| Local Government Employees | 267 | 10.1% |
| State Government Employees | 63 | 2.4% |
| Federal Government Employees | 34 | 1.3% |
| Unpaid Family Workers | 0 | 0.0% |
| Total | 2,653 | 100.0% |
Employment Status by Age in Woodlake
According to the labor force statistics for Woodlake, out of the total population over 16 years of age (5,431), 55.3% or 3,003 individuals are in the labor force, with 9.1% or 273 of them unemployed. The age group with the highest labor force participation rate is 25 to 29 years, with 87.1% or 555 individuals in the labor force. Within the labor force, the 55 to 59 years age range has the highest percentage of unemployed individuals, with 14.4% or 21 of them being unemployed.
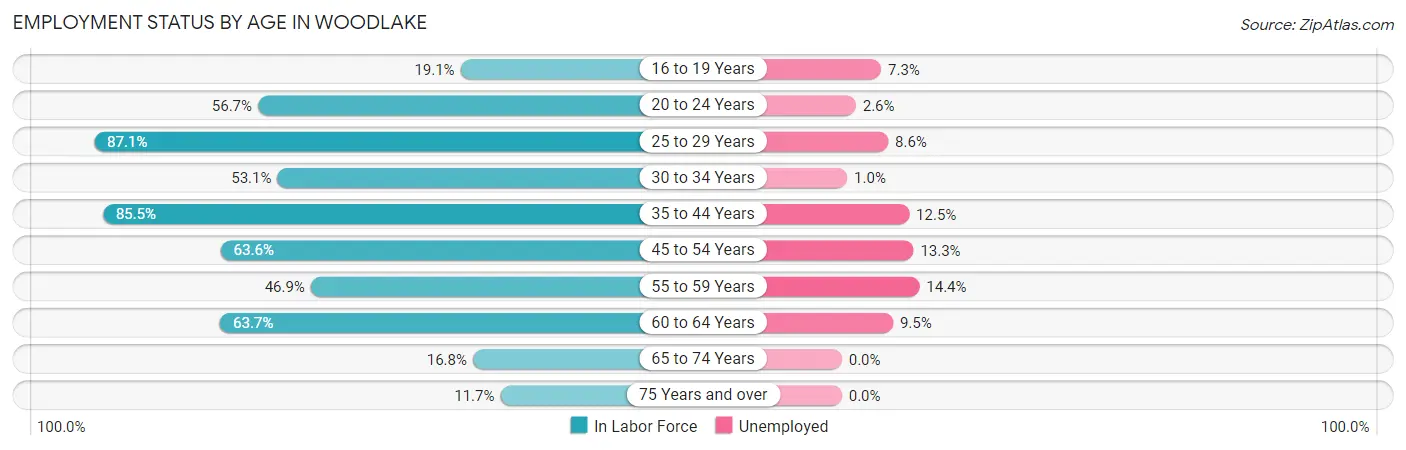
| Age Bracket | In Labor Force | Unemployed |
| 16 to 19 Years | 137 (19.1%) | 10 (7.3%) |
| 20 to 24 Years | 268 (56.7%) | 7 (2.6%) |
| 25 to 29 Years | 555 (87.1%) | 48 (8.6%) |
| 30 to 34 Years | 287 (53.1%) | 3 (1.0%) |
| 35 to 44 Years | 745 (85.5%) | 93 (12.5%) |
| 45 to 54 Years | 510 (63.6%) | 68 (13.3%) |
| 55 to 59 Years | 146 (46.9%) | 21 (14.4%) |
| 60 to 64 Years | 262 (63.7%) | 25 (9.5%) |
| 65 to 74 Years | 59 (16.8%) | 0 (0.0%) |
| 75 Years and over | 37 (11.7%) | 0 (0.0%) |
| Total | 3,003 (55.3%) | 273 (9.1%) |
Employment Status by Educational Attainment in Woodlake
According to labor force statistics for Woodlake, 70.1% of individuals (2,504) out of the total population between 25 and 64 years of age (3,572) are in the labor force, with 10.3% or 258 of them being unemployed. The group with the highest labor force participation rate are those with the educational attainment of college / associate degree, with 85.5% or 829 individuals in the labor force. Within the labor force, individuals with less than high school education have the highest percentage of unemployment, with 13.5% or 111 of them being unemployed.
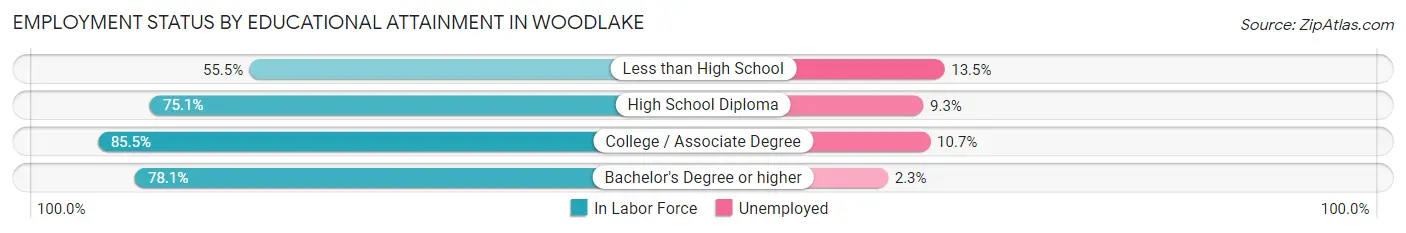
| Educational Attainment | In Labor Force | Unemployed |
| Less than High School | 821 (55.5%) | 200 (13.5%) |
| High School Diploma | 551 (75.1%) | 68 (9.3%) |
| College / Associate Degree | 829 (85.5%) | 104 (10.7%) |
| Bachelor's Degree or higher | 304 (78.1%) | 9 (2.3%) |
| Total | 2,504 (70.1%) | 368 (10.3%) |
Employment Occupations by Sex in Woodlake
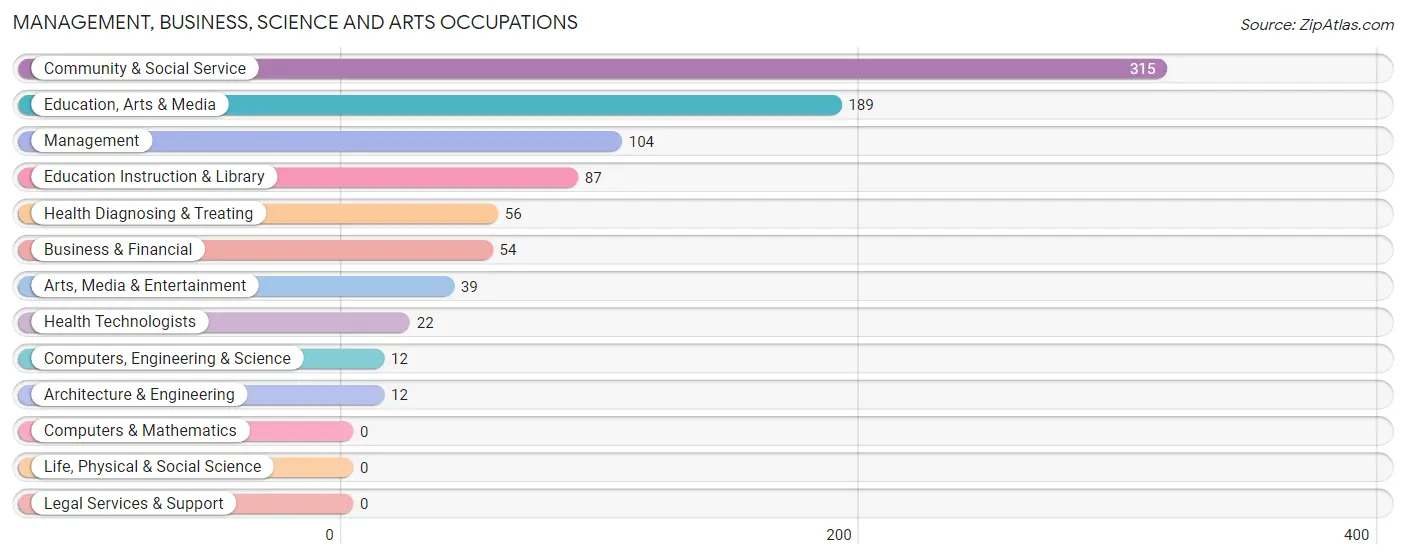
Management, Business, Science and Arts Occupations
The most common Management, Business, Science and Arts occupations in Woodlake are Community & Social Service (315 | 11.5%), Education, Arts & Media (189 | 6.9%), Management (104 | 3.8%), Education Instruction & Library (87 | 3.2%), and Health Diagnosing & Treating (56 | 2.1%).
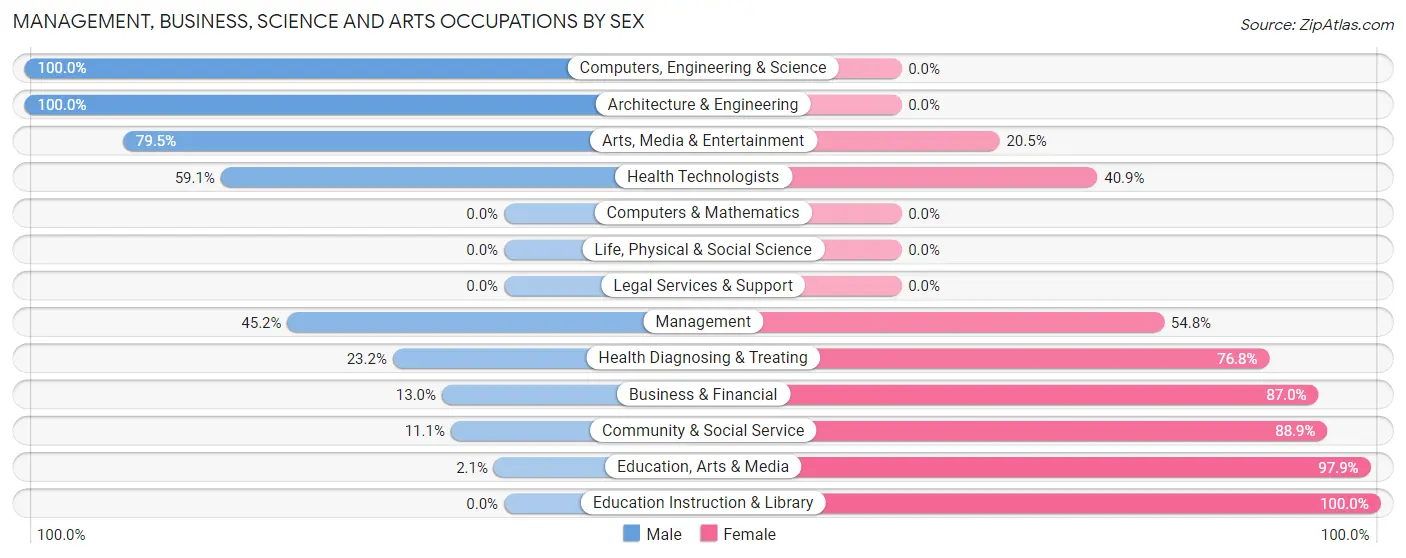
Management, Business, Science and Arts Occupations by Sex
Within the Management, Business, Science and Arts occupations in Woodlake, the most male-oriented occupations are Computers, Engineering & Science (100.0%), Architecture & Engineering (100.0%), and Arts, Media & Entertainment (79.5%), while the most female-oriented occupations are Education Instruction & Library (100.0%), Education, Arts & Media (97.9%), and Community & Social Service (88.9%).
| Occupation | Male | Female |
| Management | 47 (45.2%) | 57 (54.8%) |
| Business & Financial | 7 (13.0%) | 47 (87.0%) |
| Computers, Engineering & Science | 12 (100.0%) | 0 (0.0%) |
| Computers & Mathematics | 0 (0.0%) | 0 (0.0%) |
| Architecture & Engineering | 12 (100.0%) | 0 (0.0%) |
| Life, Physical & Social Science | 0 (0.0%) | 0 (0.0%) |
| Community & Social Service | 35 (11.1%) | 280 (88.9%) |
| Education, Arts & Media | 4 (2.1%) | 185 (97.9%) |
| Legal Services & Support | 0 (0.0%) | 0 (0.0%) |
| Education Instruction & Library | 0 (0.0%) | 87 (100.0%) |
| Arts, Media & Entertainment | 31 (79.5%) | 8 (20.5%) |
| Health Diagnosing & Treating | 13 (23.2%) | 43 (76.8%) |
| Health Technologists | 13 (59.1%) | 9 (40.9%) |
| Total (Category) | 114 (21.1%) | 427 (78.9%) |
| Total (Overall) | 1,449 (53.1%) | 1,282 (46.9%) |
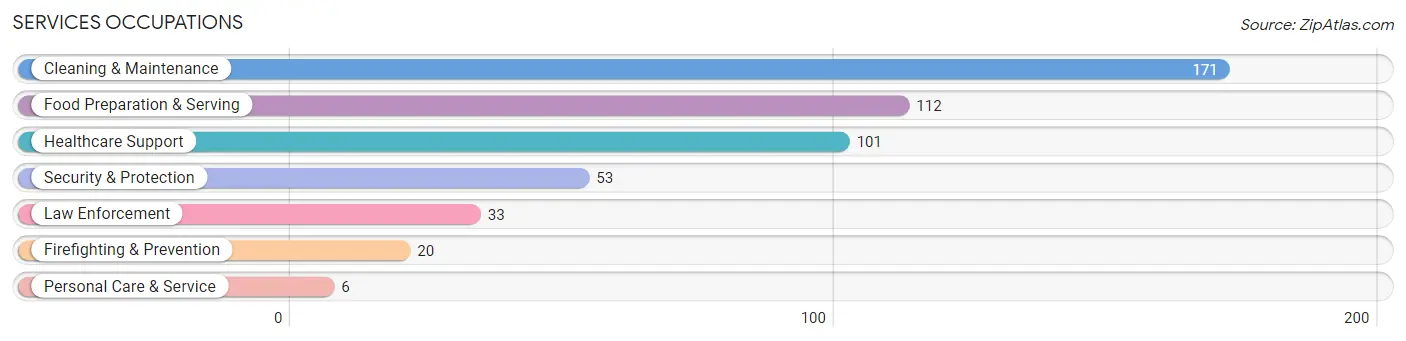
Services Occupations
The most common Services occupations in Woodlake are Cleaning & Maintenance (171 | 6.3%), Food Preparation & Serving (112 | 4.1%), Healthcare Support (101 | 3.7%), Security & Protection (53 | 1.9%), and Law Enforcement (33 | 1.2%).
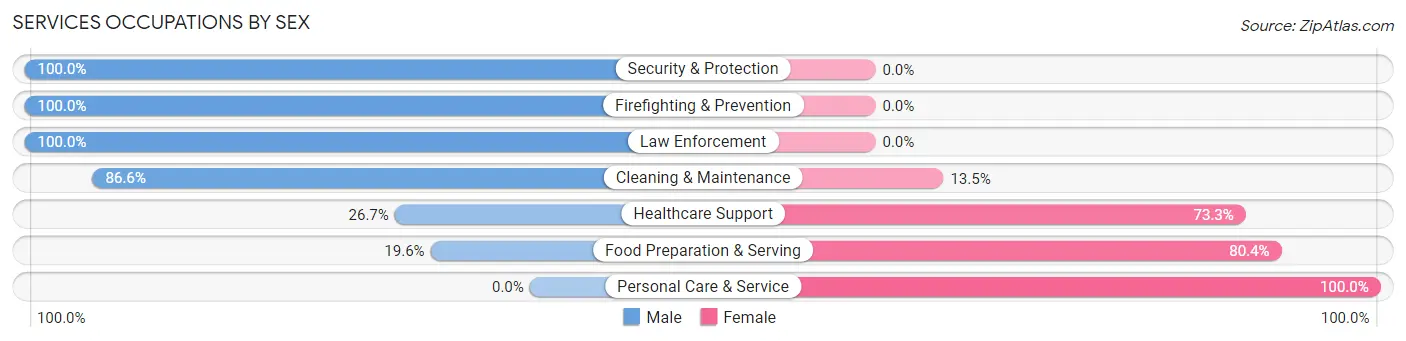
Services Occupations by Sex
Within the Services occupations in Woodlake, the most male-oriented occupations are Security & Protection (100.0%), Firefighting & Prevention (100.0%), and Law Enforcement (100.0%), while the most female-oriented occupations are Personal Care & Service (100.0%), Food Preparation & Serving (80.4%), and Healthcare Support (73.3%).
| Occupation | Male | Female |
| Healthcare Support | 27 (26.7%) | 74 (73.3%) |
| Security & Protection | 53 (100.0%) | 0 (0.0%) |
| Firefighting & Prevention | 20 (100.0%) | 0 (0.0%) |
| Law Enforcement | 33 (100.0%) | 0 (0.0%) |
| Food Preparation & Serving | 22 (19.6%) | 90 (80.4%) |
| Cleaning & Maintenance | 148 (86.6%) | 23 (13.5%) |
| Personal Care & Service | 0 (0.0%) | 6 (100.0%) |
| Total (Category) | 250 (56.4%) | 193 (43.6%) |
| Total (Overall) | 1,449 (53.1%) | 1,282 (46.9%) |
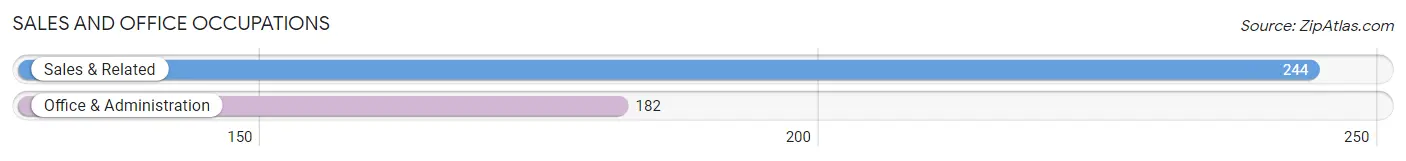
Sales and Office Occupations
The most common Sales and Office occupations in Woodlake are Sales & Related (244 | 8.9%), and Office & Administration (182 | 6.7%).
Sales and Office Occupations by Sex
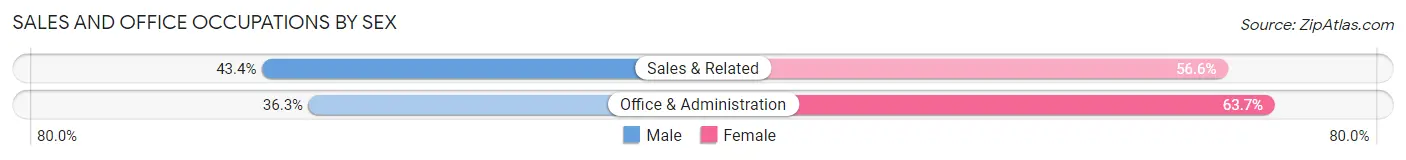
| Occupation | Male | Female |
| Sales & Related | 106 (43.4%) | 138 (56.6%) |
| Office & Administration | 66 (36.3%) | 116 (63.7%) |
| Total (Category) | 172 (40.4%) | 254 (59.6%) |
| Total (Overall) | 1,449 (53.1%) | 1,282 (46.9%) |
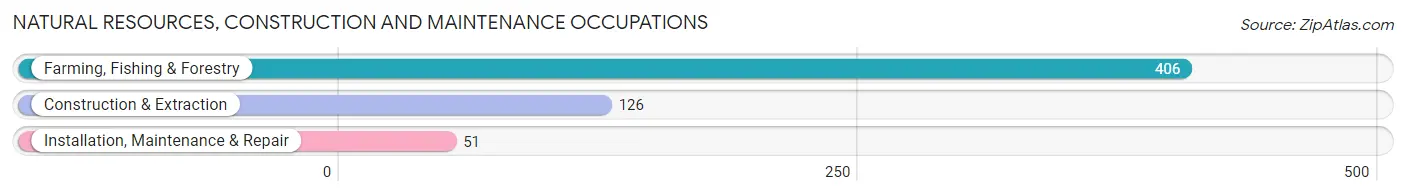
Natural Resources, Construction and Maintenance Occupations
The most common Natural Resources, Construction and Maintenance occupations in Woodlake are Farming, Fishing & Forestry (406 | 14.9%), Construction & Extraction (126 | 4.6%), and Installation, Maintenance & Repair (51 | 1.9%).
Natural Resources, Construction and Maintenance Occupations by Sex
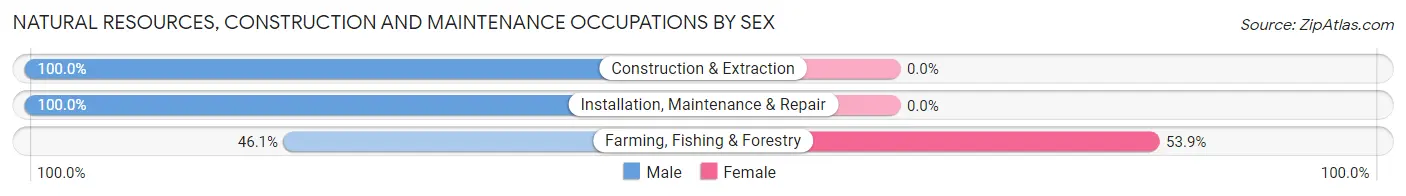
| Occupation | Male | Female |
| Farming, Fishing & Forestry | 187 (46.1%) | 219 (53.9%) |
| Construction & Extraction | 126 (100.0%) | 0 (0.0%) |
| Installation, Maintenance & Repair | 51 (100.0%) | 0 (0.0%) |
| Total (Category) | 364 (62.4%) | 219 (37.6%) |
| Total (Overall) | 1,449 (53.1%) | 1,282 (46.9%) |
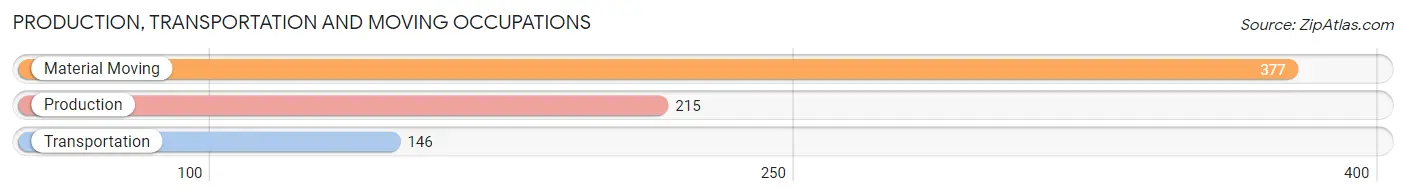
Production, Transportation and Moving Occupations
The most common Production, Transportation and Moving occupations in Woodlake are Material Moving (377 | 13.8%), Production (215 | 7.9%), and Transportation (146 | 5.3%).
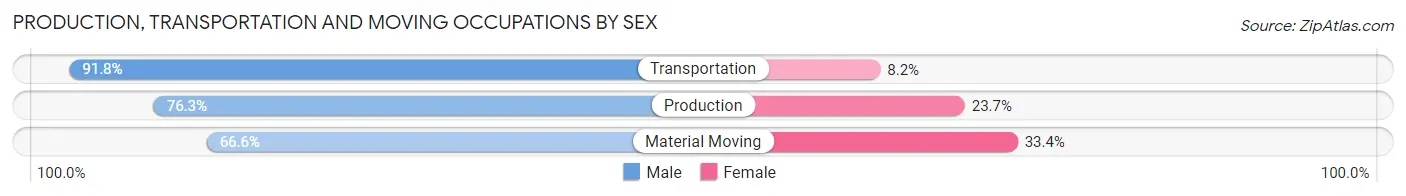
Production, Transportation and Moving Occupations by Sex
| Occupation | Male | Female |
| Production | 164 (76.3%) | 51 (23.7%) |
| Transportation | 134 (91.8%) | 12 (8.2%) |
| Material Moving | 251 (66.6%) | 126 (33.4%) |
| Total (Category) | 549 (74.4%) | 189 (25.6%) |
| Total (Overall) | 1,449 (53.1%) | 1,282 (46.9%) |
Employment Industries by Sex in Woodlake
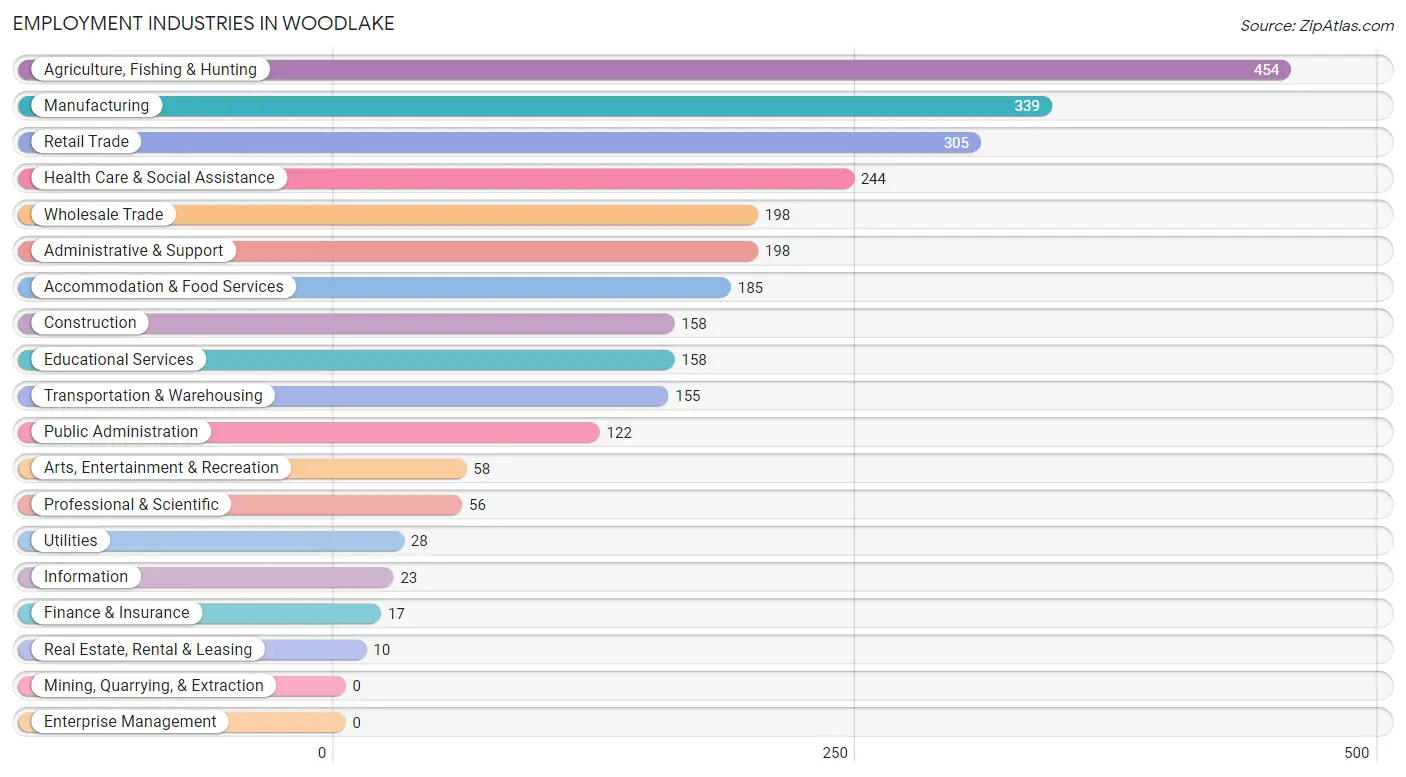
Employment Industries in Woodlake
The major employment industries in Woodlake include Agriculture, Fishing & Hunting (454 | 16.6%), Manufacturing (339 | 12.4%), Retail Trade (305 | 11.2%), Health Care & Social Assistance (244 | 8.9%), and Wholesale Trade (198 | 7.2%).
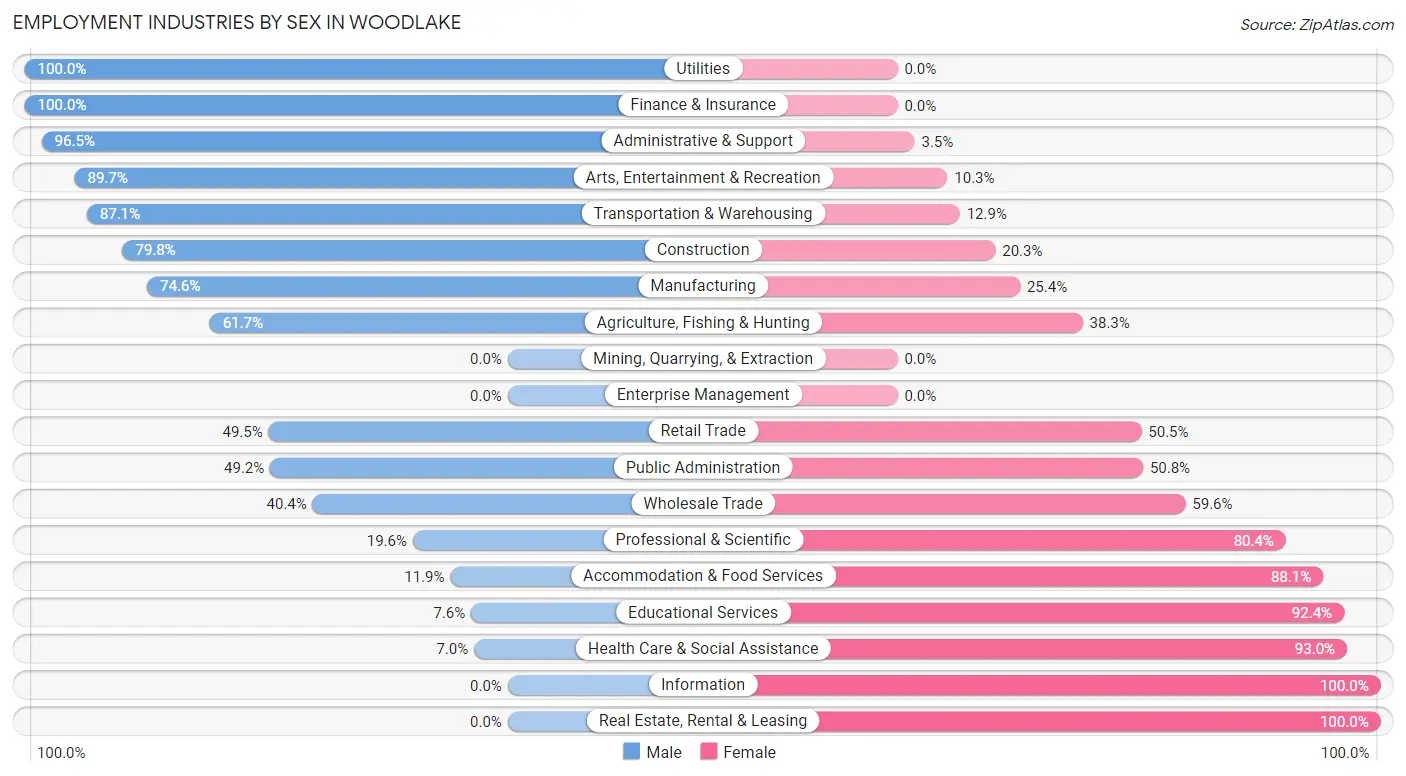
Employment Industries by Sex in Woodlake
The Woodlake industries that see more men than women are Utilities (100.0%), Finance & Insurance (100.0%), and Administrative & Support (96.5%), whereas the industries that tend to have a higher number of women are Information (100.0%), Real Estate, Rental & Leasing (100.0%), and Health Care & Social Assistance (93.0%).
| Industry | Male | Female |
| Agriculture, Fishing & Hunting | 280 (61.7%) | 174 (38.3%) |
| Mining, Quarrying, & Extraction | 0 (0.0%) | 0 (0.0%) |
| Construction | 126 (79.7%) | 32 (20.3%) |
| Manufacturing | 253 (74.6%) | 86 (25.4%) |
| Wholesale Trade | 80 (40.4%) | 118 (59.6%) |
| Retail Trade | 151 (49.5%) | 154 (50.5%) |
| Transportation & Warehousing | 135 (87.1%) | 20 (12.9%) |
| Utilities | 28 (100.0%) | 0 (0.0%) |
| Information | 0 (0.0%) | 23 (100.0%) |
| Finance & Insurance | 17 (100.0%) | 0 (0.0%) |
| Real Estate, Rental & Leasing | 0 (0.0%) | 10 (100.0%) |
| Professional & Scientific | 11 (19.6%) | 45 (80.4%) |
| Enterprise Management | 0 (0.0%) | 0 (0.0%) |
| Administrative & Support | 191 (96.5%) | 7 (3.5%) |
| Educational Services | 12 (7.6%) | 146 (92.4%) |
| Health Care & Social Assistance | 17 (7.0%) | 227 (93.0%) |
| Arts, Entertainment & Recreation | 52 (89.7%) | 6 (10.3%) |
| Accommodation & Food Services | 22 (11.9%) | 163 (88.1%) |
| Public Administration | 60 (49.2%) | 62 (50.8%) |
| Total | 1,449 (53.1%) | 1,282 (46.9%) |
Education in Woodlake
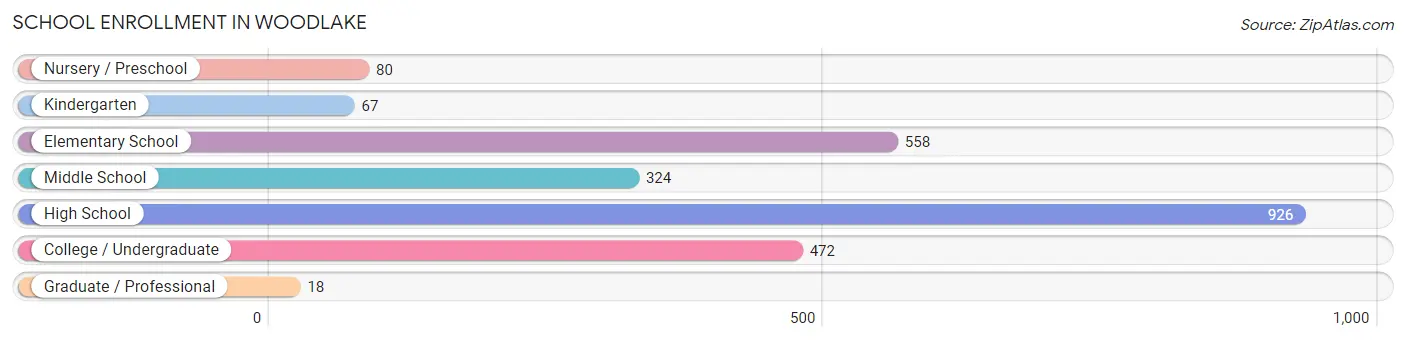
School Enrollment in Woodlake
The most common levels of schooling among the 2,445 students in Woodlake are high school (926 | 37.9%), elementary school (558 | 22.8%), and college / undergraduate (472 | 19.3%).
| School Level | # Students | % Students |
| Nursery / Preschool | 80 | 3.3% |
| Kindergarten | 67 | 2.7% |
| Elementary School | 558 | 22.8% |
| Middle School | 324 | 13.3% |
| High School | 926 | 37.9% |
| College / Undergraduate | 472 | 19.3% |
| Graduate / Professional | 18 | 0.7% |
| Total | 2,445 | 100.0% |
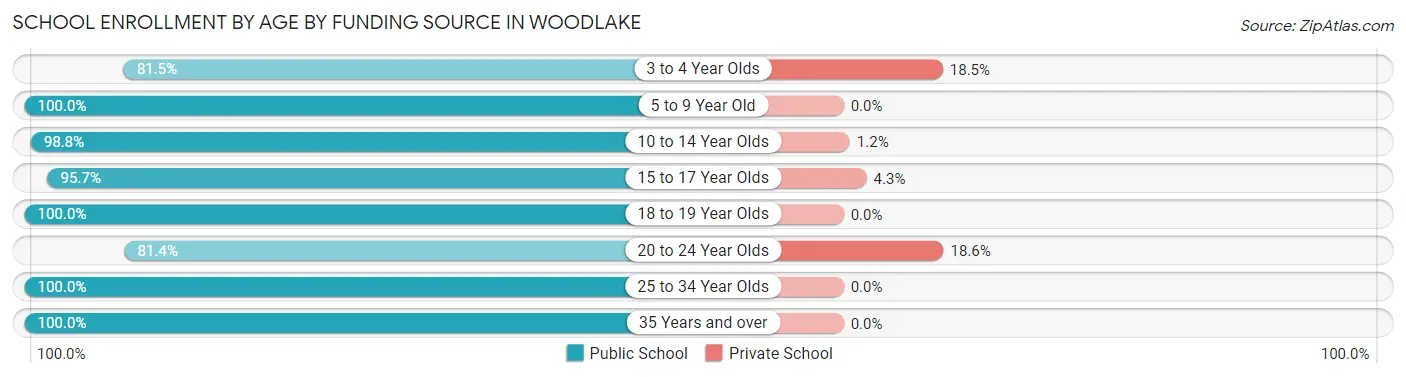
School Enrollment by Age by Funding Source in Woodlake
Out of a total of 2,445 students who are enrolled in schools in Woodlake, 93 (3.8%) attend a private institution, while the remaining 2,352 (96.2%) are enrolled in public schools. The age group of 20 to 24 year olds has the highest likelihood of being enrolled in private schools, with 43 (18.6% in the age bracket) enrolled. Conversely, the age group of 5 to 9 year old has the lowest likelihood of being enrolled in a private school, with 527 (100.0% in the age bracket) attending a public institution.
| Age Bracket | Public School | Private School |
| 3 to 4 Year Olds | 75 (81.5%) | 17 (18.5%) |
| 5 to 9 Year Old | 527 (100.0%) | 0 (0.0%) |
| 10 to 14 Year Olds | 510 (98.8%) | 6 (1.2%) |
| 15 to 17 Year Olds | 604 (95.7%) | 27 (4.3%) |
| 18 to 19 Year Olds | 314 (100.0%) | 0 (0.0%) |
| 20 to 24 Year Olds | 188 (81.4%) | 43 (18.6%) |
| 25 to 34 Year Olds | 61 (100.0%) | 0 (0.0%) |
| 35 Years and over | 73 (100.0%) | 0 (0.0%) |
| Total | 2,352 (96.2%) | 93 (3.8%) |
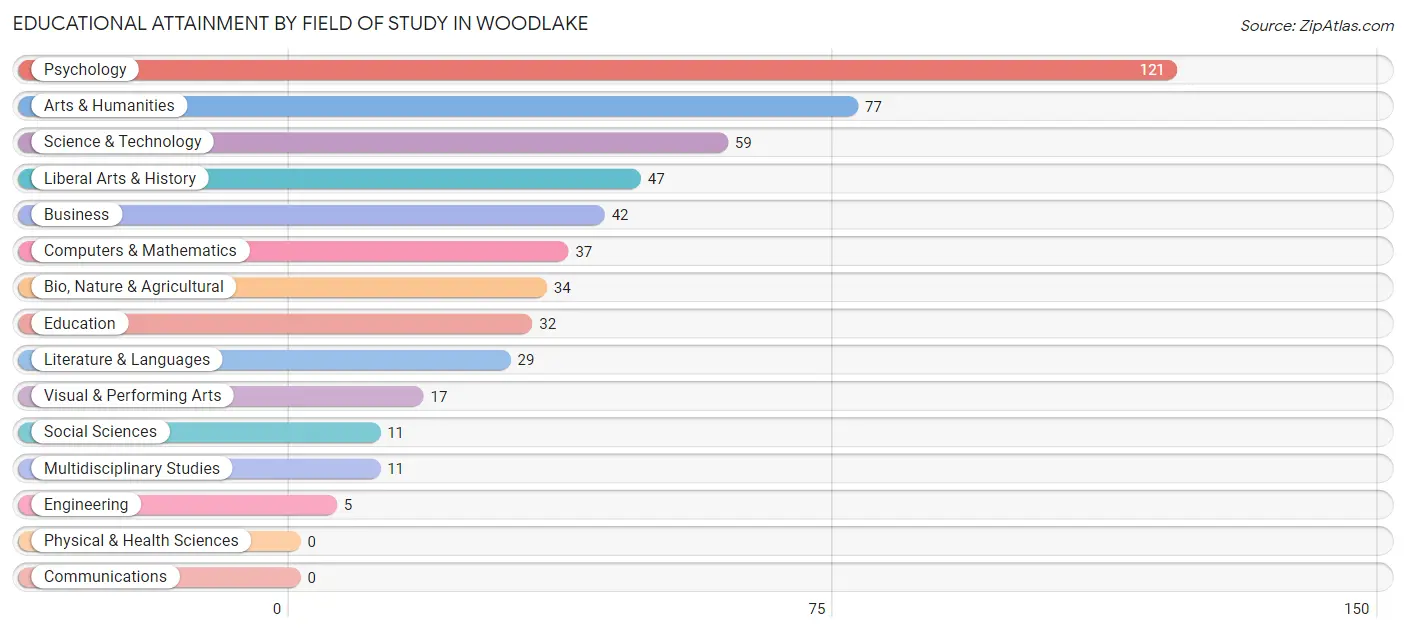
Educational Attainment by Field of Study in Woodlake
Psychology (121 | 23.2%), arts & humanities (77 | 14.7%), science & technology (59 | 11.3%), liberal arts & history (47 | 9.0%), and business (42 | 8.1%) are the most common fields of study among 522 individuals in Woodlake who have obtained a bachelor's degree or higher.
| Field of Study | # Graduates | % Graduates |
| Computers & Mathematics | 37 | 7.1% |
| Bio, Nature & Agricultural | 34 | 6.5% |
| Physical & Health Sciences | 0 | 0.0% |
| Psychology | 121 | 23.2% |
| Social Sciences | 11 | 2.1% |
| Engineering | 5 | 1.0% |
| Multidisciplinary Studies | 11 | 2.1% |
| Science & Technology | 59 | 11.3% |
| Business | 42 | 8.1% |
| Education | 32 | 6.1% |
| Literature & Languages | 29 | 5.6% |
| Liberal Arts & History | 47 | 9.0% |
| Visual & Performing Arts | 17 | 3.3% |
| Communications | 0 | 0.0% |
| Arts & Humanities | 77 | 14.7% |
| Total | 522 | 100.0% |
Transportation & Commute in Woodlake
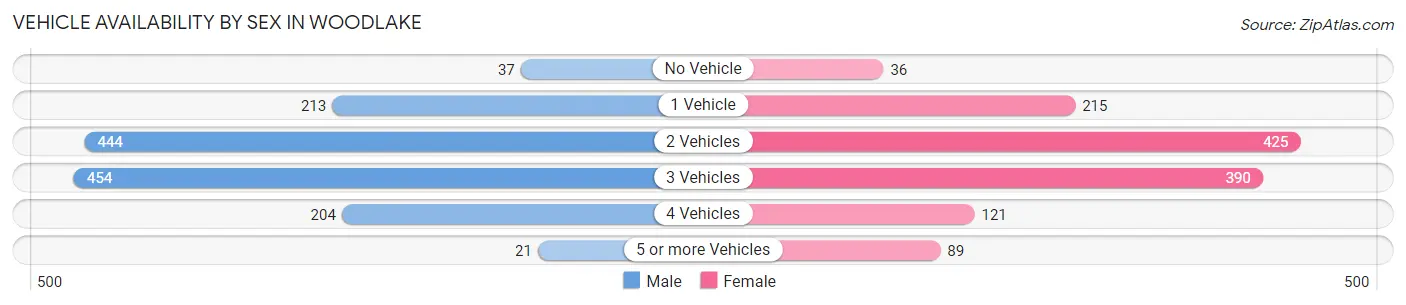
Vehicle Availability by Sex in Woodlake
The most prevalent vehicle ownership categories in Woodlake are males with 3 vehicles (454, accounting for 33.1%) and females with 3 vehicles (390, making up 35.6%).
| Vehicles Available | Male | Female |
| No Vehicle | 37 (2.7%) | 36 (2.8%) |
| 1 Vehicle | 213 (15.5%) | 215 (16.9%) |
| 2 Vehicles | 444 (32.3%) | 425 (33.3%) |
| 3 Vehicles | 454 (33.1%) | 390 (30.6%) |
| 4 Vehicles | 204 (14.9%) | 121 (9.5%) |
| 5 or more Vehicles | 21 (1.5%) | 89 (7.0%) |
| Total | 1,373 (100.0%) | 1,276 (100.0%) |
Commute Time in Woodlake
The most frequently occuring commute durations in Woodlake are 30 to 34 minutes (563 commuters, 23.2%), 15 to 19 minutes (320 commuters, 13.2%), and 45 to 59 minutes (288 commuters, 11.9%).
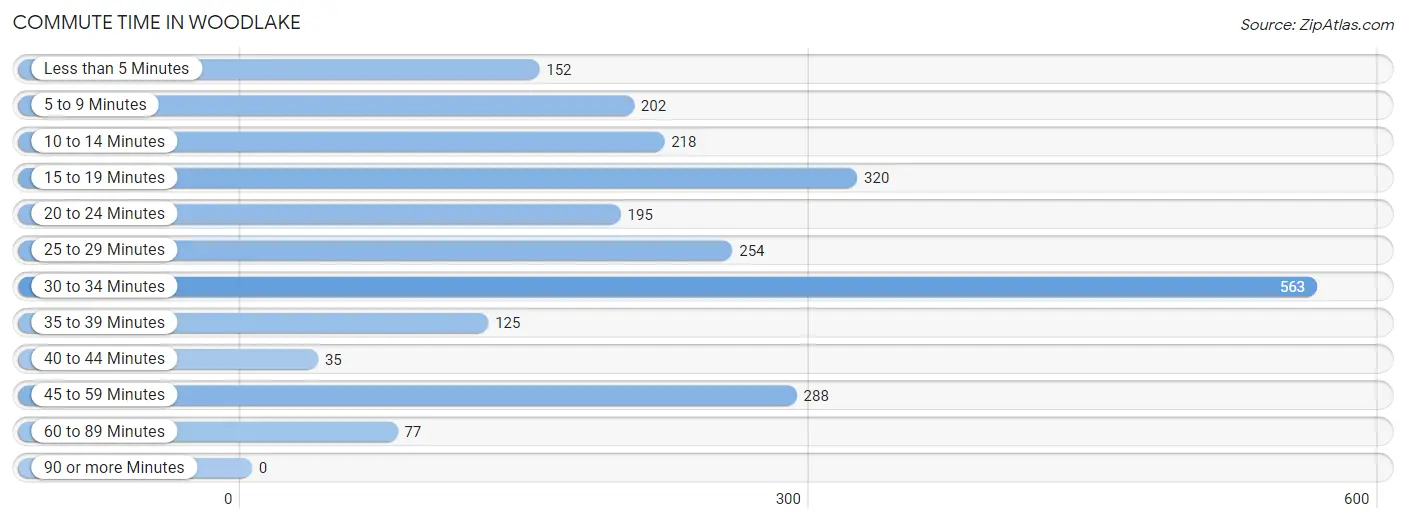
| Commute Time | # Commuters | % Commuters |
| Less than 5 Minutes | 152 | 6.3% |
| 5 to 9 Minutes | 202 | 8.3% |
| 10 to 14 Minutes | 218 | 9.0% |
| 15 to 19 Minutes | 320 | 13.2% |
| 20 to 24 Minutes | 195 | 8.0% |
| 25 to 29 Minutes | 254 | 10.5% |
| 30 to 34 Minutes | 563 | 23.2% |
| 35 to 39 Minutes | 125 | 5.1% |
| 40 to 44 Minutes | 35 | 1.4% |
| 45 to 59 Minutes | 288 | 11.9% |
| 60 to 89 Minutes | 77 | 3.2% |
| 90 or more Minutes | 0 | 0.0% |
Commute Time by Sex in Woodlake
The most common commute times in Woodlake are 30 to 34 minutes (301 commuters, 22.8%) for males and 30 to 34 minutes (262 commuters, 23.6%) for females.
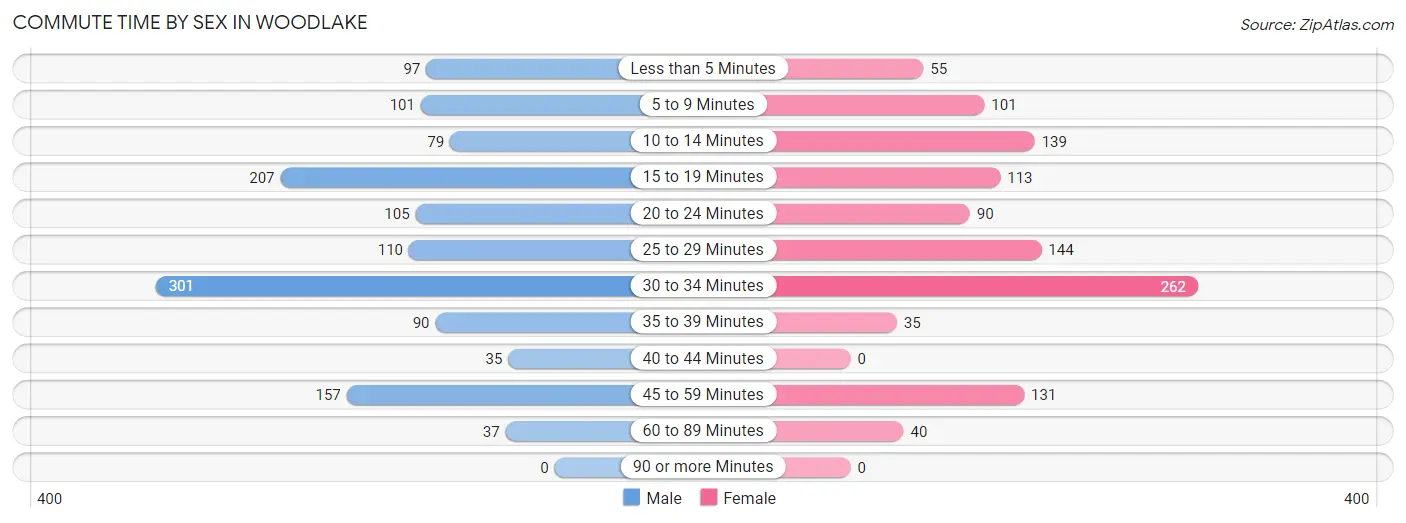
| Commute Time | Male | Female |
| Less than 5 Minutes | 97 (7.3%) | 55 (5.0%) |
| 5 to 9 Minutes | 101 (7.7%) | 101 (9.1%) |
| 10 to 14 Minutes | 79 (6.0%) | 139 (12.5%) |
| 15 to 19 Minutes | 207 (15.7%) | 113 (10.2%) |
| 20 to 24 Minutes | 105 (8.0%) | 90 (8.1%) |
| 25 to 29 Minutes | 110 (8.3%) | 144 (13.0%) |
| 30 to 34 Minutes | 301 (22.8%) | 262 (23.6%) |
| 35 to 39 Minutes | 90 (6.8%) | 35 (3.2%) |
| 40 to 44 Minutes | 35 (2.6%) | 0 (0.0%) |
| 45 to 59 Minutes | 157 (11.9%) | 131 (11.8%) |
| 60 to 89 Minutes | 37 (2.8%) | 40 (3.6%) |
| 90 or more Minutes | 0 (0.0%) | 0 (0.0%) |
Time of Departure to Work by Sex in Woodlake
The most frequent times of departure to work in Woodlake are 6:00 AM to 6:29 AM (325, 24.6%) for males and 7:30 AM to 7:59 AM (316, 28.5%) for females.
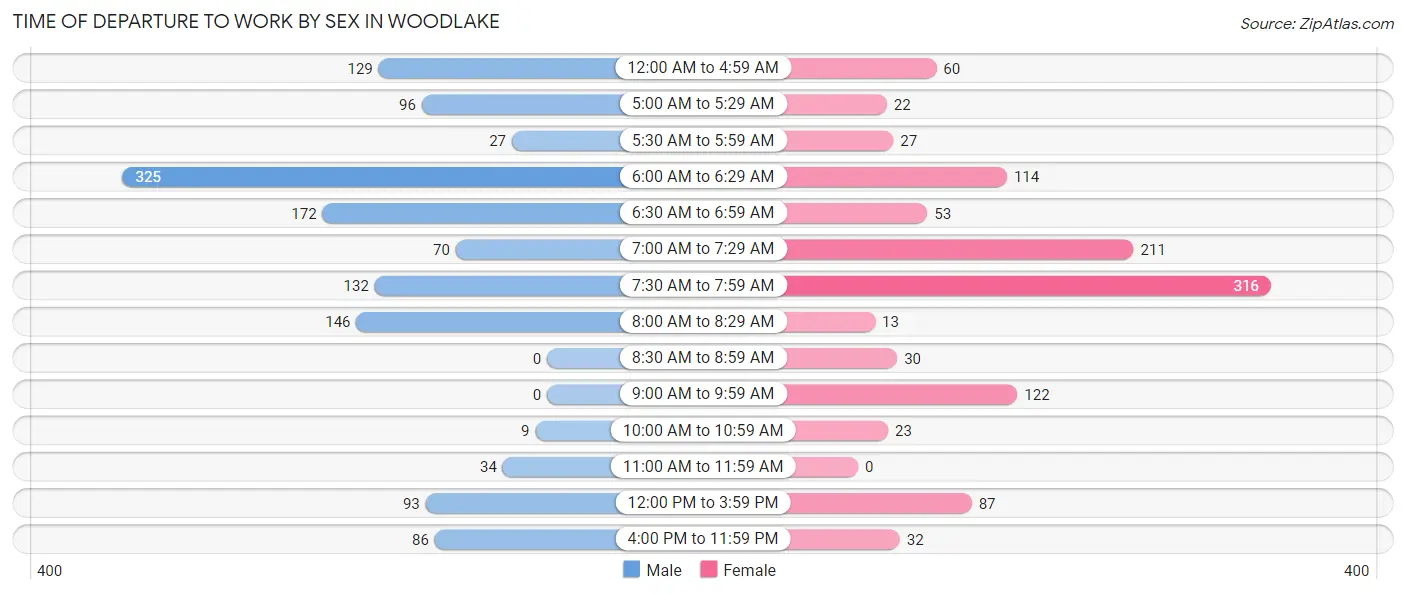
| Time of Departure | Male | Female |
| 12:00 AM to 4:59 AM | 129 (9.8%) | 60 (5.4%) |
| 5:00 AM to 5:29 AM | 96 (7.3%) | 22 (2.0%) |
| 5:30 AM to 5:59 AM | 27 (2.1%) | 27 (2.4%) |
| 6:00 AM to 6:29 AM | 325 (24.6%) | 114 (10.3%) |
| 6:30 AM to 6:59 AM | 172 (13.0%) | 53 (4.8%) |
| 7:00 AM to 7:29 AM | 70 (5.3%) | 211 (19.0%) |
| 7:30 AM to 7:59 AM | 132 (10.0%) | 316 (28.5%) |
| 8:00 AM to 8:29 AM | 146 (11.1%) | 13 (1.2%) |
| 8:30 AM to 8:59 AM | 0 (0.0%) | 30 (2.7%) |
| 9:00 AM to 9:59 AM | 0 (0.0%) | 122 (11.0%) |
| 10:00 AM to 10:59 AM | 9 (0.7%) | 23 (2.1%) |
| 11:00 AM to 11:59 AM | 34 (2.6%) | 0 (0.0%) |
| 12:00 PM to 3:59 PM | 93 (7.0%) | 87 (7.8%) |
| 4:00 PM to 11:59 PM | 86 (6.5%) | 32 (2.9%) |
| Total | 1,319 (100.0%) | 1,110 (100.0%) |
Housing Occupancy in Woodlake
Occupancy by Ownership in Woodlake
Of the total 2,121 dwellings in Woodlake, owner-occupied units account for 1,067 (50.3%), while renter-occupied units make up 1,054 (49.7%).
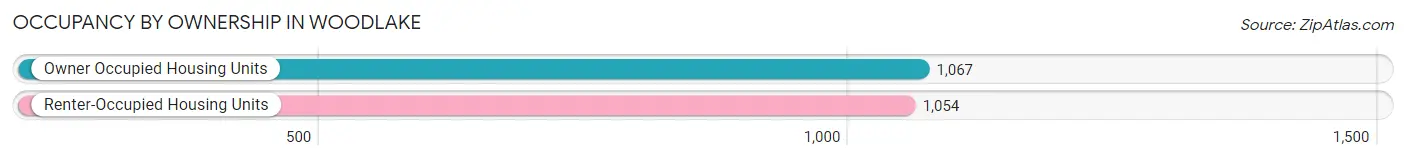
| Occupancy | # Housing Units | % Housing Units |
| Owner Occupied Housing Units | 1,067 | 50.3% |
| Renter-Occupied Housing Units | 1,054 | 49.7% |
| Total Occupied Housing Units | 2,121 | 100.0% |
Occupancy by Household Size in Woodlake
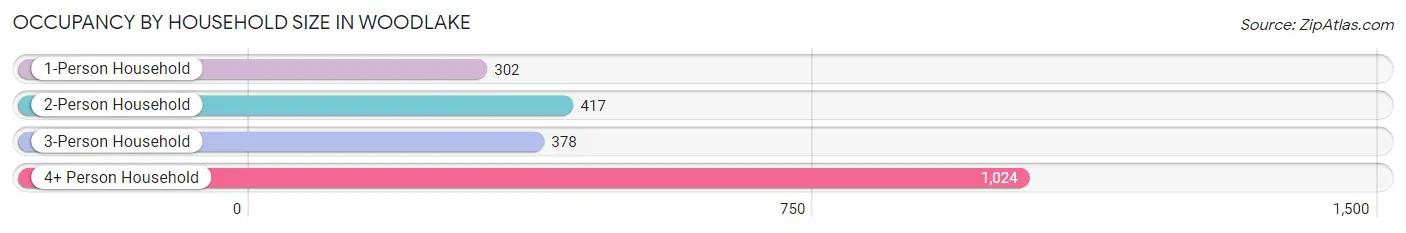
| Household Size | # Housing Units | % Housing Units |
| 1-Person Household | 302 | 14.2% |
| 2-Person Household | 417 | 19.7% |
| 3-Person Household | 378 | 17.8% |
| 4+ Person Household | 1,024 | 48.3% |
| Total Housing Units | 2,121 | 100.0% |
Occupancy by Ownership by Household Size in Woodlake
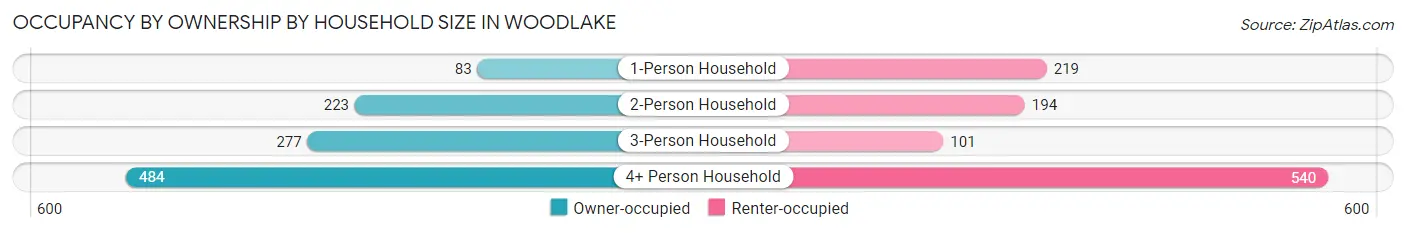
| Household Size | Owner-occupied | Renter-occupied |
| 1-Person Household | 83 (27.5%) | 219 (72.5%) |
| 2-Person Household | 223 (53.5%) | 194 (46.5%) |
| 3-Person Household | 277 (73.3%) | 101 (26.7%) |
| 4+ Person Household | 484 (47.3%) | 540 (52.7%) |
| Total Housing Units | 1,067 (50.3%) | 1,054 (49.7%) |
Occupancy by Educational Attainment in Woodlake
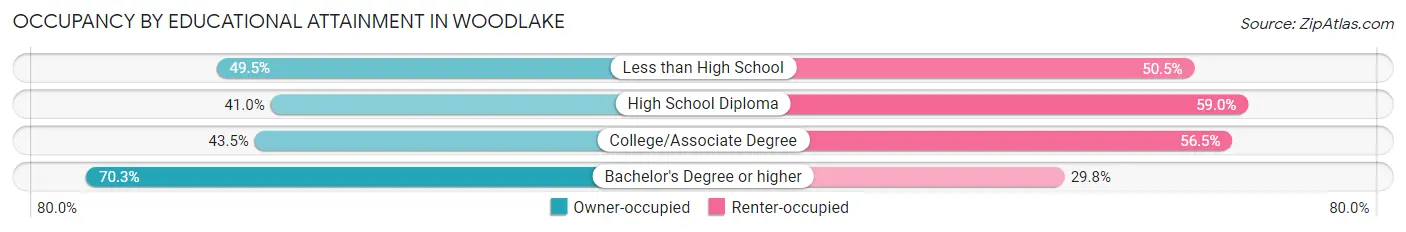
| Household Size | Owner-occupied | Renter-occupied |
| Less than High School | 479 (49.5%) | 488 (50.5%) |
| High School Diploma | 139 (41.0%) | 200 (59.0%) |
| College/Associate Degree | 201 (43.5%) | 261 (56.5%) |
| Bachelor's Degree or higher | 248 (70.3%) | 105 (29.7%) |
Occupancy by Age of Householder in Woodlake
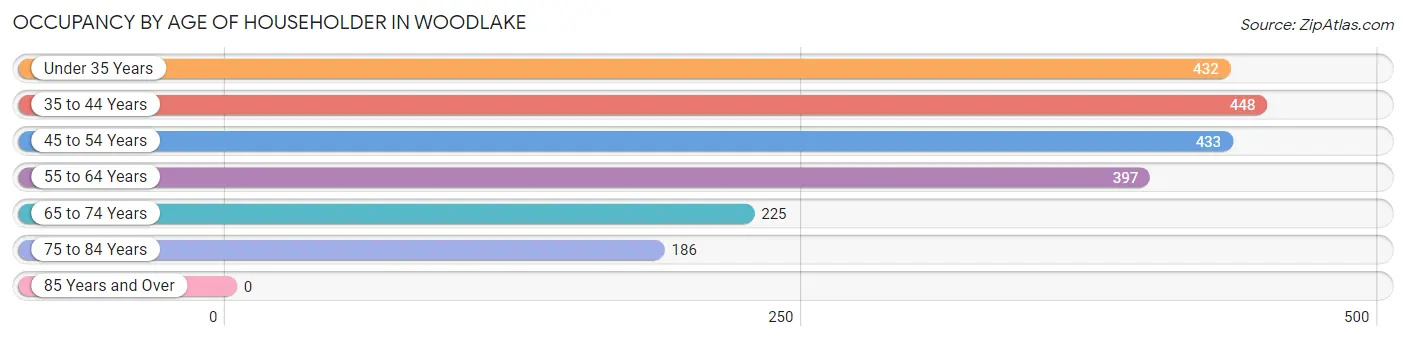
| Age Bracket | # Households | % Households |
| Under 35 Years | 432 | 20.4% |
| 35 to 44 Years | 448 | 21.1% |
| 45 to 54 Years | 433 | 20.4% |
| 55 to 64 Years | 397 | 18.7% |
| 65 to 74 Years | 225 | 10.6% |
| 75 to 84 Years | 186 | 8.8% |
| 85 Years and Over | 0 | 0.0% |
| Total | 2,121 | 100.0% |
Housing Finances in Woodlake
Median Income by Occupancy in Woodlake
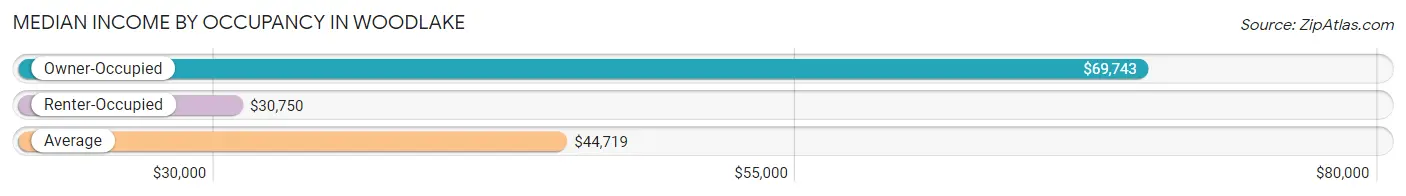
| Occupancy Type | # Households | Median Income |
| Owner-Occupied | 1,067 (50.3%) | $69,743 |
| Renter-Occupied | 1,054 (49.7%) | $30,750 |
| Average | 2,121 (100.0%) | $44,719 |
Occupancy by Householder Income Bracket in Woodlake
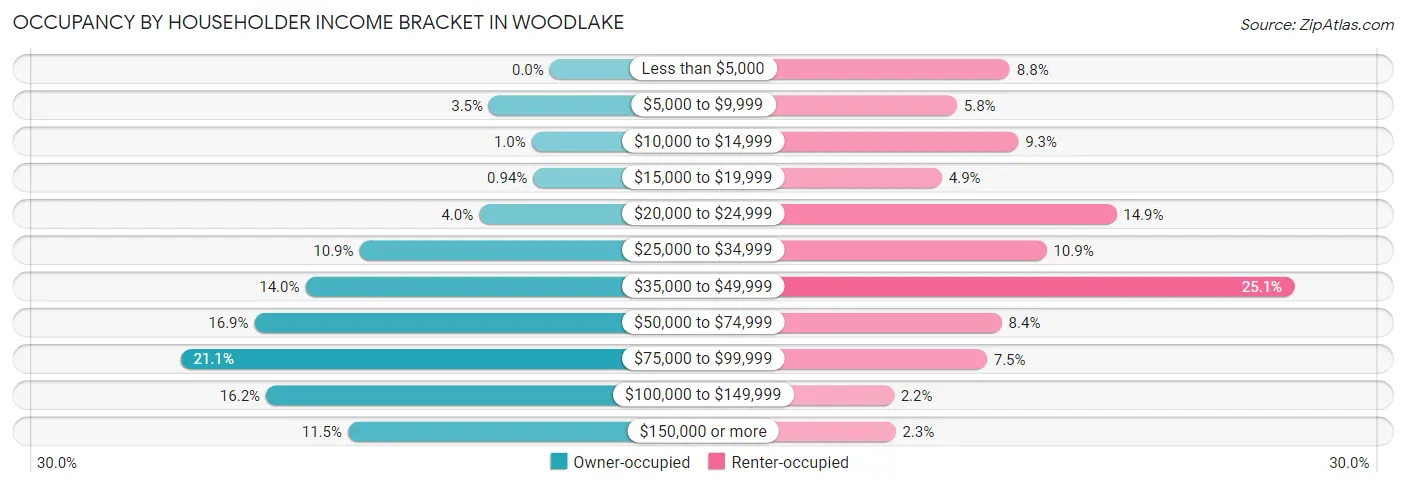
| Income Bracket | Owner-occupied | Renter-occupied |
| Less than $5,000 | 0 (0.0%) | 93 (8.8%) |
| $5,000 to $9,999 | 37 (3.5%) | 61 (5.8%) |
| $10,000 to $14,999 | 11 (1.0%) | 98 (9.3%) |
| $15,000 to $19,999 | 10 (0.9%) | 52 (4.9%) |
| $20,000 to $24,999 | 43 (4.0%) | 157 (14.9%) |
| $25,000 to $34,999 | 116 (10.9%) | 115 (10.9%) |
| $35,000 to $49,999 | 149 (14.0%) | 264 (25.1%) |
| $50,000 to $74,999 | 180 (16.9%) | 88 (8.4%) |
| $75,000 to $99,999 | 225 (21.1%) | 79 (7.5%) |
| $100,000 to $149,999 | 173 (16.2%) | 23 (2.2%) |
| $150,000 or more | 123 (11.5%) | 24 (2.3%) |
| Total | 1,067 (100.0%) | 1,054 (100.0%) |
Monthly Housing Cost Tiers in Woodlake
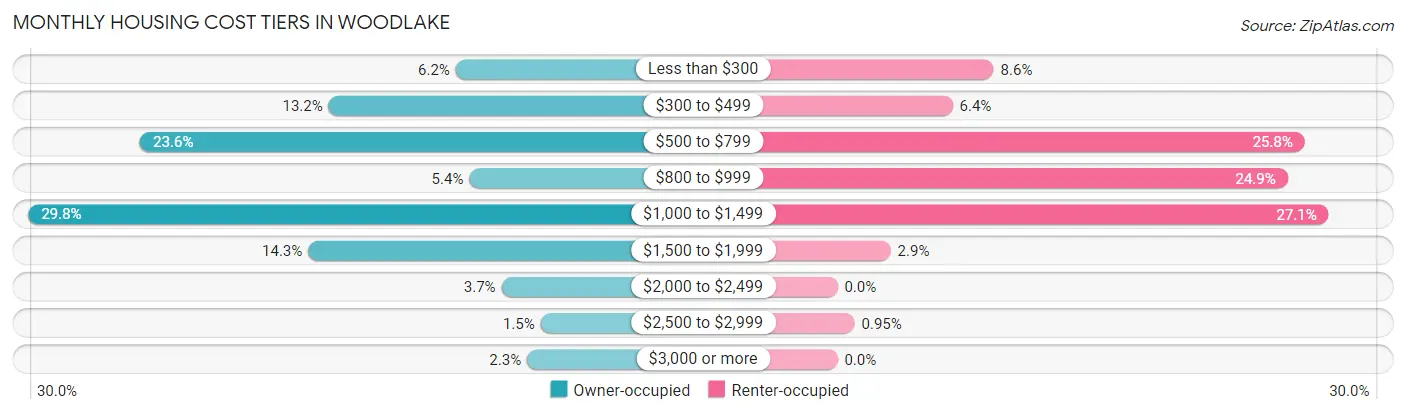
| Monthly Cost | Owner-occupied | Renter-occupied |
| Less than $300 | 66 (6.2%) | 91 (8.6%) |
| $300 to $499 | 141 (13.2%) | 67 (6.4%) |
| $500 to $799 | 252 (23.6%) | 272 (25.8%) |
| $800 to $999 | 58 (5.4%) | 262 (24.9%) |
| $1,000 to $1,499 | 318 (29.8%) | 286 (27.1%) |
| $1,500 to $1,999 | 153 (14.3%) | 31 (2.9%) |
| $2,000 to $2,499 | 39 (3.7%) | 0 (0.0%) |
| $2,500 to $2,999 | 16 (1.5%) | 10 (0.9%) |
| $3,000 or more | 24 (2.2%) | 0 (0.0%) |
| Total | 1,067 (100.0%) | 1,054 (100.0%) |
Physical Housing Characteristics in Woodlake
Housing Structures in Woodlake
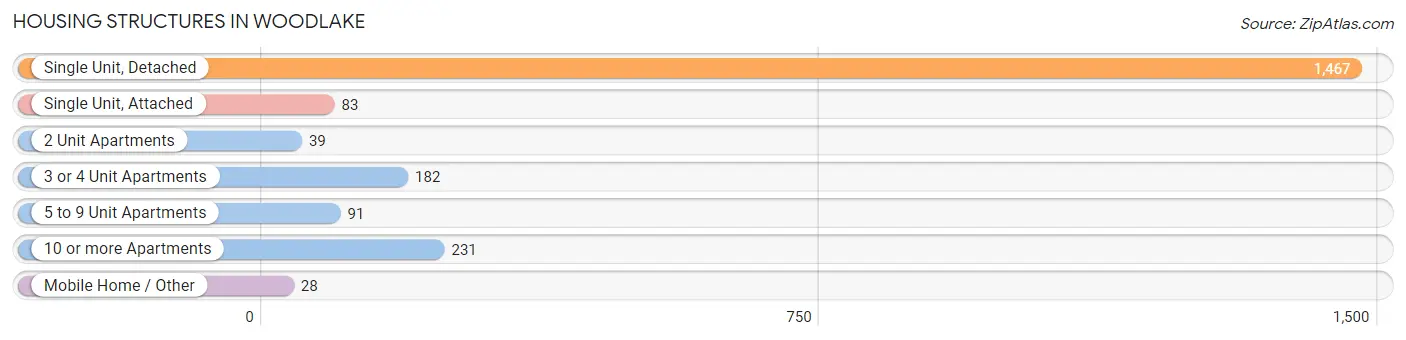
| Structure Type | # Housing Units | % Housing Units |
| Single Unit, Detached | 1,467 | 69.2% |
| Single Unit, Attached | 83 | 3.9% |
| 2 Unit Apartments | 39 | 1.8% |
| 3 or 4 Unit Apartments | 182 | 8.6% |
| 5 to 9 Unit Apartments | 91 | 4.3% |
| 10 or more Apartments | 231 | 10.9% |
| Mobile Home / Other | 28 | 1.3% |
| Total | 2,121 | 100.0% |
Housing Structures by Occupancy in Woodlake
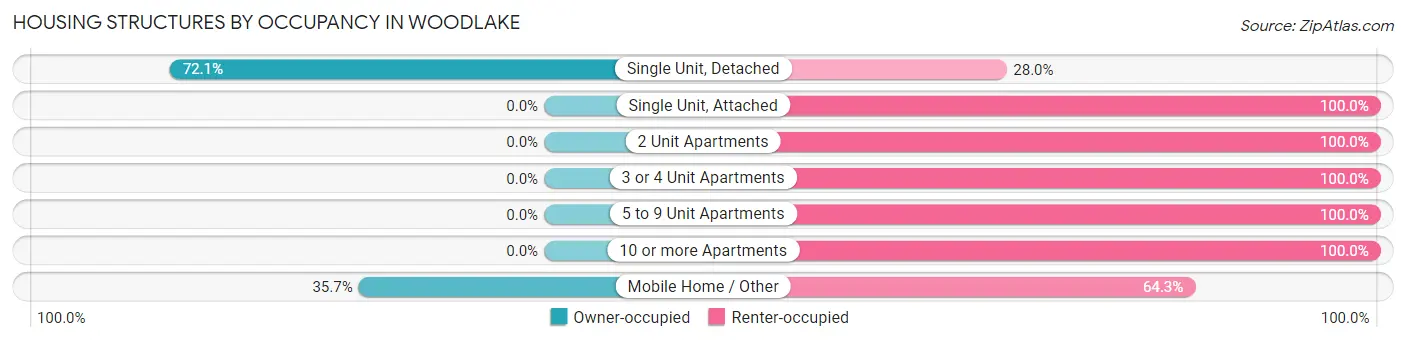
| Structure Type | Owner-occupied | Renter-occupied |
| Single Unit, Detached | 1,057 (72.1%) | 410 (28.0%) |
| Single Unit, Attached | 0 (0.0%) | 83 (100.0%) |
| 2 Unit Apartments | 0 (0.0%) | 39 (100.0%) |
| 3 or 4 Unit Apartments | 0 (0.0%) | 182 (100.0%) |
| 5 to 9 Unit Apartments | 0 (0.0%) | 91 (100.0%) |
| 10 or more Apartments | 0 (0.0%) | 231 (100.0%) |
| Mobile Home / Other | 10 (35.7%) | 18 (64.3%) |
| Total | 1,067 (50.3%) | 1,054 (49.7%) |
Housing Structures by Number of Rooms in Woodlake
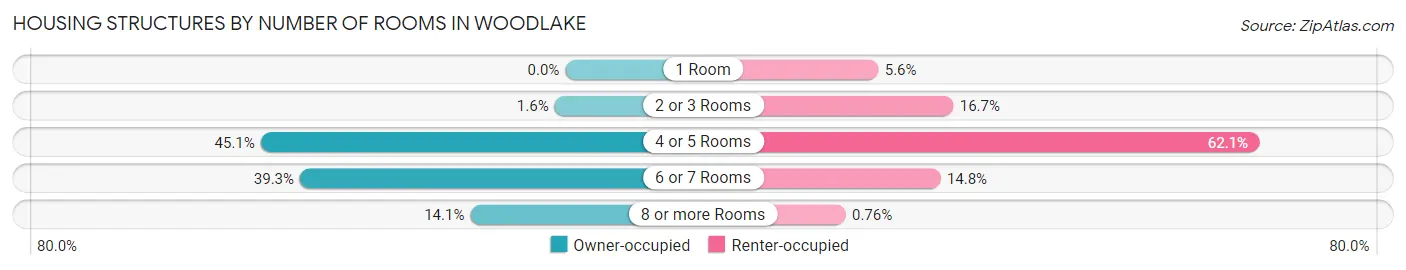
| Number of Rooms | Owner-occupied | Renter-occupied |
| 1 Room | 0 (0.0%) | 59 (5.6%) |
| 2 or 3 Rooms | 17 (1.6%) | 176 (16.7%) |
| 4 or 5 Rooms | 481 (45.1%) | 655 (62.1%) |
| 6 or 7 Rooms | 419 (39.3%) | 156 (14.8%) |
| 8 or more Rooms | 150 (14.1%) | 8 (0.8%) |
| Total | 1,067 (100.0%) | 1,054 (100.0%) |
Housing Structure by Heating Type in Woodlake
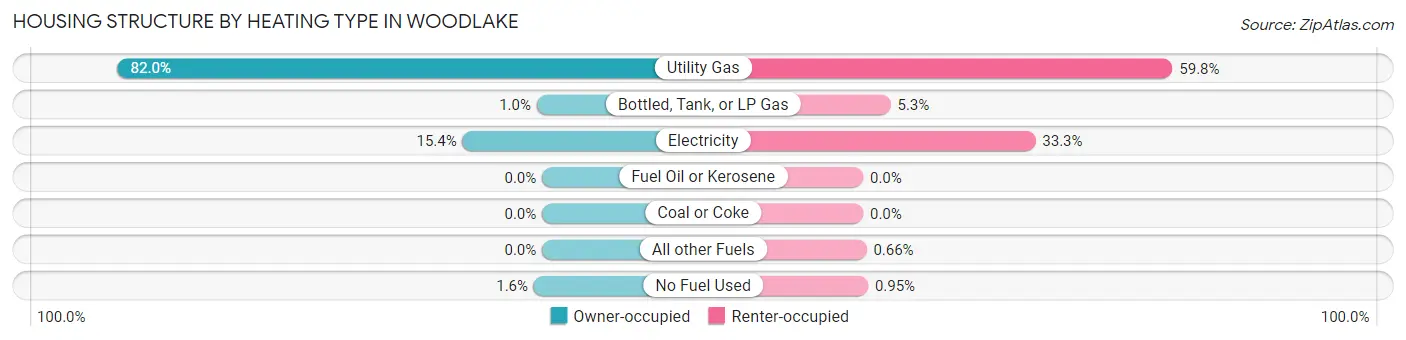
| Heating Type | Owner-occupied | Renter-occupied |
| Utility Gas | 875 (82.0%) | 630 (59.8%) |
| Bottled, Tank, or LP Gas | 11 (1.0%) | 56 (5.3%) |
| Electricity | 164 (15.4%) | 351 (33.3%) |
| Fuel Oil or Kerosene | 0 (0.0%) | 0 (0.0%) |
| Coal or Coke | 0 (0.0%) | 0 (0.0%) |
| All other Fuels | 0 (0.0%) | 7 (0.7%) |
| No Fuel Used | 17 (1.6%) | 10 (0.9%) |
| Total | 1,067 (100.0%) | 1,054 (100.0%) |
Household Vehicle Usage in Woodlake
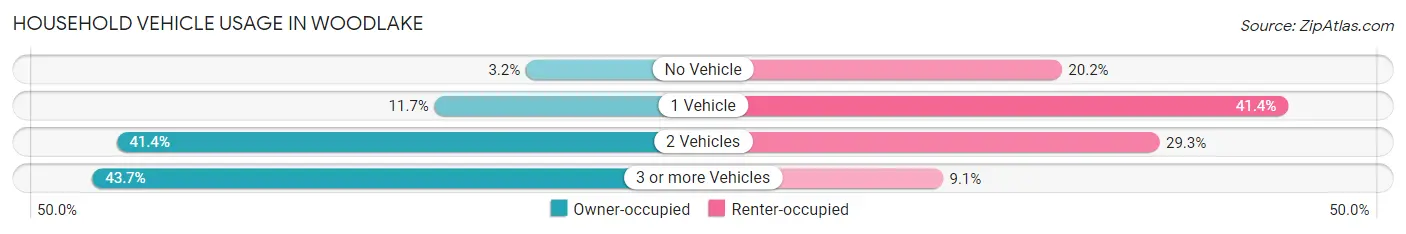
| Vehicles per Household | Owner-occupied | Renter-occupied |
| No Vehicle | 34 (3.2%) | 213 (20.2%) |
| 1 Vehicle | 125 (11.7%) | 436 (41.4%) |
| 2 Vehicles | 442 (41.4%) | 309 (29.3%) |
| 3 or more Vehicles | 466 (43.7%) | 96 (9.1%) |
| Total | 1,067 (100.0%) | 1,054 (100.0%) |
Real Estate & Mortgages in Woodlake
Real Estate and Mortgage Overview in Woodlake
| Characteristic | Without Mortgage | With Mortgage |
| Housing Units | 464 | 603 |
| Median Property Value | $221,700 | $266,200 |
| Median Household Income | $80,047 | $78 |
| Monthly Housing Costs | $527 | $24 |
| Real Estate Taxes | $1,373 | $38 |
Property Value by Mortgage Status in Woodlake
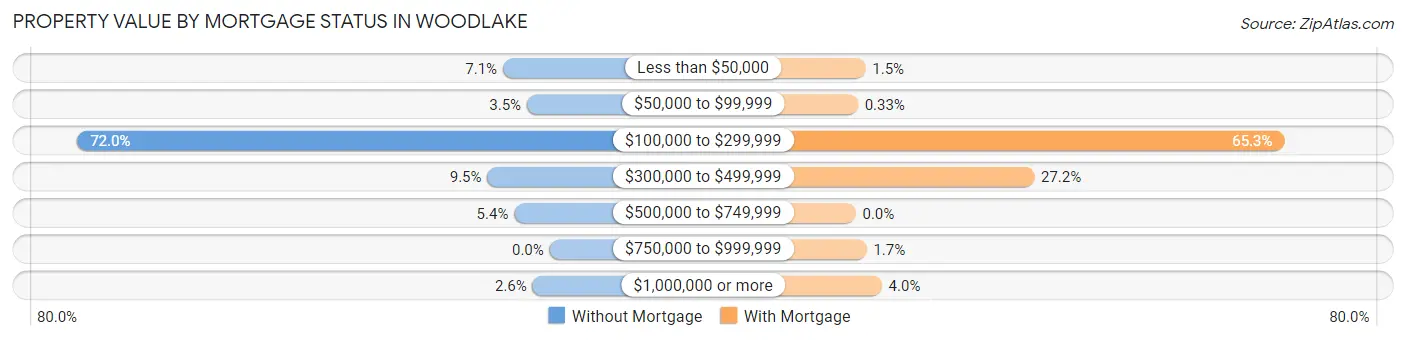
| Property Value | Without Mortgage | With Mortgage |
| Less than $50,000 | 33 (7.1%) | 9 (1.5%) |
| $50,000 to $99,999 | 16 (3.5%) | 2 (0.3%) |
| $100,000 to $299,999 | 334 (72.0%) | 394 (65.3%) |
| $300,000 to $499,999 | 44 (9.5%) | 164 (27.2%) |
| $500,000 to $749,999 | 25 (5.4%) | 0 (0.0%) |
| $750,000 to $999,999 | 0 (0.0%) | 10 (1.7%) |
| $1,000,000 or more | 12 (2.6%) | 24 (4.0%) |
| Total | 464 (100.0%) | 603 (100.0%) |
Household Income by Mortgage Status in Woodlake
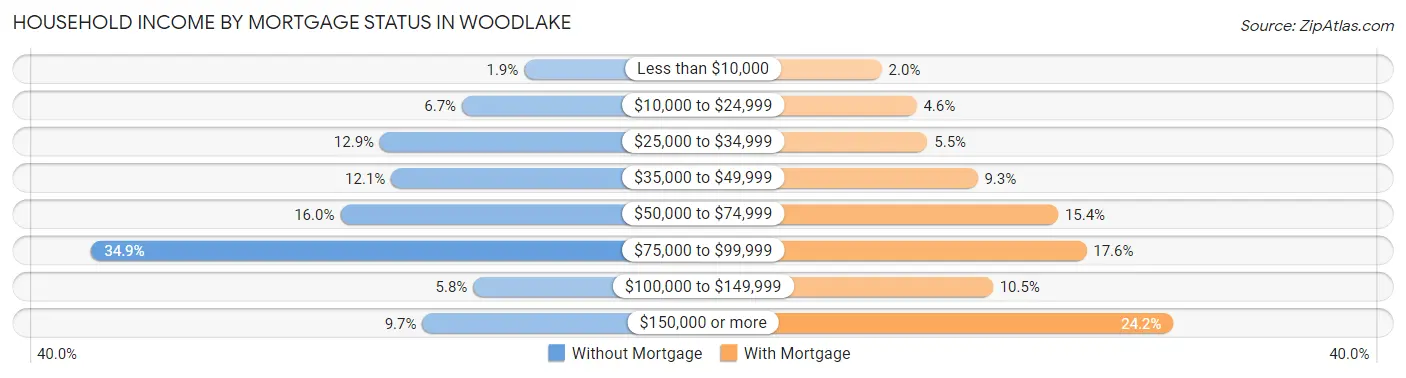
| Household Income | Without Mortgage | With Mortgage |
| Less than $10,000 | 9 (1.9%) | 12 (2.0%) |
| $10,000 to $24,999 | 31 (6.7%) | 28 (4.6%) |
| $25,000 to $34,999 | 60 (12.9%) | 33 (5.5%) |
| $35,000 to $49,999 | 56 (12.1%) | 56 (9.3%) |
| $50,000 to $74,999 | 74 (16.0%) | 93 (15.4%) |
| $75,000 to $99,999 | 162 (34.9%) | 106 (17.6%) |
| $100,000 to $149,999 | 27 (5.8%) | 63 (10.4%) |
| $150,000 or more | 45 (9.7%) | 146 (24.2%) |
| Total | 464 (100.0%) | 603 (100.0%) |
Property Value to Household Income Ratio in Woodlake
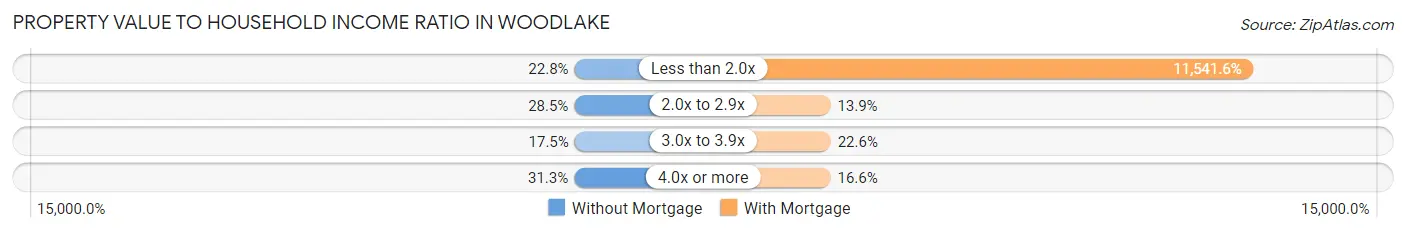
| Value-to-Income Ratio | Without Mortgage | With Mortgage |
| Less than 2.0x | 106 (22.8%) | 69,596 (11,541.6%) |
| 2.0x to 2.9x | 132 (28.4%) | 84 (13.9%) |
| 3.0x to 3.9x | 81 (17.5%) | 136 (22.6%) |
| 4.0x or more | 145 (31.2%) | 100 (16.6%) |
| Total | 464 (100.0%) | 603 (100.0%) |
Real Estate Taxes by Mortgage Status in Woodlake
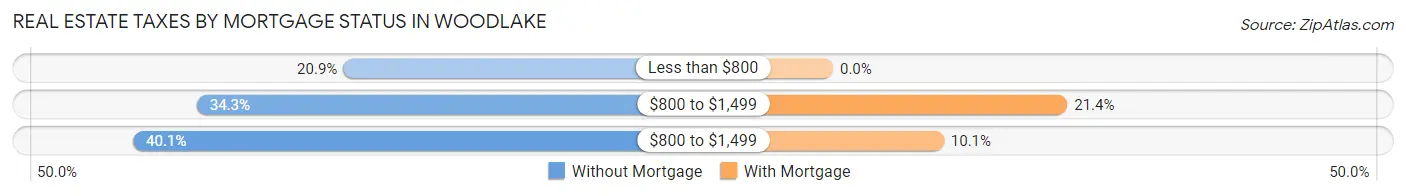
| Property Taxes | Without Mortgage | With Mortgage |
| Less than $800 | 97 (20.9%) | 0 (0.0%) |
| $800 to $1,499 | 159 (34.3%) | 129 (21.4%) |
| $800 to $1,499 | 186 (40.1%) | 61 (10.1%) |
| Total | 464 (100.0%) | 603 (100.0%) |
Health & Disability in Woodlake
Health Insurance Coverage by Age in Woodlake
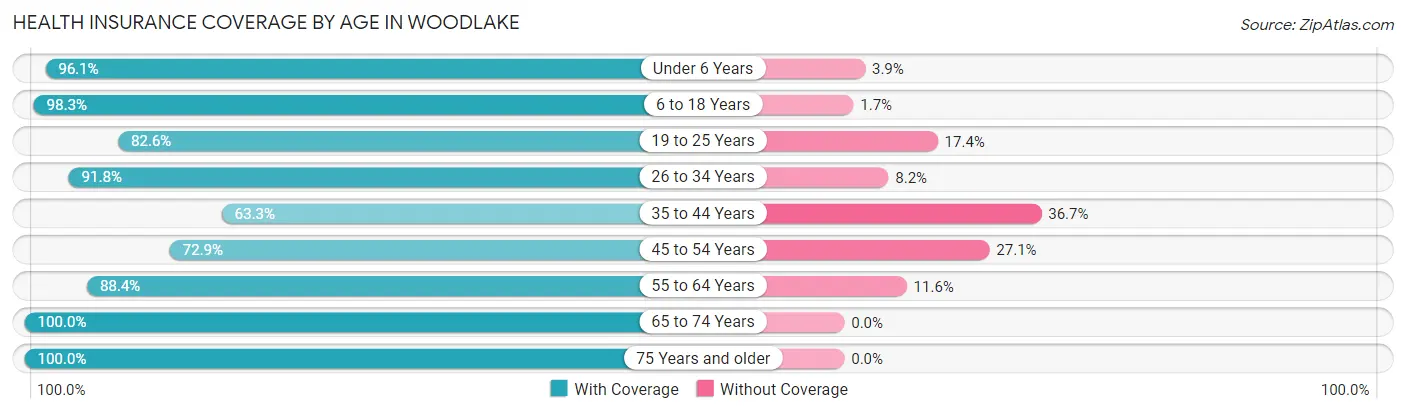
| Age Bracket | With Coverage | Without Coverage |
| Under 6 Years | 696 (96.1%) | 28 (3.9%) |
| 6 to 18 Years | 1,919 (98.3%) | 33 (1.7%) |
| 19 to 25 Years | 607 (82.6%) | 128 (17.4%) |
| 26 to 34 Years | 938 (91.8%) | 84 (8.2%) |
| 35 to 44 Years | 551 (63.3%) | 320 (36.7%) |
| 45 to 54 Years | 585 (72.9%) | 217 (27.1%) |
| 55 to 64 Years | 638 (88.4%) | 84 (11.6%) |
| 65 to 74 Years | 352 (100.0%) | 0 (0.0%) |
| 75 Years and older | 315 (100.0%) | 0 (0.0%) |
| Total | 6,601 (88.1%) | 894 (11.9%) |
Health Insurance Coverage by Citizenship Status in Woodlake
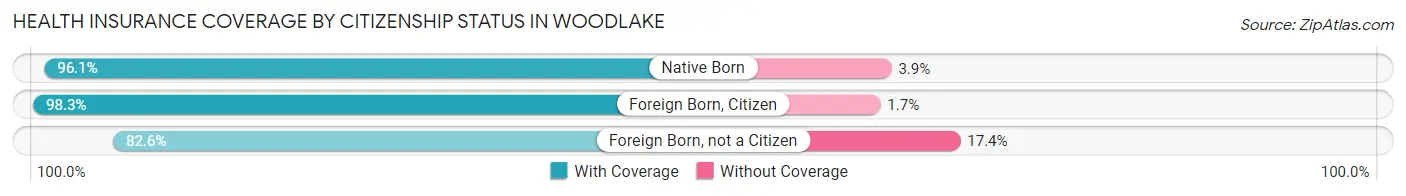
| Citizenship Status | With Coverage | Without Coverage |
| Native Born | 696 (96.1%) | 28 (3.9%) |
| Foreign Born, Citizen | 1,919 (98.3%) | 33 (1.7%) |
| Foreign Born, not a Citizen | 607 (82.6%) | 128 (17.4%) |
Health Insurance Coverage by Household Income in Woodlake
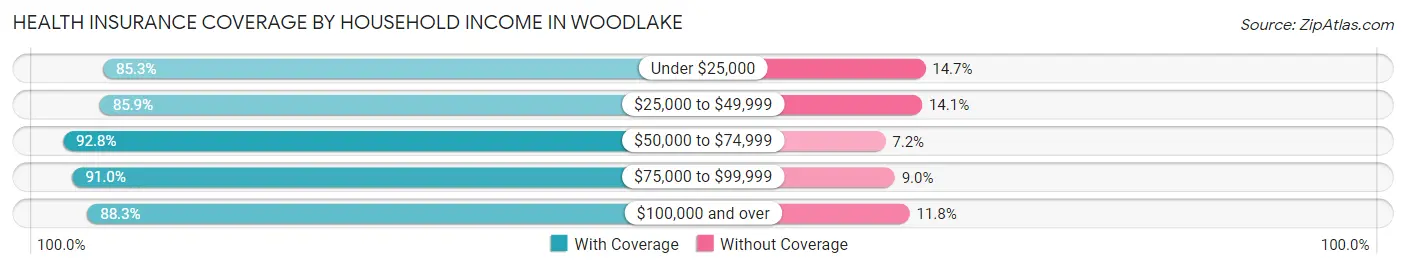
| Household Income | With Coverage | Without Coverage |
| Under $25,000 | 1,137 (85.3%) | 196 (14.7%) |
| $25,000 to $49,999 | 1,958 (85.9%) | 321 (14.1%) |
| $50,000 to $74,999 | 990 (92.8%) | 77 (7.2%) |
| $75,000 to $99,999 | 983 (91.0%) | 97 (9.0%) |
| $100,000 and over | 1,525 (88.2%) | 203 (11.7%) |
Public vs Private Health Insurance Coverage by Age in Woodlake
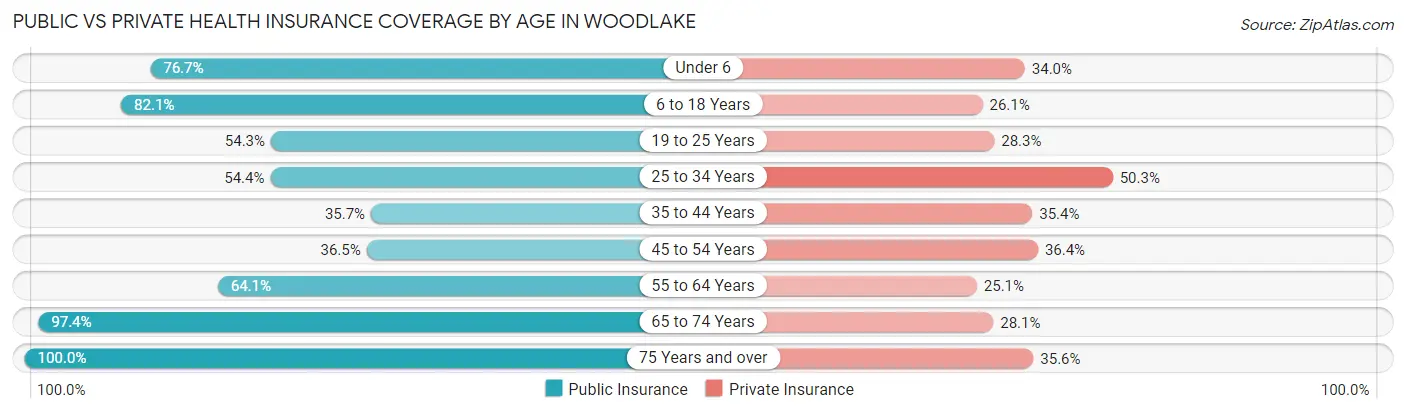
| Age Bracket | Public Insurance | Private Insurance |
| Under 6 | 555 (76.7%) | 246 (34.0%) |
| 6 to 18 Years | 1,602 (82.1%) | 510 (26.1%) |
| 19 to 25 Years | 399 (54.3%) | 208 (28.3%) |
| 25 to 34 Years | 556 (54.4%) | 514 (50.3%) |
| 35 to 44 Years | 311 (35.7%) | 308 (35.4%) |
| 45 to 54 Years | 293 (36.5%) | 292 (36.4%) |
| 55 to 64 Years | 463 (64.1%) | 181 (25.1%) |
| 65 to 74 Years | 343 (97.4%) | 99 (28.1%) |
| 75 Years and over | 315 (100.0%) | 112 (35.6%) |
| Total | 4,837 (64.5%) | 2,470 (33.0%) |
Disability Status by Sex by Age in Woodlake
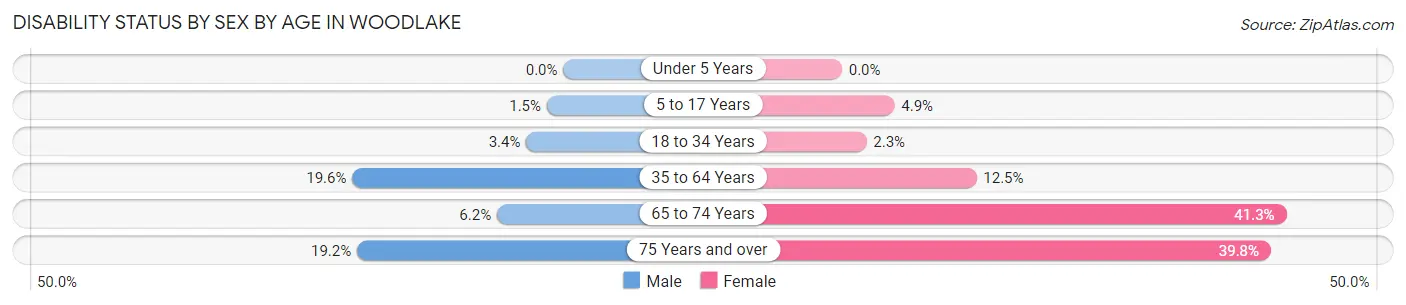
| Age Bracket | Male | Female |
| Under 5 Years | 0 (0.0%) | 0 (0.0%) |
| 5 to 17 Years | 13 (1.5%) | 42 (4.9%) |
| 18 to 34 Years | 35 (3.4%) | 23 (2.3%) |
| 35 to 64 Years | 248 (19.6%) | 141 (12.5%) |
| 65 to 74 Years | 9 (6.2%) | 85 (41.3%) |
| 75 Years and over | 18 (19.2%) | 88 (39.8%) |
Disability Class by Sex by Age in Woodlake
Disability Class: Hearing Difficulty
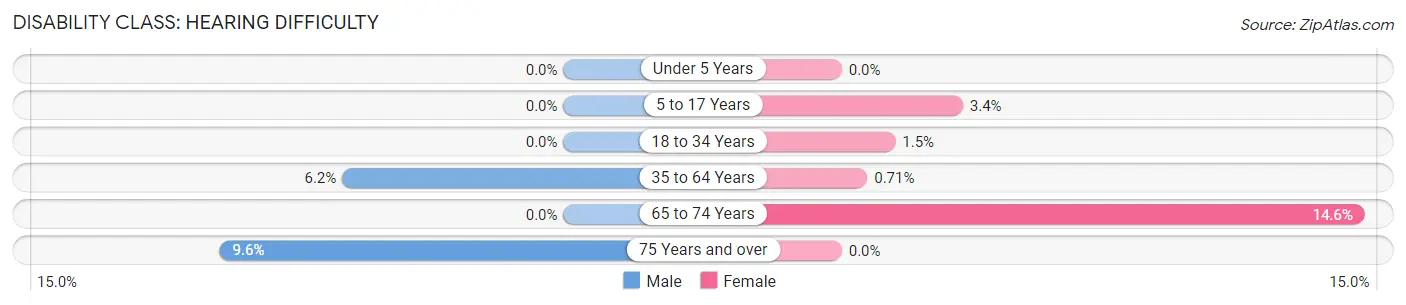
| Age Bracket | Male | Female |
| Under 5 Years | 0 (0.0%) | 0 (0.0%) |
| 5 to 17 Years | 0 (0.0%) | 29 (3.4%) |
| 18 to 34 Years | 0 (0.0%) | 15 (1.5%) |
| 35 to 64 Years | 78 (6.2%) | 8 (0.7%) |
| 65 to 74 Years | 0 (0.0%) | 30 (14.6%) |
| 75 Years and over | 9 (9.6%) | 0 (0.0%) |
Disability Class: Vision Difficulty
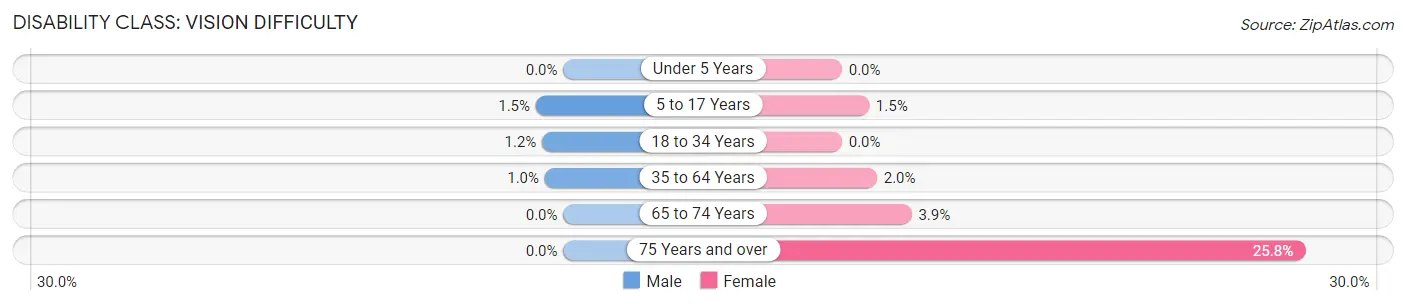
| Age Bracket | Male | Female |
| Under 5 Years | 0 (0.0%) | 0 (0.0%) |
| 5 to 17 Years | 13 (1.5%) | 13 (1.5%) |
| 18 to 34 Years | 12 (1.2%) | 0 (0.0%) |
| 35 to 64 Years | 13 (1.0%) | 22 (1.9%) |
| 65 to 74 Years | 0 (0.0%) | 8 (3.9%) |
| 75 Years and over | 0 (0.0%) | 57 (25.8%) |
Disability Class: Cognitive Difficulty
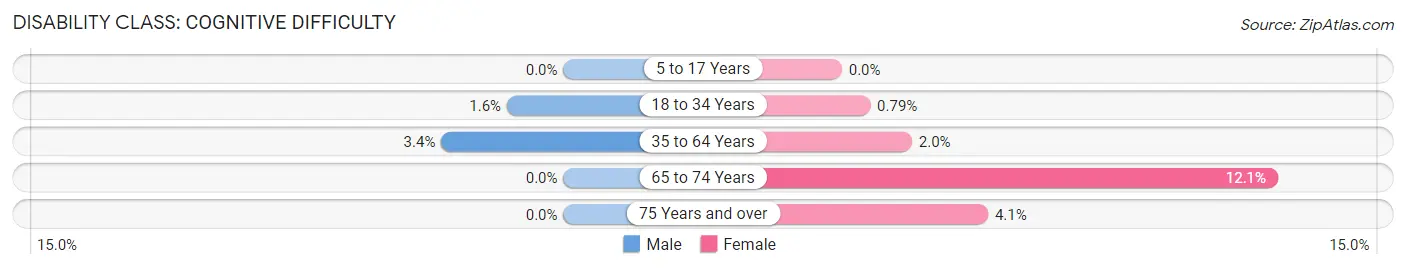
| Age Bracket | Male | Female |
| 5 to 17 Years | 0 (0.0%) | 0 (0.0%) |
| 18 to 34 Years | 16 (1.6%) | 8 (0.8%) |
| 35 to 64 Years | 43 (3.4%) | 22 (1.9%) |
| 65 to 74 Years | 0 (0.0%) | 25 (12.1%) |
| 75 Years and over | 0 (0.0%) | 9 (4.1%) |
Disability Class: Ambulatory Difficulty
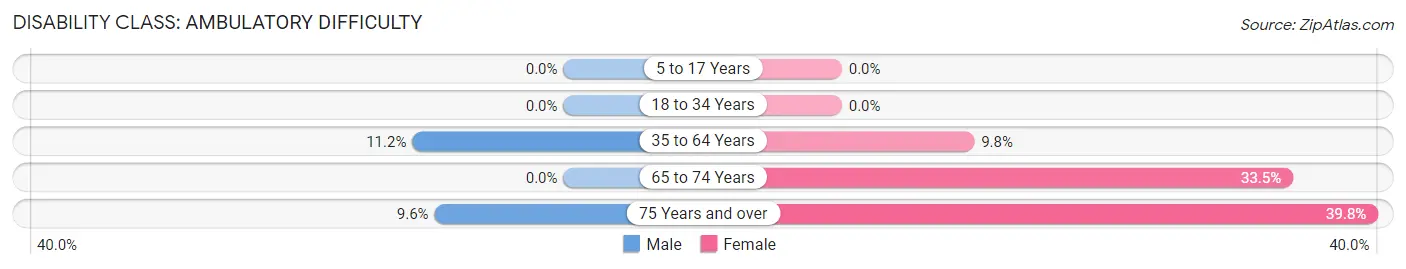
| Age Bracket | Male | Female |
| 5 to 17 Years | 0 (0.0%) | 0 (0.0%) |
| 18 to 34 Years | 0 (0.0%) | 0 (0.0%) |
| 35 to 64 Years | 142 (11.2%) | 111 (9.8%) |
| 65 to 74 Years | 0 (0.0%) | 69 (33.5%) |
| 75 Years and over | 9 (9.6%) | 88 (39.8%) |
Disability Class: Self-Care Difficulty
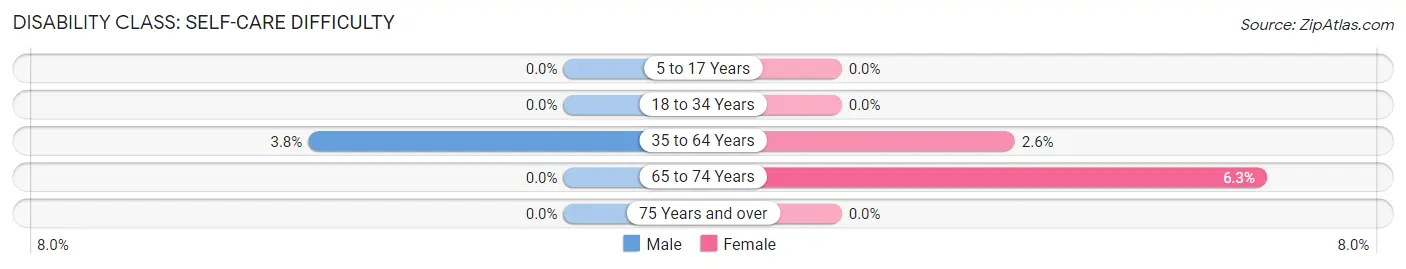
| Age Bracket | Male | Female |
| 5 to 17 Years | 0 (0.0%) | 0 (0.0%) |
| 18 to 34 Years | 0 (0.0%) | 0 (0.0%) |
| 35 to 64 Years | 48 (3.8%) | 29 (2.6%) |
| 65 to 74 Years | 0 (0.0%) | 13 (6.3%) |
| 75 Years and over | 0 (0.0%) | 0 (0.0%) |
Technology Access in Woodlake
Computing Device Access in Woodlake
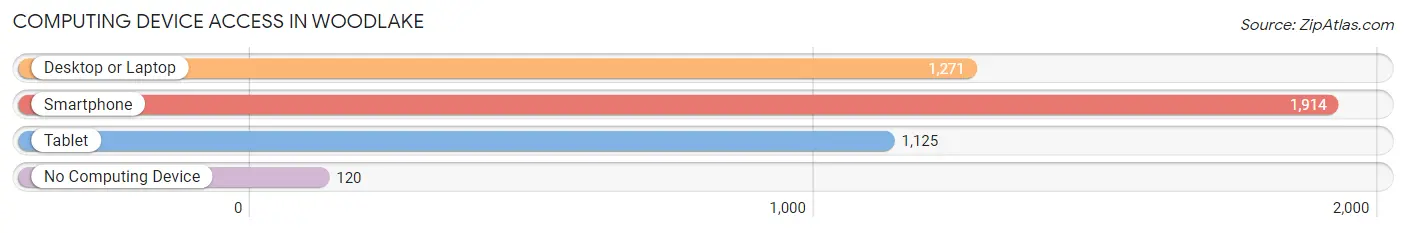
| Device Type | # Households | % Households |
| Desktop or Laptop | 1,271 | 59.9% |
| Smartphone | 1,914 | 90.2% |
| Tablet | 1,125 | 53.0% |
| No Computing Device | 120 | 5.7% |
| Total | 2,121 | 100.0% |
Internet Access in Woodlake
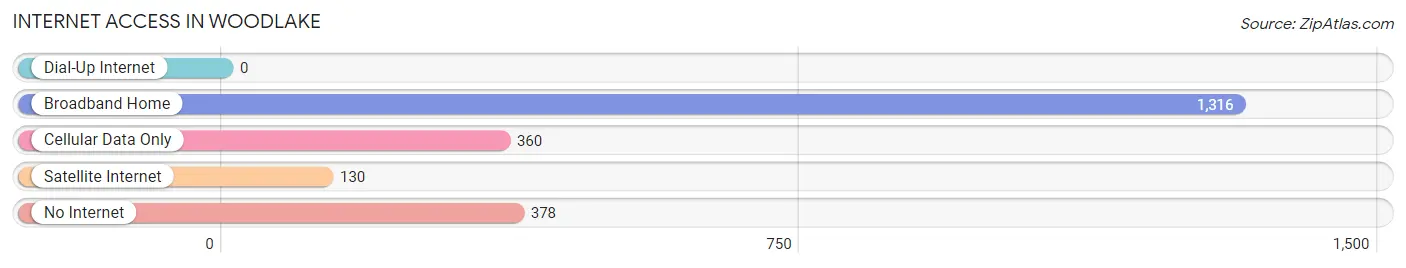
| Internet Type | # Households | % Households |
| Dial-Up Internet | 0 | 0.0% |
| Broadband Home | 1,316 | 62.1% |
| Cellular Data Only | 360 | 17.0% |
| Satellite Internet | 130 | 6.1% |
| No Internet | 378 | 17.8% |
| Total | 2,121 | 100.0% |
Woodlake Summary
Woodlake is a small city located in Tulare County, California, United States. It is situated in the San Joaquin Valley, approximately 8 miles (13 km) east of Visalia and 8 miles (13 km) west of Exeter. The population was 7,279 at the 2010 census, up from 6,651 at the 2000 census.
History
Woodlake was founded in 1874 by a group of settlers from Visalia. The town was named after the nearby Woodlake Ranch, which was owned by the prominent local family of the same name. The ranch was established in 1853 by William and Mary Wood, who had emigrated from England.
The town grew slowly over the next few decades, and by the early 1900s had become a thriving agricultural center. The town was incorporated in 1921, and by the 1940s had become a popular tourist destination.
Geography
Woodlake is located at 36 20 25 North 119 14 17 West 36 340278 119 238333
According to the United States Census Bureau, the city has a total area of 2.3 square miles (6.0 km2), all of it land.
Economy
Woodlake’s economy is largely based on agriculture. The city is home to a variety of farms, including citrus, almond, and pistachio orchards. The city is also home to a number of small businesses, including restaurants, retail stores, and service providers.
Demographics
As of the census of 2000, there were 6,651 people, 2,093 households, and 1,619 families residing in the city. The population density was 2,890.3 people per square mile (1,117.2/km2). There were 2,213 housing units at an average density of 962.2 per square mile (371.2/km2). The racial makeup of the city was 68.2% White, 0.7% African American, 1.2% Native American, 0.5% Asian, 0.1% Pacific Islander, 25.7% from other races, and 3.6% from two or more races. Hispanic or Latino of any race were 44.2% of the population.
There were 2,093 households, out of which 41.2% had children under the age of 18 living with them, 57.2% were married couples living together, 14.2% had a female householder with no husband present, and 22.2% were non-families. 17.7% of all households were made up of individuals, and 8.2% had someone living alone who was 65 years of age or older. The average household size was 3.17 and the average family size was 3.58.
In the city, the population was spread out, with 32.2% under the age of 18, 10.2% from 18 to 24, 27.2% from 25 to 44, 19.2% from 45 to 64, and 11.2% who were 65 years of age or older. The median age was 31 years. For every 100 females, there were 97.2 males. For every 100 females age 18 and over, there were 93.2 males.
The median income for a household in the city was $30,917, and the median income for a family was $33,906. Males had a median income of $27,917 versus $20,917 for females. The per capita income for the city was $12,917. About 17.2% of families and 20.2% of the population were below the poverty line, including 25.2% of those under age 18 and 11.2% of those age 65 or over.
Common Questions
What is Per Capita Income in Woodlake?
Per Capita income in Woodlake is $18,006.
What is the Median Family Income in Woodlake?
Median Family Income in Woodlake is $48,879.
What is the Median Household income in Woodlake?
Median Household Income in Woodlake is $44,719.
What is Income or Wage Gap in Woodlake?
Income or Wage Gap in Woodlake is 30.2%.
Women in Woodlake earn 69.8 cents for every dollar earned by a man.
What is Inequality or Gini Index in Woodlake?
Inequality or Gini Index in Woodlake is 0.45.
What is the Total Population of Woodlake?
Total Population of Woodlake is 7,495.
What is the Total Male Population of Woodlake?
Total Male Population of Woodlake is 3,563.
What is the Total Female Population of Woodlake?
Total Female Population of Woodlake is 3,932.
What is the Ratio of Males per 100 Females in Woodlake?
There are 90.62 Males per 100 Females in Woodlake.
What is the Ratio of Females per 100 Males in Woodlake?
There are 110.36 Females per 100 Males in Woodlake.
What is the Median Population Age in Woodlake?
Median Population Age in Woodlake is 28.7 Years.
What is the Average Family Size in Woodlake
Average Family Size in Woodlake is 3.9 People.
What is the Average Household Size in Woodlake
Average Household Size in Woodlake is 3.5 People.
How Large is the Labor Force in Woodlake?
There are 3,003 People in the Labor Forcein in Woodlake.
What is the Percentage of People in the Labor Force in Woodlake?
55.3% of People are in the Labor Force in Woodlake.
What is the Unemployment Rate in Woodlake?
Unemployment Rate in Woodlake is 9.1%.