Cities with the Highest Percentage of Population Employed in Material Moving in North Carolina
RELATED REPORTS & OPTIONS
Material Moving
North Carolina
Compare Cities
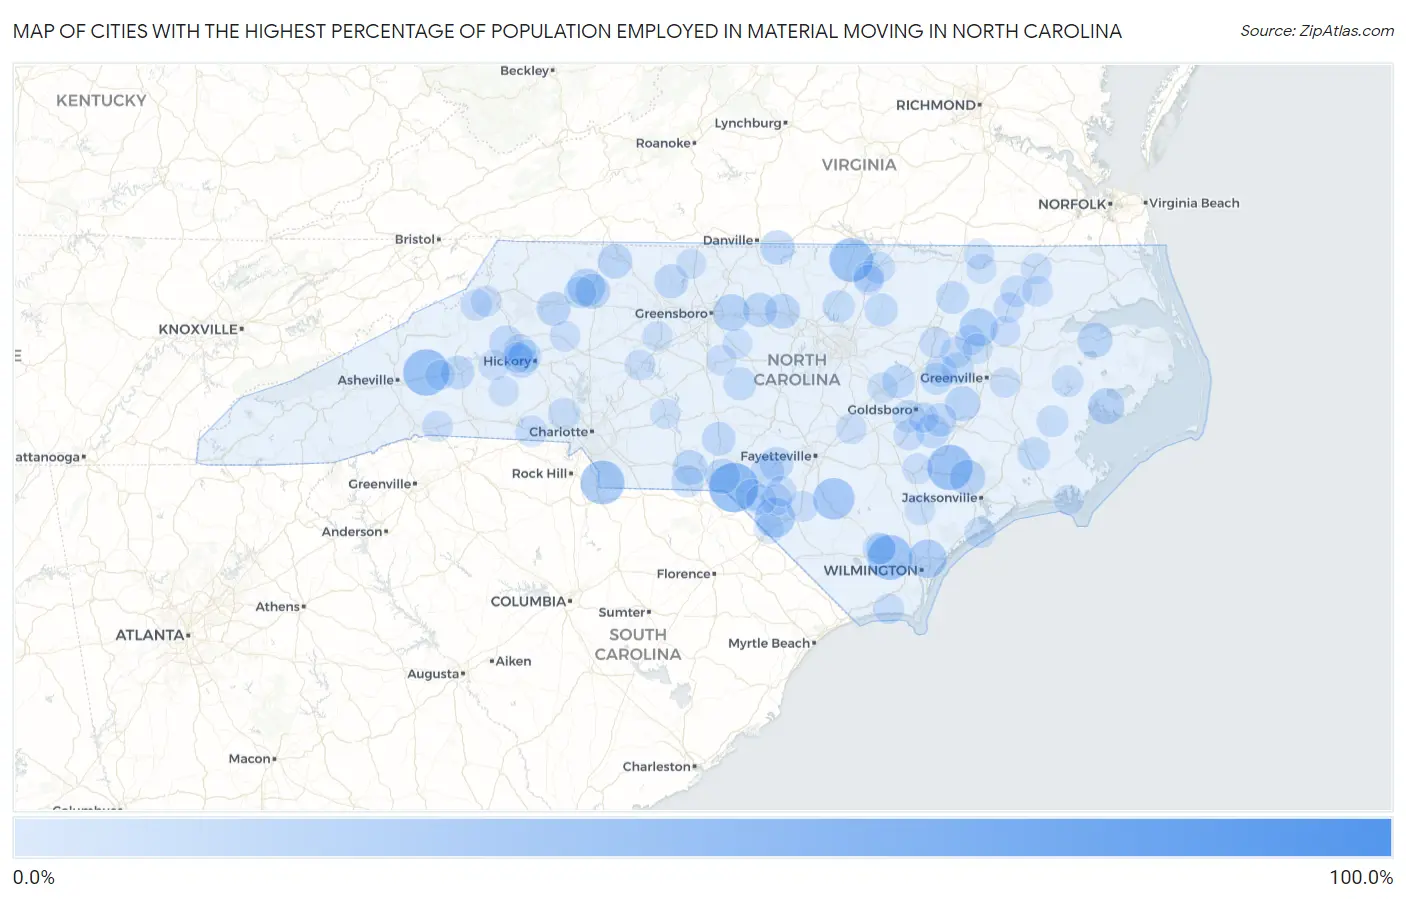
Map of Cities with the Highest Percentage of Population Employed in Material Moving in North Carolina
0.0%
100.0%
Cities with the Highest Percentage of Population Employed in Material Moving in North Carolina
| City | % Employed | vs State | vs National | |
| 1. | Long Creek | 100.0% | 4.1%(+95.9)#1 | 3.8%(+96.2)#11 |
| 2. | Yadkin College | 58.2% | 4.1%(+54.1)#2 | 3.8%(+54.3)#73 |
| 3. | Old Hundred | 50.0% | 4.1%(+45.9)#3 | 3.8%(+46.2)#99 |
| 4. | Montreat | 43.1% | 4.1%(+39.0)#4 | 3.8%(+39.2)#134 |
| 5. | Potters Hill | 41.2% | 4.1%(+37.1)#5 | 3.8%(+37.3)#157 |
| 6. | Delco | 40.0% | 4.1%(+35.9)#6 | 3.8%(+36.2)#164 |
| 7. | Jaars | 38.2% | 4.1%(+34.1)#7 | 3.8%(+34.4)#180 |
| 8. | Stovall | 37.6% | 4.1%(+33.5)#8 | 3.8%(+33.7)#188 |
| 9. | White Oak | 33.1% | 4.1%(+29.0)#9 | 3.8%(+29.2)#253 |
| 10. | Elrod | 29.6% | 4.1%(+25.5)#10 | 3.8%(+25.8)#315 |
| 11. | Blue Clay Farms | 26.5% | 4.1%(+22.4)#11 | 3.8%(+22.7)#394 |
| 12. | Speed | 25.9% | 4.1%(+21.8)#12 | 3.8%(+22.1)#410 |
| 13. | Pleasant Hill | 24.4% | 4.1%(+20.3)#13 | 3.8%(+20.6)#468 |
| 14. | Sedalia | 23.1% | 4.1%(+19.0)#14 | 3.8%(+19.3)#532 |
| 15. | Swan Quarter | 21.5% | 4.1%(+17.4)#15 | 3.8%(+17.7)#622 |
| 16. | Richlands | 20.6% | 4.1%(+16.5)#16 | 3.8%(+16.7)#687 |
| 17. | Dobbins Heights | 19.5% | 4.1%(+15.4)#17 | 3.8%(+15.7)#759 |
| 18. | Hookerton | 19.4% | 4.1%(+15.4)#18 | 3.8%(+15.6)#762 |
| 19. | Creswell | 19.4% | 4.1%(+15.3)#19 | 3.8%(+15.5)#770 |
| 20. | Jonesville | 19.2% | 4.1%(+15.1)#20 | 3.8%(+15.3)#785 |
| 21. | Efland | 18.7% | 4.1%(+14.6)#21 | 3.8%(+14.9)#829 |
| 22. | Lilesville | 18.6% | 4.1%(+14.5)#22 | 3.8%(+14.8)#837 |
| 23. | White Plains | 18.6% | 4.1%(+14.5)#23 | 3.8%(+14.8)#840 |
| 24. | Haw River | 18.1% | 4.1%(+14.0)#24 | 3.8%(+14.3)#904 |
| 25. | Milton | 18.0% | 4.1%(+13.9)#25 | 3.8%(+14.2)#909 |
| 26. | Moravian Falls | 17.5% | 4.1%(+13.4)#26 | 3.8%(+13.6)#981 |
| 27. | Gamewell | 17.4% | 4.1%(+13.3)#27 | 3.8%(+13.6)#986 |
| 28. | Walnut Cove | 17.1% | 4.1%(+13.1)#28 | 3.8%(+13.3)#1,017 |
| 29. | West Marion | 16.7% | 4.1%(+12.6)#29 | 3.8%(+12.8)#1,070 |
| 30. | Norman | 16.7% | 4.1%(+12.6)#30 | 3.8%(+12.8)#1,080 |
| 31. | Seven Springs | 16.7% | 4.1%(+12.6)#31 | 3.8%(+12.8)#1,098 |
| 32. | Silver City | 16.6% | 4.1%(+12.5)#32 | 3.8%(+12.8)#1,103 |
| 33. | Kenly | 16.1% | 4.1%(+12.0)#33 | 3.8%(+12.3)#1,176 |
| 34. | Bowmore | 16.0% | 4.1%(+11.9)#34 | 3.8%(+12.2)#1,191 |
| 35. | Icard | 16.0% | 4.1%(+11.9)#35 | 3.8%(+12.2)#1,195 |
| 36. | La Grange | 15.9% | 4.1%(+11.9)#36 | 3.8%(+12.1)#1,199 |
| 37. | Bennett | 15.7% | 4.1%(+11.6)#37 | 3.8%(+11.9)#1,244 |
| 38. | Louisburg | 15.5% | 4.1%(+11.4)#38 | 3.8%(+11.6)#1,284 |
| 39. | Fairfield Harbour | 15.4% | 4.1%(+11.3)#39 | 3.8%(+11.5)#1,314 |
| 40. | Enfield | 14.9% | 4.1%(+10.8)#40 | 3.8%(+11.0)#1,405 |
| 41. | Rhodhiss | 14.8% | 4.1%(+10.7)#41 | 3.8%(+11.0)#1,422 |
| 42. | Mar Mac | 14.3% | 4.1%(+10.2)#42 | 3.8%(+10.5)#1,520 |
| 43. | Fountain | 14.1% | 4.1%(+10.0)#43 | 3.8%(+10.3)#1,582 |
| 44. | Morven | 14.0% | 4.1%(+9.89)#44 | 3.8%(+10.1)#1,620 |
| 45. | East Arcadia | 13.9% | 4.1%(+9.78)#45 | 3.8%(+10.0)#1,653 |
| 46. | Creedmoor | 13.8% | 4.1%(+9.68)#46 | 3.8%(+9.93)#1,680 |
| 47. | Stantonsburg | 13.0% | 4.1%(+8.91)#47 | 3.8%(+9.16)#1,926 |
| 48. | Ronda | 12.9% | 4.1%(+8.83)#48 | 3.8%(+9.09)#1,955 |
| 49. | East Laurinburg | 12.9% | 4.1%(+8.82)#49 | 3.8%(+9.07)#1,958 |
| 50. | Kings Mountain | 12.8% | 4.1%(+8.74)#50 | 3.8%(+8.99)#1,988 |
| 51. | Stanley | 12.8% | 4.1%(+8.73)#51 | 3.8%(+8.99)#1,994 |
| 52. | Aurora | 12.7% | 4.1%(+8.60)#52 | 3.8%(+8.85)#2,034 |
| 53. | Saratoga | 12.6% | 4.1%(+8.49)#53 | 3.8%(+8.74)#2,076 |
| 54. | Sawmills | 12.5% | 4.1%(+8.37)#54 | 3.8%(+8.62)#2,124 |
| 55. | Pinetops | 12.4% | 4.1%(+8.28)#55 | 3.8%(+8.53)#2,152 |
| 56. | Middleburg | 12.3% | 4.1%(+8.24)#56 | 3.8%(+8.50)#2,165 |
| 57. | Aulander | 12.0% | 4.1%(+7.90)#57 | 3.8%(+8.15)#2,300 |
| 58. | Pantego | 11.9% | 4.1%(+7.80)#58 | 3.8%(+8.05)#2,335 |
| 59. | Sharpsburg | 11.9% | 4.1%(+7.77)#59 | 3.8%(+8.03)#2,345 |
| 60. | Sugar Mountain | 11.8% | 4.1%(+7.70)#60 | 3.8%(+7.96)#2,376 |
| 61. | Deep Run | 11.7% | 4.1%(+7.64)#61 | 3.8%(+7.90)#2,411 |
| 62. | Prospect | 11.7% | 4.1%(+7.56)#62 | 3.8%(+7.82)#2,437 |
| 63. | North Topsail Beach | 11.1% | 4.1%(+7.06)#63 | 3.8%(+7.31)#2,659 |
| 64. | Foscoe | 11.1% | 4.1%(+7.02)#64 | 3.8%(+7.28)#2,662 |
| 65. | Winton | 11.1% | 4.1%(+7.02)#65 | 3.8%(+7.28)#2,668 |
| 66. | Mount Olive | 11.1% | 4.1%(+6.97)#66 | 3.8%(+7.22)#2,705 |
| 67. | Barker Ten Mile | 10.9% | 4.1%(+6.86)#67 | 3.8%(+7.12)#2,760 |
| 68. | Plain View | 10.9% | 4.1%(+6.79)#68 | 3.8%(+7.04)#2,795 |
| 69. | Kenansville | 10.8% | 4.1%(+6.75)#69 | 3.8%(+7.01)#2,809 |
| 70. | Maxton | 10.8% | 4.1%(+6.70)#70 | 3.8%(+6.96)#2,830 |
| 71. | Henderson | 10.7% | 4.1%(+6.65)#71 | 3.8%(+6.90)#2,855 |
| 72. | Columbus | 10.6% | 4.1%(+6.56)#72 | 3.8%(+6.81)#2,910 |
| 73. | Spencer | 10.6% | 4.1%(+6.54)#73 | 3.8%(+6.80)#2,916 |
| 74. | Hiddenite | 10.6% | 4.1%(+6.48)#74 | 3.8%(+6.73)#2,947 |
| 75. | Salem | 10.5% | 4.1%(+6.38)#75 | 3.8%(+6.64)#3,001 |
| 76. | Lewiston Woodville | 10.5% | 4.1%(+6.37)#76 | 3.8%(+6.63)#3,012 |
| 77. | Franklinville | 10.3% | 4.1%(+6.25)#77 | 3.8%(+6.50)#3,086 |
| 78. | Sandyfield | 10.3% | 4.1%(+6.19)#78 | 3.8%(+6.44)#3,121 |
| 79. | Connelly Springs | 10.3% | 4.1%(+6.18)#79 | 3.8%(+6.44)#3,124 |
| 80. | Elroy | 10.3% | 4.1%(+6.17)#80 | 3.8%(+6.42)#3,131 |
| 81. | South Henderson | 10.2% | 4.1%(+6.08)#81 | 3.8%(+6.34)#3,180 |
| 82. | Varnamtown | 10.0% | 4.1%(+5.94)#82 | 3.8%(+6.20)#3,271 |
| 83. | Princeville | 10.0% | 4.1%(+5.93)#83 | 3.8%(+6.19)#3,274 |
| 84. | Watha | 10.0% | 4.1%(+5.91)#84 | 3.8%(+6.17)#3,297 |
| 85. | Hamilton | 10.0% | 4.1%(+5.91)#85 | 3.8%(+6.17)#3,302 |
| 86. | Powellsville | 10.0% | 4.1%(+5.91)#86 | 3.8%(+6.17)#3,303 |
| 87. | Red Springs | 10.0% | 4.1%(+5.87)#87 | 3.8%(+6.13)#3,329 |
| 88. | Grimesland | 9.9% | 4.1%(+5.77)#88 | 3.8%(+6.03)#3,390 |
| 89. | Seaboard | 9.8% | 4.1%(+5.71)#89 | 3.8%(+5.97)#3,438 |
| 90. | Casar | 9.8% | 4.1%(+5.70)#90 | 3.8%(+5.95)#3,445 |
| 91. | Conetoe | 9.8% | 4.1%(+5.67)#91 | 3.8%(+5.93)#3,464 |
| 92. | Selma | 9.7% | 4.1%(+5.66)#92 | 3.8%(+5.91)#3,475 |
| 93. | Beaufort | 9.6% | 4.1%(+5.47)#93 | 3.8%(+5.73)#3,605 |
| 94. | Welcome | 9.5% | 4.1%(+5.40)#94 | 3.8%(+5.66)#3,658 |
| 95. | Mayodan | 9.4% | 4.1%(+5.35)#95 | 3.8%(+5.60)#3,732 |
| 96. | Jackson | 9.4% | 4.1%(+5.31)#96 | 3.8%(+5.57)#3,754 |
| 97. | Rowland | 9.2% | 4.1%(+5.12)#97 | 3.8%(+5.37)#3,889 |
| 98. | Old Fort | 9.2% | 4.1%(+5.10)#98 | 3.8%(+5.36)#3,901 |
| 99. | Liberty | 9.1% | 4.1%(+5.03)#99 | 3.8%(+5.28)#3,976 |
| 100. | Albemarle | 9.1% | 4.1%(+5.01)#100 | 3.8%(+5.27)#3,982 |
Common Questions
What are the Top 10 Cities with the Highest Percentage of Population Employed in Material Moving in North Carolina?
Top 10 Cities with the Highest Percentage of Population Employed in Material Moving in North Carolina are:
#1
50.0%
#2
43.1%
#3
41.2%
#4
40.0%
#5
38.2%
#6
37.6%
#7
33.1%
#8
29.6%
#9
26.5%
#10
25.9%
What city has the Highest Percentage of Population Employed in Material Moving in North Carolina?
Old Hundred has the Highest Percentage of Population Employed in Material Moving in North Carolina with 50.0%.
What is the Percentage of Population Employed in Material Moving in the State of North Carolina?
Percentage of Population Employed in Material Moving in North Carolina is 4.1%.
What is the Percentage of Population Employed in Material Moving in the United States?
Percentage of Population Employed in Material Moving in the United States is 3.8%.