Cities with the Highest Percentage of Population Employed in Material Moving in Wyoming
RELATED REPORTS & OPTIONS
Material Moving
Wyoming
Compare Cities
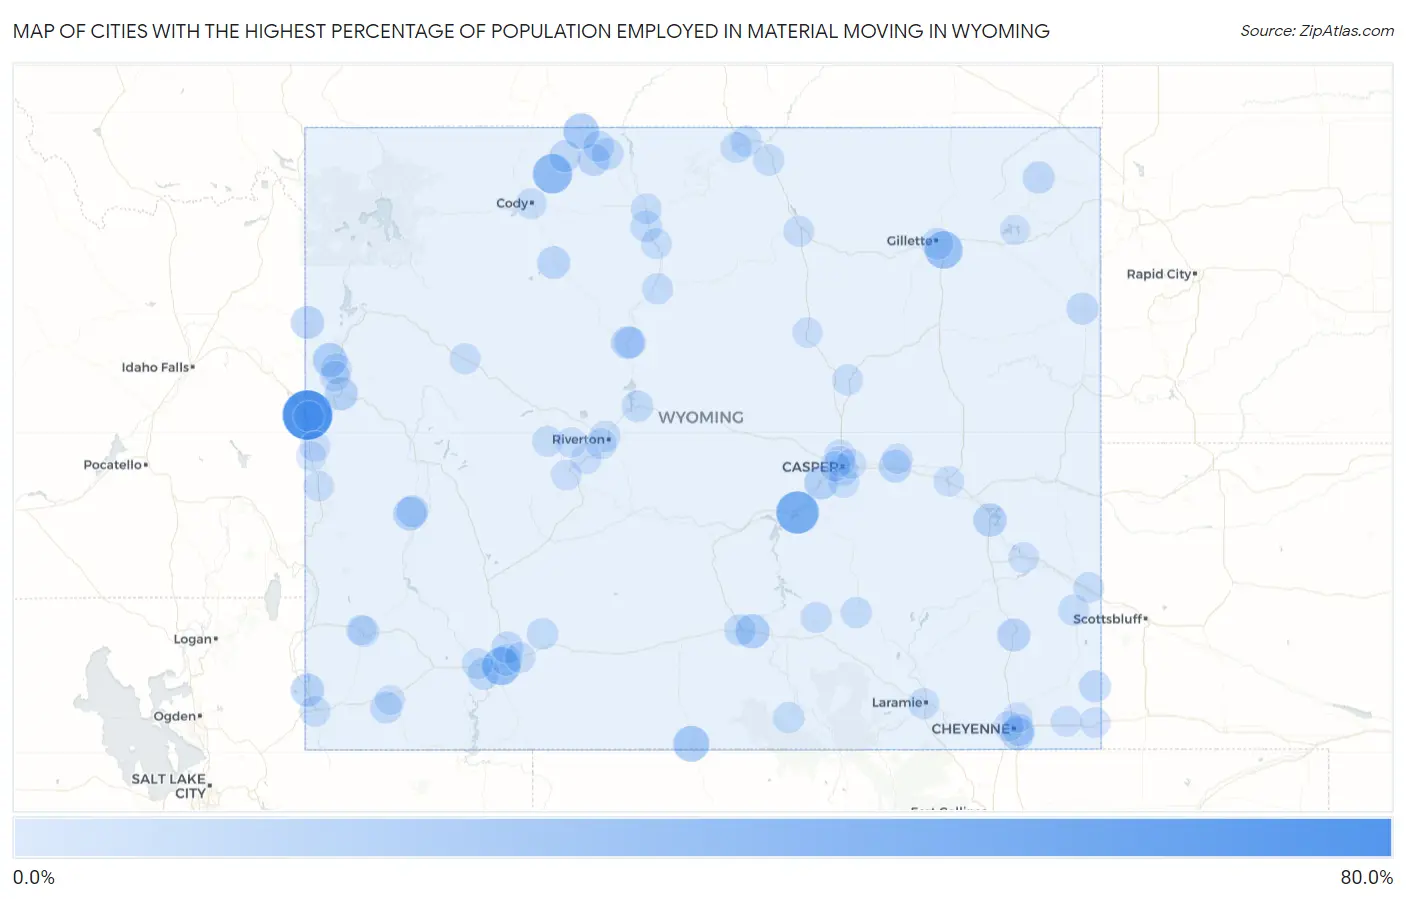
Map of Cities with the Highest Percentage of Population Employed in Material Moving in Wyoming
0.0%
80.0%
Cities with the Highest Percentage of Population Employed in Material Moving in Wyoming
| City | % Employed | vs State | vs National | |
| 1. | Alpine Northwest | 60.9% | 3.2%(+57.7)#1 | 3.8%(+57.1)#64 |
| 2. | Alcova | 38.2% | 3.2%(+35.0)#2 | 3.8%(+34.4)#181 |
| 3. | Ralston | 27.8% | 3.2%(+24.5)#3 | 3.8%(+23.9)#359 |
| 4. | Purple Sage | 23.3% | 3.2%(+20.1)#4 | 3.8%(+19.5)#524 |
| 5. | Sleepy Hollow | 22.6% | 3.2%(+19.3)#5 | 3.8%(+18.7)#562 |
| 6. | Baggs | 17.6% | 3.2%(+14.3)#6 | 3.8%(+13.7)#965 |
| 7. | Frannie | 16.7% | 3.2%(+13.4)#7 | 3.8%(+12.8)#1,077 |
| 8. | Sinclair | 12.4% | 3.2%(+9.21)#8 | 3.8%(+8.62)#2,126 |
| 9. | Moose Wilson Road | 12.1% | 3.2%(+8.82)#9 | 3.8%(+8.23)#2,268 |
| 10. | Bessemer Bend | 10.4% | 3.2%(+7.21)#10 | 3.8%(+6.62)#3,017 |
| 11. | Big Piney | 10.2% | 3.2%(+6.96)#11 | 3.8%(+6.36)#3,159 |
| 12. | Glendo | 9.9% | 3.2%(+6.65)#12 | 3.8%(+6.06)#3,373 |
| 13. | Hoback | 9.2% | 3.2%(+5.93)#13 | 3.8%(+5.34)#3,933 |
| 14. | Fox Farm College | 9.1% | 3.2%(+5.82)#14 | 3.8%(+5.23)#4,030 |
| 15. | Bear River | 9.0% | 3.2%(+5.74)#15 | 3.8%(+5.14)#4,097 |
| 16. | Alta | 8.8% | 3.2%(+5.54)#16 | 3.8%(+4.95)#4,248 |
| 17. | Chugwater | 8.6% | 3.2%(+5.33)#17 | 3.8%(+4.74)#4,442 |
| 18. | Thermopolis | 8.3% | 3.2%(+5.02)#18 | 3.8%(+4.43)#4,755 |
| 19. | Meeteetse | 7.8% | 3.2%(+4.58)#19 | 3.8%(+3.99)#5,276 |
| 20. | Glenrock | 7.8% | 3.2%(+4.51)#20 | 3.8%(+3.92)#5,369 |
| 21. | Byron | 6.0% | 3.2%(+2.73)#21 | 3.8%(+2.13)#8,109 |
| 22. | Hulett | 5.8% | 3.2%(+2.58)#22 | 3.8%(+1.99)#8,398 |
| 23. | Green River | 5.8% | 3.2%(+2.58)#23 | 3.8%(+1.99)#8,402 |
| 24. | Marbleton | 5.7% | 3.2%(+2.49)#24 | 3.8%(+1.90)#8,589 |
| 25. | Newcastle | 5.7% | 3.2%(+2.48)#25 | 3.8%(+1.89)#8,598 |
| 26. | North Rock Springs | 5.7% | 3.2%(+2.46)#26 | 3.8%(+1.86)#8,660 |
| 27. | Lovell | 5.7% | 3.2%(+2.42)#27 | 3.8%(+1.83)#8,743 |
| 28. | Powell | 5.6% | 3.2%(+2.36)#28 | 3.8%(+1.76)#8,869 |
| 29. | Albin | 5.6% | 3.2%(+2.32)#29 | 3.8%(+1.73)#8,952 |
| 30. | Gillette | 5.5% | 3.2%(+2.27)#30 | 3.8%(+1.67)#9,053 |
| 31. | Mountain View | 5.2% | 3.2%(+2.01)#31 | 3.8%(+1.41)#9,617 |
| 32. | Cheyenne | 5.1% | 3.2%(+1.91)#32 | 3.8%(+1.32)#9,843 |
| 33. | Basin | 4.6% | 3.2%(+1.39)#33 | 3.8%(+0.799)#11,116 |
| 34. | Clearview Acres | 4.4% | 3.2%(+1.17)#34 | 3.8%(+0.582)#11,691 |
| 35. | Rawlins | 4.3% | 3.2%(+1.10)#35 | 3.8%(+0.506)#11,914 |
| 36. | Shoshoni | 4.2% | 3.2%(+0.994)#36 | 3.8%(+0.401)#12,216 |
| 37. | La Grange | 4.1% | 3.2%(+0.833)#37 | 3.8%(+0.240)#12,676 |
| 38. | East Thermopolis | 4.0% | 3.2%(+0.763)#38 | 3.8%(+0.170)#12,891 |
| 39. | Superior | 3.8% | 3.2%(+0.609)#39 | 3.8%(+0.016)#13,325 |
| 40. | Encampment | 3.4% | 3.2%(+0.192)#40 | 3.8%(-0.402)#14,641 |
| 41. | Cowley | 3.3% | 3.2%(+0.060)#41 | 3.8%(-0.534)#15,043 |
| 42. | Medicine Bow | 3.3% | 3.2%(+0.053)#42 | 3.8%(-0.541)#15,066 |
| 43. | Casper | 3.2% | 3.2%(-0.012)#43 | 3.8%(-0.606)#15,255 |
| 44. | Sheridan | 3.2% | 3.2%(-0.036)#44 | 3.8%(-0.629)#15,327 |
| 45. | Worland | 3.1% | 3.2%(-0.090)#45 | 3.8%(-0.683)#15,494 |
| 46. | Diamondville | 3.0% | 3.2%(-0.199)#46 | 3.8%(-0.792)#15,812 |
| 47. | James Town | 3.0% | 3.2%(-0.241)#47 | 3.8%(-0.834)#15,958 |
| 48. | Ranchester | 3.0% | 3.2%(-0.261)#48 | 3.8%(-0.854)#16,020 |
| 49. | Dayton | 3.0% | 3.2%(-0.282)#49 | 3.8%(-0.876)#16,097 |
| 50. | Hanna | 2.9% | 3.2%(-0.359)#50 | 3.8%(-0.953)#16,352 |
| 51. | Yoder | 2.9% | 3.2%(-0.380)#51 | 3.8%(-0.973)#16,429 |
| 52. | Evanston | 2.8% | 3.2%(-0.467)#52 | 3.8%(-1.06)#16,681 |
| 53. | Riverton | 2.7% | 3.2%(-0.491)#53 | 3.8%(-1.08)#16,758 |
| 54. | Laramie | 2.7% | 3.2%(-0.528)#54 | 3.8%(-1.12)#16,869 |
| 55. | Midwest | 2.6% | 3.2%(-0.651)#55 | 3.8%(-1.24)#17,235 |
| 56. | Arapahoe | 2.6% | 3.2%(-0.664)#56 | 3.8%(-1.26)#17,278 |
| 57. | Jackson | 2.5% | 3.2%(-0.688)#57 | 3.8%(-1.28)#17,349 |
| 58. | Dubois | 2.5% | 3.2%(-0.737)#58 | 3.8%(-1.33)#17,511 |
| 59. | Buffalo | 2.5% | 3.2%(-0.745)#59 | 3.8%(-1.34)#17,548 |
| 60. | Manderson | 2.4% | 3.2%(-0.827)#60 | 3.8%(-1.42)#17,817 |
| 61. | Bar Nunn | 2.4% | 3.2%(-0.849)#61 | 3.8%(-1.44)#17,877 |
| 62. | Cody | 2.4% | 3.2%(-0.865)#62 | 3.8%(-1.46)#17,943 |
| 63. | Greybull | 2.2% | 3.2%(-0.992)#63 | 3.8%(-1.59)#18,377 |
| 64. | Casper Mountain | 2.2% | 3.2%(-1.05)#64 | 3.8%(-1.64)#18,559 |
| 65. | Fort Washakie | 2.1% | 3.2%(-1.14)#65 | 3.8%(-1.73)#18,814 |
| 66. | Rafter J Ranch | 2.1% | 3.2%(-1.16)#66 | 3.8%(-1.75)#18,892 |
| 67. | Torrington | 2.1% | 3.2%(-1.19)#67 | 3.8%(-1.78)#18,995 |
| 68. | Rock Springs | 2.0% | 3.2%(-1.21)#68 | 3.8%(-1.80)#19,055 |
| 69. | Douglas | 1.8% | 3.2%(-1.48)#69 | 3.8%(-2.07)#19,860 |
| 70. | Hudson | 1.7% | 3.2%(-1.50)#70 | 3.8%(-2.09)#19,936 |
| 71. | Burns | 1.7% | 3.2%(-1.51)#71 | 3.8%(-2.11)#19,982 |
| 72. | Ethete | 1.5% | 3.2%(-1.70)#72 | 3.8%(-2.29)#20,567 |
| 73. | Ranchettes | 1.5% | 3.2%(-1.74)#73 | 3.8%(-2.34)#20,728 |
| 74. | Warren Afb | 1.5% | 3.2%(-1.77)#74 | 3.8%(-2.36)#20,789 |
| 75. | Guernsey | 1.4% | 3.2%(-1.80)#75 | 3.8%(-2.39)#20,872 |
| 76. | Hartrandt | 1.4% | 3.2%(-1.83)#76 | 3.8%(-2.43)#20,996 |
| 77. | Rolling Hills | 1.4% | 3.2%(-1.83)#77 | 3.8%(-2.43)#20,998 |
| 78. | Alpine | 1.4% | 3.2%(-1.88)#78 | 3.8%(-2.48)#21,142 |
| 79. | Lander | 1.3% | 3.2%(-1.97)#79 | 3.8%(-2.56)#21,401 |
| 80. | Pine Bluffs | 1.2% | 3.2%(-2.02)#80 | 3.8%(-2.61)#21,553 |
| 81. | Afton | 1.1% | 3.2%(-2.12)#81 | 3.8%(-2.71)#21,824 |
| 82. | Mills | 1.0% | 3.2%(-2.21)#82 | 3.8%(-2.80)#22,050 |
| 83. | Star Valley Ranch | 0.99% | 3.2%(-2.24)#83 | 3.8%(-2.84)#22,142 |
| 84. | Kaycee | 0.88% | 3.2%(-2.36)#84 | 3.8%(-2.95)#22,453 |
| 85. | Pine Haven | 0.54% | 3.2%(-2.70)#85 | 3.8%(-3.29)#23,205 |
| 86. | Evansville | 0.36% | 3.2%(-2.87)#86 | 3.8%(-3.47)#23,470 |
| 87. | Kemmerer | 0.33% | 3.2%(-2.90)#87 | 3.8%(-3.50)#23,505 |
| 88. | Thayne | 0.33% | 3.2%(-2.91)#88 | 3.8%(-3.50)#23,509 |
| 89. | Lyman | 0.30% | 3.2%(-2.93)#89 | 3.8%(-3.53)#23,534 |
1
2Common Questions
What are the Top 10 Cities with the Highest Percentage of Population Employed in Material Moving in Wyoming?
Top 10 Cities with the Highest Percentage of Population Employed in Material Moving in Wyoming are:
#1
60.9%
#2
38.2%
#3
27.8%
#4
23.3%
#5
22.6%
#6
17.6%
#7
16.7%
#8
12.4%
#9
12.1%
#10
10.4%
What city has the Highest Percentage of Population Employed in Material Moving in Wyoming?
Alpine Northwest has the Highest Percentage of Population Employed in Material Moving in Wyoming with 60.9%.
What is the Percentage of Population Employed in Material Moving in the State of Wyoming?
Percentage of Population Employed in Material Moving in Wyoming is 3.2%.
What is the Percentage of Population Employed in Material Moving in the United States?
Percentage of Population Employed in Material Moving in the United States is 3.8%.