Cities with the Highest Percentage of Population Employed in Material Moving in Colorado
RELATED REPORTS & OPTIONS
Material Moving
Colorado
Compare Cities
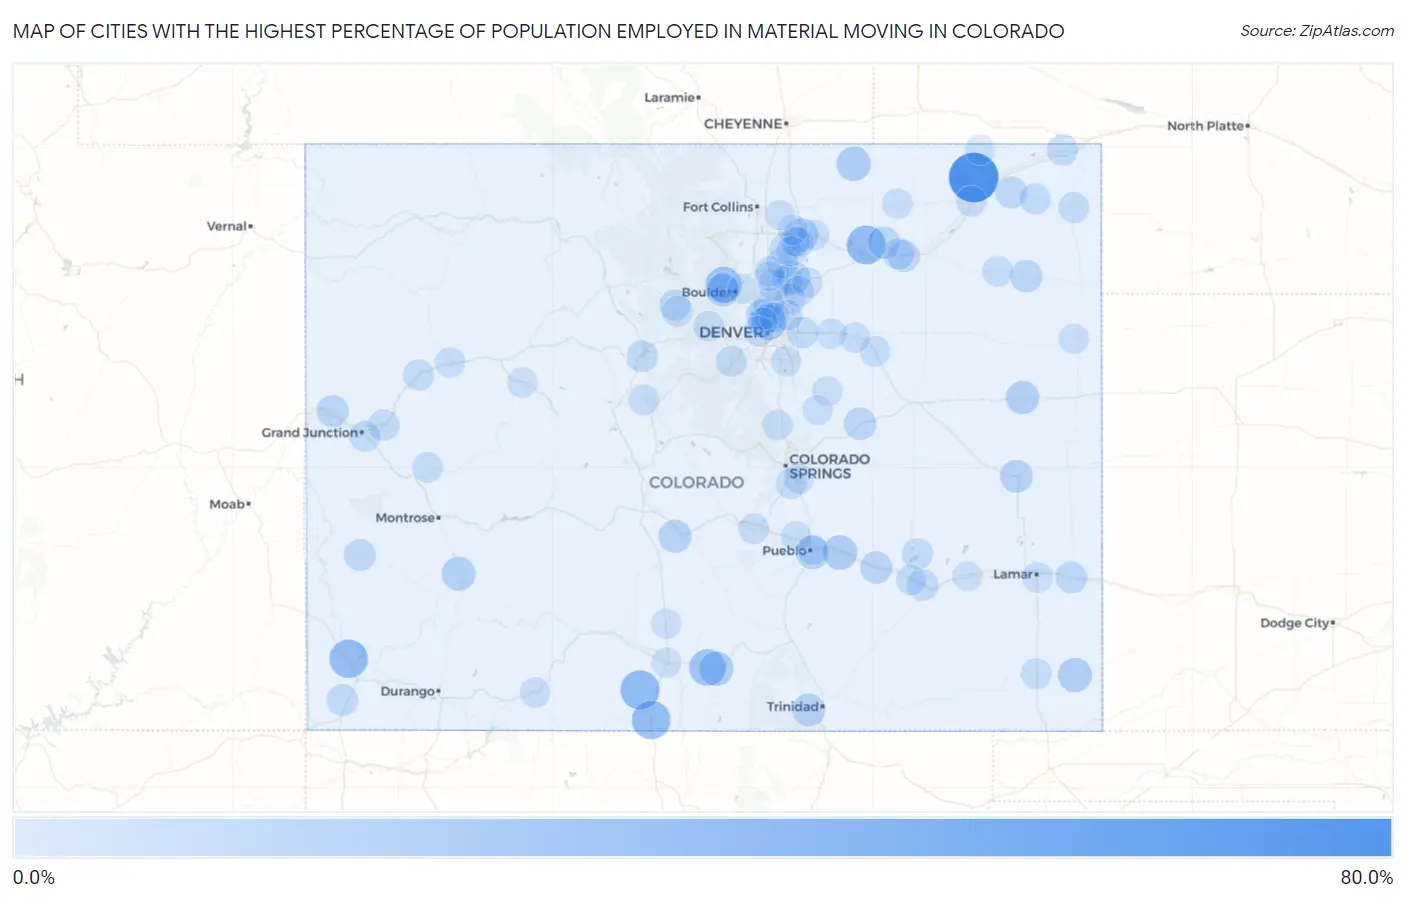
Map of Cities with the Highest Percentage of Population Employed in Material Moving in Colorado
0.0%
80.0%
Cities with the Highest Percentage of Population Employed in Material Moving in Colorado
| City | % Employed | vs State | vs National | |
| 1. | Padroni | 64.3% | 2.9%(+61.3)#1 | 3.8%(+60.5)#53 |
| 2. | Capulin | 31.7% | 2.9%(+28.8)#2 | 3.8%(+27.9)#271 |
| 3. | Orchard | 30.6% | 2.9%(+27.6)#3 | 3.8%(+26.7)#300 |
| 4. | Lewis | 29.5% | 2.9%(+26.6)#4 | 3.8%(+25.7)#317 |
| 5. | Antonito | 29.4% | 2.9%(+26.5)#5 | 3.8%(+25.6)#319 |
| 6. | Blanca | 24.0% | 2.9%(+21.1)#6 | 3.8%(+20.2)#489 |
| 7. | Sunshine | 23.4% | 2.9%(+20.5)#7 | 3.8%(+19.6)#514 |
| 8. | North Washington | 19.3% | 2.9%(+16.3)#8 | 3.8%(+15.4)#775 |
| 9. | Grover | 17.4% | 2.9%(+14.5)#9 | 3.8%(+13.6)#989 |
| 10. | Avondale | 17.2% | 2.9%(+14.3)#10 | 3.8%(+13.4)#1,010 |
| 11. | Fort Garland | 17.0% | 2.9%(+14.1)#11 | 3.8%(+13.2)#1,038 |
| 12. | Walsh | 16.1% | 2.9%(+13.2)#12 | 3.8%(+12.3)#1,168 |
| 13. | Portland | 15.7% | 2.9%(+12.7)#13 | 3.8%(+11.9)#1,247 |
| 14. | Garden City | 15.1% | 2.9%(+12.1)#14 | 3.8%(+11.2)#1,366 |
| 15. | Salt Creek | 14.7% | 2.9%(+11.8)#15 | 3.8%(+10.9)#1,443 |
| 16. | Vona | 14.1% | 2.9%(+11.2)#16 | 3.8%(+10.3)#1,576 |
| 17. | Coaldale | 13.4% | 2.9%(+10.4)#17 | 3.8%(+9.55)#1,790 |
| 18. | Kit Carson | 13.0% | 2.9%(+10.1)#18 | 3.8%(+9.21)#1,905 |
| 19. | Cokedale | 12.9% | 2.9%(+9.96)#19 | 3.8%(+9.07)#1,961 |
| 20. | Aristocrat Ranchettes | 12.7% | 2.9%(+9.72)#20 | 3.8%(+8.83)#2,040 |
| 21. | Mountain Meadows | 12.2% | 2.9%(+9.30)#21 | 3.8%(+8.41)#2,200 |
| 22. | Ramah | 11.8% | 2.9%(+8.82)#22 | 3.8%(+7.93)#2,392 |
| 23. | Yuma | 11.2% | 2.9%(+8.27)#23 | 3.8%(+7.38)#2,625 |
| 24. | Loma | 10.9% | 2.9%(+7.99)#24 | 3.8%(+7.10)#2,766 |
| 25. | Fowler | 10.7% | 2.9%(+7.77)#25 | 3.8%(+6.88)#2,861 |
| 26. | Weldona | 10.2% | 2.9%(+7.29)#26 | 3.8%(+6.40)#3,143 |
| 27. | Naturita | 9.9% | 2.9%(+6.96)#27 | 3.8%(+6.07)#3,368 |
| 28. | Fleming | 9.5% | 2.9%(+6.58)#28 | 3.8%(+5.69)#3,625 |
| 29. | Granada | 9.3% | 2.9%(+6.41)#29 | 3.8%(+5.52)#3,793 |
| 30. | Fort Morgan | 9.3% | 2.9%(+6.31)#30 | 3.8%(+5.42)#3,855 |
| 31. | Towaoc | 8.9% | 2.9%(+5.96)#31 | 3.8%(+5.07)#4,149 |
| 32. | Frisco | 8.8% | 2.9%(+5.90)#32 | 3.8%(+5.01)#4,198 |
| 33. | Dacono | 8.8% | 2.9%(+5.85)#33 | 3.8%(+4.96)#4,241 |
| 34. | Twin Lakes Cdp Adams County | 8.8% | 2.9%(+5.84)#34 | 3.8%(+4.95)#4,251 |
| 35. | Swink | 8.7% | 2.9%(+5.81)#35 | 3.8%(+4.92)#4,275 |
| 36. | Log Lane Village | 8.7% | 2.9%(+5.74)#36 | 3.8%(+4.85)#4,338 |
| 37. | Aetna Estates | 8.5% | 2.9%(+5.57)#37 | 3.8%(+4.68)#4,492 |
| 38. | Ovid | 8.3% | 2.9%(+5.39)#38 | 3.8%(+4.50)#4,670 |
| 39. | Palisade | 8.1% | 2.9%(+5.12)#39 | 3.8%(+4.23)#4,980 |
| 40. | Platteville | 7.9% | 2.9%(+5.00)#40 | 3.8%(+4.11)#5,102 |
| 41. | Parachute | 7.8% | 2.9%(+4.85)#41 | 3.8%(+3.96)#5,313 |
| 42. | Federal Heights | 7.7% | 2.9%(+4.78)#42 | 3.8%(+3.89)#5,396 |
| 43. | Milliken | 7.7% | 2.9%(+4.73)#43 | 3.8%(+3.84)#5,468 |
| 44. | Haxtun | 7.5% | 2.9%(+4.59)#44 | 3.8%(+3.70)#5,640 |
| 45. | Fraser | 7.4% | 2.9%(+4.49)#45 | 3.8%(+3.60)#5,770 |
| 46. | Orchard Mesa | 7.3% | 2.9%(+4.37)#46 | 3.8%(+3.48)#5,941 |
| 47. | Holyoke | 7.2% | 2.9%(+4.26)#47 | 3.8%(+3.37)#6,080 |
| 48. | Sugar City | 7.1% | 2.9%(+4.12)#48 | 3.8%(+3.23)#6,281 |
| 49. | Fort Lupton | 7.0% | 2.9%(+4.09)#49 | 3.8%(+3.20)#6,326 |
| 50. | Springfield | 6.8% | 2.9%(+3.91)#50 | 3.8%(+3.02)#6,618 |
| 51. | Alma | 6.8% | 2.9%(+3.84)#51 | 3.8%(+2.95)#6,721 |
| 52. | Deer Trail | 6.8% | 2.9%(+3.84)#52 | 3.8%(+2.95)#6,728 |
| 53. | Winter Park | 6.8% | 2.9%(+3.83)#53 | 3.8%(+2.94)#6,740 |
| 54. | Brighton | 6.7% | 2.9%(+3.77)#54 | 3.8%(+2.88)#6,837 |
| 55. | Shaw Heights | 6.6% | 2.9%(+3.63)#55 | 3.8%(+2.74)#7,074 |
| 56. | Sterling | 6.5% | 2.9%(+3.60)#56 | 3.8%(+2.71)#7,120 |
| 57. | Fort Carson | 6.4% | 2.9%(+3.50)#57 | 3.8%(+2.61)#7,265 |
| 58. | Otis | 6.4% | 2.9%(+3.50)#58 | 3.8%(+2.61)#7,275 |
| 59. | Florence | 6.3% | 2.9%(+3.36)#59 | 3.8%(+2.47)#7,501 |
| 60. | Aspen Park | 6.3% | 2.9%(+3.35)#60 | 3.8%(+2.46)#7,518 |
| 61. | Lochbuie | 6.2% | 2.9%(+3.27)#61 | 3.8%(+2.38)#7,647 |
| 62. | Orchard City | 6.1% | 2.9%(+3.14)#62 | 3.8%(+2.25)#7,884 |
| 63. | Crisman | 6.0% | 2.9%(+3.10)#63 | 3.8%(+2.21)#7,970 |
| 64. | Kersey | 6.0% | 2.9%(+3.09)#64 | 3.8%(+2.20)#7,996 |
| 65. | La Salle | 6.0% | 2.9%(+3.03)#65 | 3.8%(+2.14)#8,093 |
| 66. | Lamar | 5.9% | 2.9%(+3.00)#66 | 3.8%(+2.11)#8,166 |
| 67. | Central City | 5.7% | 2.9%(+2.81)#67 | 3.8%(+1.92)#8,541 |
| 68. | Northglenn | 5.7% | 2.9%(+2.80)#68 | 3.8%(+1.91)#8,565 |
| 69. | Rocky Ford | 5.7% | 2.9%(+2.77)#69 | 3.8%(+1.88)#8,628 |
| 70. | Pagosa Springs | 5.7% | 2.9%(+2.75)#70 | 3.8%(+1.86)#8,661 |
| 71. | Welby | 5.7% | 2.9%(+2.73)#71 | 3.8%(+1.84)#8,716 |
| 72. | Raymer New Raymer | 5.6% | 2.9%(+2.62)#72 | 3.8%(+1.73)#8,963 |
| 73. | Edgewater | 5.4% | 2.9%(+2.48)#73 | 3.8%(+1.59)#9,208 |
| 74. | Evans | 5.4% | 2.9%(+2.48)#74 | 3.8%(+1.59)#9,213 |
| 75. | Bennett | 5.4% | 2.9%(+2.46)#75 | 3.8%(+1.57)#9,244 |
| 76. | Hudson | 5.4% | 2.9%(+2.44)#76 | 3.8%(+1.55)#9,287 |
| 77. | Idalia | 5.4% | 2.9%(+2.42)#77 | 3.8%(+1.53)#9,357 |
| 78. | Commerce City | 5.3% | 2.9%(+2.39)#78 | 3.8%(+1.50)#9,400 |
| 79. | Byers | 5.3% | 2.9%(+2.38)#79 | 3.8%(+1.49)#9,444 |
| 80. | Derby | 5.3% | 2.9%(+2.34)#80 | 3.8%(+1.45)#9,521 |
| 81. | Rifle | 5.2% | 2.9%(+2.30)#81 | 3.8%(+1.41)#9,624 |
| 82. | Palmer Lake | 5.2% | 2.9%(+2.29)#82 | 3.8%(+1.40)#9,648 |
| 83. | Firestone | 5.2% | 2.9%(+2.23)#83 | 3.8%(+1.34)#9,791 |
| 84. | Grand View Estates | 5.1% | 2.9%(+2.15)#84 | 3.8%(+1.26)#9,956 |
| 85. | Greeley | 5.1% | 2.9%(+2.15)#85 | 3.8%(+1.26)#9,961 |
| 86. | Pueblo West | 5.1% | 2.9%(+2.12)#86 | 3.8%(+1.23)#10,031 |
| 87. | Catherine | 5.0% | 2.9%(+2.11)#87 | 3.8%(+1.22)#10,053 |
| 88. | Berkley | 4.9% | 2.9%(+1.91)#88 | 3.8%(+1.02)#10,510 |
| 89. | Severance | 4.8% | 2.9%(+1.84)#89 | 3.8%(+0.949)#10,697 |
| 90. | Gilcrest | 4.7% | 2.9%(+1.76)#90 | 3.8%(+0.865)#10,940 |
| 91. | Pueblo | 4.7% | 2.9%(+1.75)#91 | 3.8%(+0.858)#10,952 |
| 92. | Las Animas | 4.7% | 2.9%(+1.75)#92 | 3.8%(+0.857)#10,954 |
| 93. | Peetz | 4.7% | 2.9%(+1.75)#93 | 3.8%(+0.857)#10,961 |
| 94. | Alamosa | 4.7% | 2.9%(+1.74)#94 | 3.8%(+0.852)#10,975 |
| 95. | Kiowa | 4.7% | 2.9%(+1.71)#95 | 3.8%(+0.821)#11,060 |
| 96. | Hooper | 4.7% | 2.9%(+1.71)#96 | 3.8%(+0.821)#11,069 |
| 97. | Security Widefield | 4.6% | 2.9%(+1.69)#97 | 3.8%(+0.803)#11,108 |
| 98. | Elbert | 4.6% | 2.9%(+1.69)#98 | 3.8%(+0.799)#11,123 |
| 99. | Valmont | 4.6% | 2.9%(+1.68)#99 | 3.8%(+0.785)#11,167 |
| 100. | Frederick | 4.5% | 2.9%(+1.61)#100 | 3.8%(+0.719)#11,321 |
Common Questions
What are the Top 10 Cities with the Highest Percentage of Population Employed in Material Moving in Colorado?
Top 10 Cities with the Highest Percentage of Population Employed in Material Moving in Colorado are:
What city has the Highest Percentage of Population Employed in Material Moving in Colorado?
Padroni has the Highest Percentage of Population Employed in Material Moving in Colorado with 64.3%.
What is the Percentage of Population Employed in Material Moving in the State of Colorado?
Percentage of Population Employed in Material Moving in Colorado is 2.9%.
What is the Percentage of Population Employed in Material Moving in the United States?
Percentage of Population Employed in Material Moving in the United States is 3.8%.