Cities with the Highest Percentage of Population Employed in Material Moving in Virginia
RELATED REPORTS & OPTIONS
Material Moving
Virginia
Compare Cities
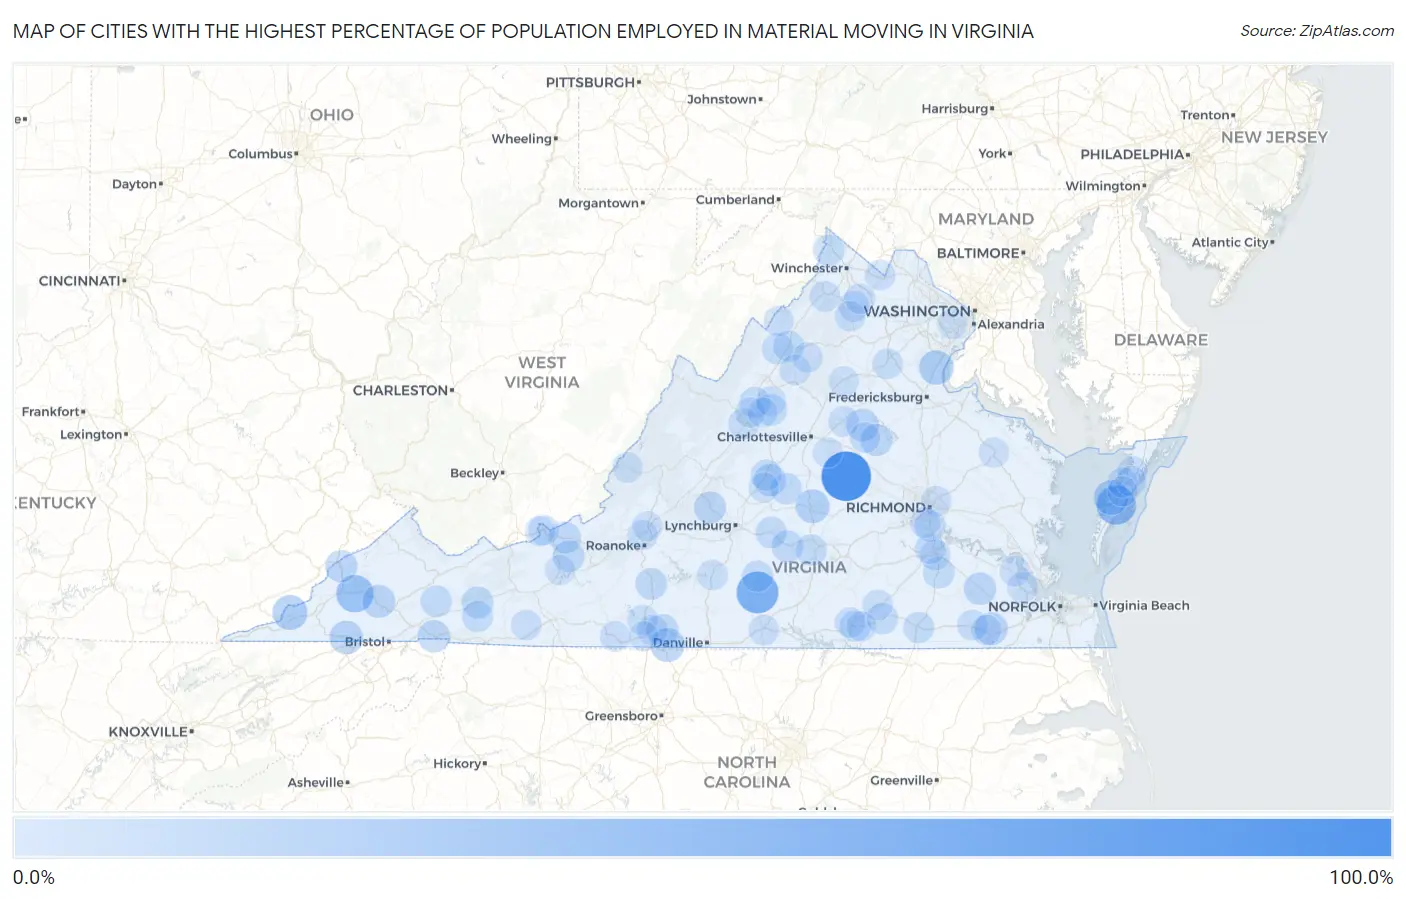
Map of Cities with the Highest Percentage of Population Employed in Material Moving in Virginia
0.0%
100.0%
Cities with the Highest Percentage of Population Employed in Material Moving in Virginia
| City | % Employed | vs State | vs National | |
| 1. | Columbia | 100.0% | 3.0%(+97.0)#1 | 3.8%(+96.2)#21 |
| 2. | Nathalie | 61.8% | 3.0%(+58.8)#2 | 3.8%(+58.0)#62 |
| 3. | Savage Town | 50.4% | 3.0%(+47.4)#3 | 3.8%(+46.6)#98 |
| 4. | Riverview | 40.3% | 3.0%(+37.2)#4 | 3.8%(+36.4)#161 |
| 5. | Mallow | 33.3% | 3.0%(+30.3)#5 | 3.8%(+29.5)#239 |
| 6. | St Charles | 28.6% | 3.0%(+25.5)#6 | 3.8%(+24.7)#336 |
| 7. | Boston | 27.9% | 3.0%(+24.9)#7 | 3.8%(+24.1)#353 |
| 8. | Boswell S Corner | 26.3% | 3.0%(+23.3)#8 | 3.8%(+22.5)#399 |
| 9. | Sandy Level | 24.0% | 3.0%(+21.0)#9 | 3.8%(+20.2)#488 |
| 10. | Dillwyn | 23.4% | 3.0%(+20.4)#10 | 3.8%(+19.6)#515 |
| 11. | Weber City | 21.4% | 3.0%(+18.4)#11 | 3.8%(+17.6)#631 |
| 12. | Castlewood | 19.1% | 3.0%(+16.1)#12 | 3.8%(+15.3)#788 |
| 13. | Camptown | 19.1% | 3.0%(+16.1)#13 | 3.8%(+15.3)#791 |
| 14. | Big Rock | 19.0% | 3.0%(+15.9)#14 | 3.8%(+15.1)#805 |
| 15. | Blue Ridge Shores | 17.6% | 3.0%(+14.6)#15 | 3.8%(+13.8)#954 |
| 16. | Wakefield | 16.9% | 3.0%(+13.9)#16 | 3.8%(+13.1)#1,053 |
| 17. | Mcgaheysville | 16.5% | 3.0%(+13.4)#17 | 3.8%(+12.7)#1,116 |
| 18. | Pound | 16.4% | 3.0%(+13.4)#18 | 3.8%(+12.6)#1,125 |
| 19. | Damascus | 16.3% | 3.0%(+13.3)#19 | 3.8%(+12.5)#1,145 |
| 20. | Shipman | 15.7% | 3.0%(+12.6)#20 | 3.8%(+11.9)#1,243 |
| 21. | Big Island | 15.4% | 3.0%(+12.3)#21 | 3.8%(+11.6)#1,303 |
| 22. | Baywood | 15.1% | 3.0%(+12.1)#22 | 3.8%(+11.3)#1,359 |
| 23. | Mineral | 15.0% | 3.0%(+12.0)#23 | 3.8%(+11.2)#1,371 |
| 24. | Chatmoss | 15.0% | 3.0%(+11.9)#24 | 3.8%(+11.1)#1,386 |
| 25. | Atkins | 14.0% | 3.0%(+11.0)#25 | 3.8%(+10.2)#1,603 |
| 26. | Pembroke | 14.0% | 3.0%(+11.0)#26 | 3.8%(+10.2)#1,609 |
| 27. | Rocky Mount | 13.8% | 3.0%(+10.8)#27 | 3.8%(+9.98)#1,664 |
| 28. | Pamplin City | 13.8% | 3.0%(+10.8)#28 | 3.8%(+9.96)#1,671 |
| 29. | Rose Hill Cdp Lee County | 13.7% | 3.0%(+10.7)#29 | 3.8%(+9.90)#1,688 |
| 30. | Belspring | 13.5% | 3.0%(+10.5)#30 | 3.8%(+9.71)#1,756 |
| 31. | Allison Gap | 13.5% | 3.0%(+10.4)#31 | 3.8%(+9.64)#1,772 |
| 32. | Appomattox | 13.3% | 3.0%(+10.3)#32 | 3.8%(+9.50)#1,801 |
| 33. | Singers Glen | 13.2% | 3.0%(+10.2)#33 | 3.8%(+9.41)#1,838 |
| 34. | Templeton | 13.1% | 3.0%(+10.1)#34 | 3.8%(+9.28)#1,886 |
| 35. | Harriston | 12.8% | 3.0%(+9.79)#35 | 3.8%(+9.00)#1,987 |
| 36. | Saltville | 12.3% | 3.0%(+9.29)#36 | 3.8%(+8.50)#2,167 |
| 37. | Yogaville | 12.3% | 3.0%(+9.27)#37 | 3.8%(+8.48)#2,175 |
| 38. | Brookneal | 11.9% | 3.0%(+8.83)#38 | 3.8%(+8.05)#2,337 |
| 39. | Hampden Sydney | 11.8% | 3.0%(+8.74)#39 | 3.8%(+7.95)#2,378 |
| 40. | Lake Holiday | 11.5% | 3.0%(+8.50)#40 | 3.8%(+7.71)#2,479 |
| 41. | Brucetown | 11.3% | 3.0%(+8.29)#41 | 3.8%(+7.50)#2,568 |
| 42. | Timberville | 11.3% | 3.0%(+8.21)#42 | 3.8%(+7.42)#2,606 |
| 43. | Sugar Grove | 11.2% | 3.0%(+8.18)#43 | 3.8%(+7.39)#2,617 |
| 44. | Bellwood | 11.2% | 3.0%(+8.17)#44 | 3.8%(+7.38)#2,627 |
| 45. | Lovingston | 11.1% | 3.0%(+8.07)#45 | 3.8%(+7.28)#2,674 |
| 46. | Emporia | 11.1% | 3.0%(+8.03)#46 | 3.8%(+7.25)#2,697 |
| 47. | La Crosse | 10.8% | 3.0%(+7.72)#47 | 3.8%(+6.93)#2,839 |
| 48. | New Market | 10.7% | 3.0%(+7.66)#48 | 3.8%(+6.87)#2,872 |
| 49. | Mount Sidney | 10.5% | 3.0%(+7.46)#49 | 3.8%(+6.67)#2,984 |
| 50. | Lawrenceville | 10.4% | 3.0%(+7.40)#50 | 3.8%(+6.61)#3,019 |
| 51. | Jolivue | 10.1% | 3.0%(+7.06)#51 | 3.8%(+6.28)#3,221 |
| 52. | Strasburg | 9.6% | 3.0%(+6.55)#52 | 3.8%(+5.76)#3,582 |
| 53. | Gordonsville | 9.4% | 3.0%(+6.41)#53 | 3.8%(+5.62)#3,706 |
| 54. | Petersburg | 9.4% | 3.0%(+6.34)#54 | 3.8%(+5.55)#3,760 |
| 55. | Remington | 9.1% | 3.0%(+6.09)#55 | 3.8%(+5.30)#3,964 |
| 56. | Apple Mountain Lake | 9.0% | 3.0%(+5.98)#56 | 3.8%(+5.19)#4,067 |
| 57. | Louisa | 8.8% | 3.0%(+5.78)#57 | 3.8%(+4.99)#4,209 |
| 58. | Courtland | 8.8% | 3.0%(+5.74)#58 | 3.8%(+4.95)#4,249 |
| 59. | Parksley | 8.5% | 3.0%(+5.45)#59 | 3.8%(+4.66)#4,507 |
| 60. | Fries | 8.5% | 3.0%(+5.45)#60 | 3.8%(+4.66)#4,511 |
| 61. | Patrick Springs | 8.4% | 3.0%(+5.41)#61 | 3.8%(+4.62)#4,558 |
| 62. | Stanleytown | 8.4% | 3.0%(+5.38)#62 | 3.8%(+4.59)#4,582 |
| 63. | Motley | 8.4% | 3.0%(+5.34)#63 | 3.8%(+4.55)#4,622 |
| 64. | Shenandoah Retreat | 8.4% | 3.0%(+5.34)#64 | 3.8%(+4.55)#4,627 |
| 65. | Basye | 8.3% | 3.0%(+5.24)#65 | 3.8%(+4.45)#4,729 |
| 66. | Chester Gap | 8.3% | 3.0%(+5.21)#66 | 3.8%(+4.42)#4,765 |
| 67. | East Highland Park | 8.2% | 3.0%(+5.19)#67 | 3.8%(+4.40)#4,787 |
| 68. | Martinsville | 8.2% | 3.0%(+5.17)#68 | 3.8%(+4.38)#4,811 |
| 69. | Shenandoah Farms | 8.1% | 3.0%(+5.08)#69 | 3.8%(+4.29)#4,911 |
| 70. | Smithfield | 8.1% | 3.0%(+5.06)#70 | 3.8%(+4.27)#4,939 |
| 71. | Rushmere | 8.1% | 3.0%(+5.04)#71 | 3.8%(+4.25)#4,957 |
| 72. | Shenandoah | 8.0% | 3.0%(+4.98)#72 | 3.8%(+4.19)#5,007 |
| 73. | Franklin | 7.9% | 3.0%(+4.90)#73 | 3.8%(+4.11)#5,105 |
| 74. | Ettrick | 7.9% | 3.0%(+4.90)#74 | 3.8%(+4.11)#5,109 |
| 75. | Port Republic | 7.9% | 3.0%(+4.89)#75 | 3.8%(+4.10)#5,129 |
| 76. | Meadowbrook | 7.9% | 3.0%(+4.88)#76 | 3.8%(+4.10)#5,130 |
| 77. | South Hill | 7.8% | 3.0%(+4.73)#77 | 3.8%(+3.94)#5,343 |
| 78. | Alberta | 7.7% | 3.0%(+4.65)#78 | 3.8%(+3.86)#5,430 |
| 79. | Rich Creek | 7.6% | 3.0%(+4.59)#79 | 3.8%(+3.80)#5,509 |
| 80. | Riverdale | 7.6% | 3.0%(+4.57)#80 | 3.8%(+3.79)#5,534 |
| 81. | Brightwood | 7.3% | 3.0%(+4.30)#81 | 3.8%(+3.51)#5,890 |
| 82. | Onancock | 7.3% | 3.0%(+4.28)#82 | 3.8%(+3.49)#5,925 |
| 83. | Accomac | 7.3% | 3.0%(+4.26)#83 | 3.8%(+3.47)#5,950 |
| 84. | Stanley | 7.3% | 3.0%(+4.24)#84 | 3.8%(+3.46)#5,975 |
| 85. | One Loudoun | 7.3% | 3.0%(+4.22)#85 | 3.8%(+3.43)#6,004 |
| 86. | Callaghan | 7.2% | 3.0%(+4.20)#86 | 3.8%(+3.42)#6,034 |
| 87. | Kings Park | 7.1% | 3.0%(+4.03)#87 | 3.8%(+3.24)#6,261 |
| 88. | Melfa | 7.0% | 3.0%(+3.99)#88 | 3.8%(+3.20)#6,337 |
| 89. | Hollins | 7.0% | 3.0%(+3.96)#89 | 3.8%(+3.17)#6,386 |
| 90. | Verona | 6.8% | 3.0%(+3.80)#90 | 3.8%(+3.01)#6,629 |
| 91. | Grottoes | 6.8% | 3.0%(+3.79)#91 | 3.8%(+3.00)#6,639 |
| 92. | Dublin | 6.8% | 3.0%(+3.76)#92 | 3.8%(+2.97)#6,690 |
| 93. | Brodnax | 6.7% | 3.0%(+3.66)#93 | 3.8%(+2.87)#6,864 |
| 94. | Glen Lyn | 6.7% | 3.0%(+3.62)#94 | 3.8%(+2.84)#6,931 |
| 95. | Horse Pasture | 6.6% | 3.0%(+3.55)#95 | 3.8%(+2.77)#7,034 |
| 96. | New Hope | 6.6% | 3.0%(+3.55)#96 | 3.8%(+2.76)#7,050 |
| 97. | Tappahannock | 6.6% | 3.0%(+3.51)#97 | 3.8%(+2.72)#7,100 |
| 98. | Daleville | 6.5% | 3.0%(+3.50)#98 | 3.8%(+2.71)#7,118 |
| 99. | Arrington | 6.5% | 3.0%(+3.49)#99 | 3.8%(+2.70)#7,129 |
| 100. | Lake Monticello | 6.4% | 3.0%(+3.39)#100 | 3.8%(+2.60)#7,277 |
Common Questions
What are the Top 10 Cities with the Highest Percentage of Population Employed in Material Moving in Virginia?
Top 10 Cities with the Highest Percentage of Population Employed in Material Moving in Virginia are:
#1
100.0%
#2
61.8%
#3
50.4%
#4
40.3%
#5
28.6%
#6
27.9%
#7
26.3%
#8
24.0%
#9
23.4%
#10
21.4%
What city has the Highest Percentage of Population Employed in Material Moving in Virginia?
Columbia has the Highest Percentage of Population Employed in Material Moving in Virginia with 100.0%.
What is the Percentage of Population Employed in Material Moving in the State of Virginia?
Percentage of Population Employed in Material Moving in Virginia is 3.0%.
What is the Percentage of Population Employed in Material Moving in the United States?
Percentage of Population Employed in Material Moving in the United States is 3.8%.