Cities with the Highest Percentage of Population Employed in Material Moving in Kentucky
RELATED REPORTS & OPTIONS
Material Moving
Kentucky
Compare Cities
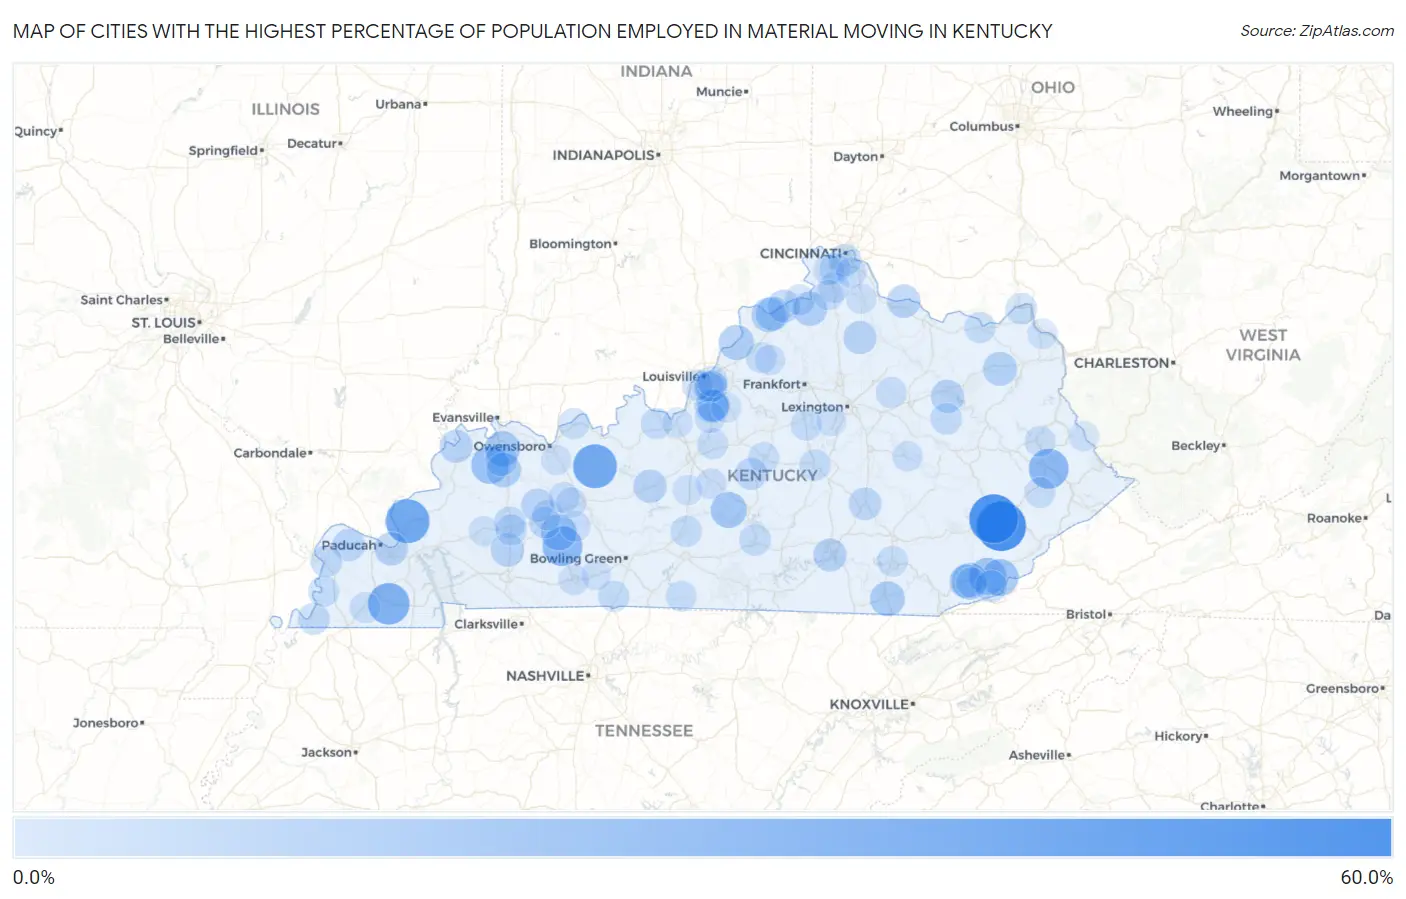
Map of Cities with the Highest Percentage of Population Employed in Material Moving in Kentucky
0.0%
60.0%
Cities with the Highest Percentage of Population Employed in Material Moving in Kentucky
| City | % Employed | vs State | vs National | |
| 1. | Jeff | 56.0% | 5.6%(+50.5)#1 | 3.8%(+52.2)#79 |
| 2. | Combs | 54.5% | 5.6%(+49.0)#2 | 3.8%(+50.7)#85 |
| 3. | Burna | 42.1% | 5.6%(+36.6)#3 | 3.8%(+38.3)#145 |
| 4. | Fordsville | 41.5% | 5.6%(+36.0)#4 | 3.8%(+37.7)#153 |
| 5. | Farmington | 36.2% | 5.6%(+30.6)#5 | 3.8%(+32.3)#201 |
| 6. | Allen | 31.5% | 5.6%(+25.9)#6 | 3.8%(+27.7)#278 |
| 7. | Dunmor | 31.4% | 5.6%(+25.8)#7 | 3.8%(+27.6)#280 |
| 8. | Poole | 26.3% | 5.6%(+20.8)#8 | 3.8%(+22.5)#397 |
| 9. | Coxton | 25.0% | 5.6%(+19.4)#9 | 3.8%(+21.2)#438 |
| 10. | Kenvir | 24.6% | 5.6%(+19.1)#10 | 3.8%(+20.8)#463 |
| 11. | Wallins Creek | 24.1% | 5.6%(+18.5)#11 | 3.8%(+20.3)#487 |
| 12. | Summersville | 22.6% | 5.6%(+17.0)#12 | 3.8%(+18.8)#559 |
| 13. | Beechmont | 22.3% | 5.6%(+16.7)#13 | 3.8%(+18.4)#577 |
| 14. | Anthoston | 20.7% | 5.6%(+15.2)#14 | 3.8%(+16.9)#672 |
| 15. | Westport | 20.0% | 5.6%(+14.4)#15 | 3.8%(+16.2)#723 |
| 16. | Emlyn | 19.6% | 5.6%(+14.0)#16 | 3.8%(+15.7)#756 |
| 17. | Sebree | 19.1% | 5.6%(+13.5)#17 | 3.8%(+15.3)#792 |
| 18. | Prestonville | 18.6% | 5.6%(+13.1)#18 | 3.8%(+14.8)#841 |
| 19. | Glencoe | 18.5% | 5.6%(+12.9)#19 | 3.8%(+14.7)#853 |
| 20. | Olive Hill | 17.7% | 5.6%(+12.1)#20 | 3.8%(+13.9)#940 |
| 21. | Pleasant Ridge | 17.6% | 5.6%(+12.0)#21 | 3.8%(+13.7)#961 |
| 22. | Carrollton | 17.2% | 5.6%(+11.7)#22 | 3.8%(+13.4)#1,008 |
| 23. | Coldiron | 16.6% | 5.6%(+11.0)#23 | 3.8%(+12.7)#1,110 |
| 24. | Ledbetter | 16.5% | 5.6%(+10.9)#24 | 3.8%(+12.7)#1,115 |
| 25. | Fox Chase | 16.3% | 5.6%(+10.7)#25 | 3.8%(+12.5)#1,146 |
| 26. | Augusta | 16.1% | 5.6%(+10.6)#26 | 3.8%(+12.3)#1,169 |
| 27. | Clarkson | 16.1% | 5.6%(+10.5)#27 | 3.8%(+12.2)#1,183 |
| 28. | Crofton | 16.0% | 5.6%(+10.5)#28 | 3.8%(+12.2)#1,188 |
| 29. | Burnside | 15.7% | 5.6%(+10.2)#29 | 3.8%(+11.9)#1,242 |
| 30. | Salt Lick | 15.6% | 5.6%(+10.1)#30 | 3.8%(+11.8)#1,253 |
| 31. | Berry | 15.5% | 5.6%(+9.96)#31 | 3.8%(+11.7)#1,275 |
| 32. | Uniontown | 15.3% | 5.6%(+9.78)#32 | 3.8%(+11.5)#1,317 |
| 33. | Ghent | 14.9% | 5.6%(+9.35)#33 | 3.8%(+11.1)#1,395 |
| 34. | Bremen | 14.8% | 5.6%(+9.26)#34 | 3.8%(+11.0)#1,416 |
| 35. | Kevil | 14.5% | 5.6%(+8.98)#35 | 3.8%(+10.7)#1,480 |
| 36. | Mount Vernon | 14.3% | 5.6%(+8.78)#36 | 3.8%(+10.5)#1,516 |
| 37. | Poplar Hills | 13.9% | 5.6%(+8.32)#37 | 3.8%(+10.0)#1,650 |
| 38. | Hillview | 13.5% | 5.6%(+7.94)#38 | 3.8%(+9.66)#1,768 |
| 39. | Hebron Estates | 13.3% | 5.6%(+7.79)#39 | 3.8%(+9.51)#1,799 |
| 40. | Van Lear | 13.3% | 5.6%(+7.78)#40 | 3.8%(+9.50)#1,806 |
| 41. | Yelvington | 13.3% | 5.6%(+7.75)#41 | 3.8%(+9.47)#1,826 |
| 42. | Robards | 13.2% | 5.6%(+7.68)#42 | 3.8%(+9.40)#1,841 |
| 43. | St Mary | 13.2% | 5.6%(+7.60)#43 | 3.8%(+9.33)#1,871 |
| 44. | Kenton Vale | 13.2% | 5.6%(+7.60)#44 | 3.8%(+9.33)#1,873 |
| 45. | Cawood | 12.8% | 5.6%(+7.29)#45 | 3.8%(+9.02)#1,982 |
| 46. | Mortons Gap | 12.4% | 5.6%(+6.85)#46 | 3.8%(+8.58)#2,142 |
| 47. | Wickliffe | 12.4% | 5.6%(+6.83)#47 | 3.8%(+8.55)#2,150 |
| 48. | Powderly | 12.3% | 5.6%(+6.78)#48 | 3.8%(+8.50)#2,162 |
| 49. | Watterson Park | 12.3% | 5.6%(+6.74)#49 | 3.8%(+8.46)#2,178 |
| 50. | Hickman | 12.3% | 5.6%(+6.73)#50 | 3.8%(+8.46)#2,186 |
| 51. | Frenchburg | 12.0% | 5.6%(+6.47)#51 | 3.8%(+8.20)#2,279 |
| 52. | Columbia | 11.9% | 5.6%(+6.33)#52 | 3.8%(+8.05)#2,334 |
| 53. | South Shore | 11.6% | 5.6%(+6.06)#53 | 3.8%(+7.78)#2,450 |
| 54. | Vanceburg | 11.3% | 5.6%(+5.77)#54 | 3.8%(+7.49)#2,574 |
| 55. | Salvisa | 11.3% | 5.6%(+5.77)#55 | 3.8%(+7.49)#2,577 |
| 56. | Nortonville | 11.3% | 5.6%(+5.74)#56 | 3.8%(+7.46)#2,588 |
| 57. | Danville | 11.2% | 5.6%(+5.62)#57 | 3.8%(+7.34)#2,644 |
| 58. | Horse Cave | 11.1% | 5.6%(+5.51)#58 | 3.8%(+7.24)#2,700 |
| 59. | Franklin | 11.0% | 5.6%(+5.41)#59 | 3.8%(+7.13)#2,747 |
| 60. | Warsaw | 10.9% | 5.6%(+5.30)#60 | 3.8%(+7.03)#2,799 |
| 61. | Ekron | 10.7% | 5.6%(+5.16)#61 | 3.8%(+6.88)#2,865 |
| 62. | Columbus | 10.7% | 5.6%(+5.11)#62 | 3.8%(+6.84)#2,893 |
| 63. | Elsmere | 10.6% | 5.6%(+5.05)#63 | 3.8%(+6.77)#2,925 |
| 64. | North Middletown | 10.5% | 5.6%(+4.97)#64 | 3.8%(+6.70)#2,965 |
| 65. | Wingo | 10.5% | 5.6%(+4.91)#65 | 3.8%(+6.64)#2,999 |
| 66. | Lewisport | 10.4% | 5.6%(+4.85)#66 | 3.8%(+6.58)#3,043 |
| 67. | Springfield | 10.4% | 5.6%(+4.83)#67 | 3.8%(+6.56)#3,051 |
| 68. | Paintsville | 10.4% | 5.6%(+4.82)#68 | 3.8%(+6.54)#3,062 |
| 69. | Boston | 10.3% | 5.6%(+4.75)#69 | 3.8%(+6.47)#3,103 |
| 70. | Lynnview | 10.2% | 5.6%(+4.64)#70 | 3.8%(+6.37)#3,156 |
| 71. | Wayland | 10.2% | 5.6%(+4.63)#71 | 3.8%(+6.35)#3,164 |
| 72. | Smithfield | 10.2% | 5.6%(+4.61)#72 | 3.8%(+6.34)#3,174 |
| 73. | North Corbin | 10.1% | 5.6%(+4.54)#73 | 3.8%(+6.27)#3,228 |
| 74. | Shepherdsville | 10.1% | 5.6%(+4.54)#74 | 3.8%(+6.26)#3,237 |
| 75. | Shively | 10.1% | 5.6%(+4.53)#75 | 3.8%(+6.26)#3,239 |
| 76. | Fountain Run | 10.1% | 5.6%(+4.52)#76 | 3.8%(+6.24)#3,248 |
| 77. | Walton | 10.1% | 5.6%(+4.50)#77 | 3.8%(+6.23)#3,255 |
| 78. | Central City | 10.0% | 5.6%(+4.47)#78 | 3.8%(+6.20)#3,273 |
| 79. | Strathmoor Village | 10.0% | 5.6%(+4.45)#79 | 3.8%(+6.17)#3,291 |
| 80. | Centertown | 10.0% | 5.6%(+4.45)#80 | 3.8%(+6.17)#3,292 |
| 81. | Rochester | 9.8% | 5.6%(+4.23)#81 | 3.8%(+5.95)#3,446 |
| 82. | Florence | 9.6% | 5.6%(+4.04)#82 | 3.8%(+5.76)#3,583 |
| 83. | Ryland Heights | 9.5% | 5.6%(+3.92)#83 | 3.8%(+5.64)#3,678 |
| 84. | Irvine | 9.4% | 5.6%(+3.84)#84 | 3.8%(+5.56)#3,758 |
| 85. | Mchenry | 9.3% | 5.6%(+3.76)#85 | 3.8%(+5.49)#3,810 |
| 86. | Russellville | 9.3% | 5.6%(+3.72)#86 | 3.8%(+5.45)#3,839 |
| 87. | Buffalo | 9.2% | 5.6%(+3.68)#87 | 3.8%(+5.40)#3,871 |
| 88. | Eminence | 9.1% | 5.6%(+3.54)#88 | 3.8%(+5.26)#3,990 |
| 89. | Verona | 9.0% | 5.6%(+3.49)#89 | 3.8%(+5.21)#4,042 |
| 90. | Masonville | 9.0% | 5.6%(+3.45)#90 | 3.8%(+5.18)#4,082 |
| 91. | Warfield | 9.0% | 5.6%(+3.42)#91 | 3.8%(+5.14)#4,098 |
| 92. | Wurtland | 9.0% | 5.6%(+3.42)#92 | 3.8%(+5.14)#4,102 |
| 93. | South Wallins | 9.0% | 5.6%(+3.40)#93 | 3.8%(+5.12)#4,115 |
| 94. | Muldraugh | 8.9% | 5.6%(+3.34)#94 | 3.8%(+5.06)#4,151 |
| 95. | Mount Washington | 8.9% | 5.6%(+3.33)#95 | 3.8%(+5.06)#4,157 |
| 96. | Butler | 8.8% | 5.6%(+3.21)#96 | 3.8%(+4.93)#4,266 |
| 97. | Auburn | 8.8% | 5.6%(+3.21)#97 | 3.8%(+4.93)#4,267 |
| 98. | Dawson Springs | 8.7% | 5.6%(+3.10)#98 | 3.8%(+4.82)#4,357 |
| 99. | Upton | 8.6% | 5.6%(+3.09)#99 | 3.8%(+4.81)#4,367 |
| 100. | Keene | 8.6% | 5.6%(+3.06)#100 | 3.8%(+4.78)#4,399 |
Common Questions
What are the Top 10 Cities with the Highest Percentage of Population Employed in Material Moving in Kentucky?
Top 10 Cities with the Highest Percentage of Population Employed in Material Moving in Kentucky are:
#1
56.0%
#2
54.5%
#3
42.1%
#4
41.5%
#5
36.2%
#6
31.5%
#7
31.4%
#8
26.3%
#9
25.0%
#10
24.6%
What city has the Highest Percentage of Population Employed in Material Moving in Kentucky?
Jeff has the Highest Percentage of Population Employed in Material Moving in Kentucky with 56.0%.
What is the Percentage of Population Employed in Material Moving in the State of Kentucky?
Percentage of Population Employed in Material Moving in Kentucky is 5.6%.
What is the Percentage of Population Employed in Material Moving in the United States?
Percentage of Population Employed in Material Moving in the United States is 3.8%.