Cities with the Highest Percentage of Population Employed in Material Moving in Tennessee
RELATED REPORTS & OPTIONS
Material Moving
Tennessee
Compare Cities
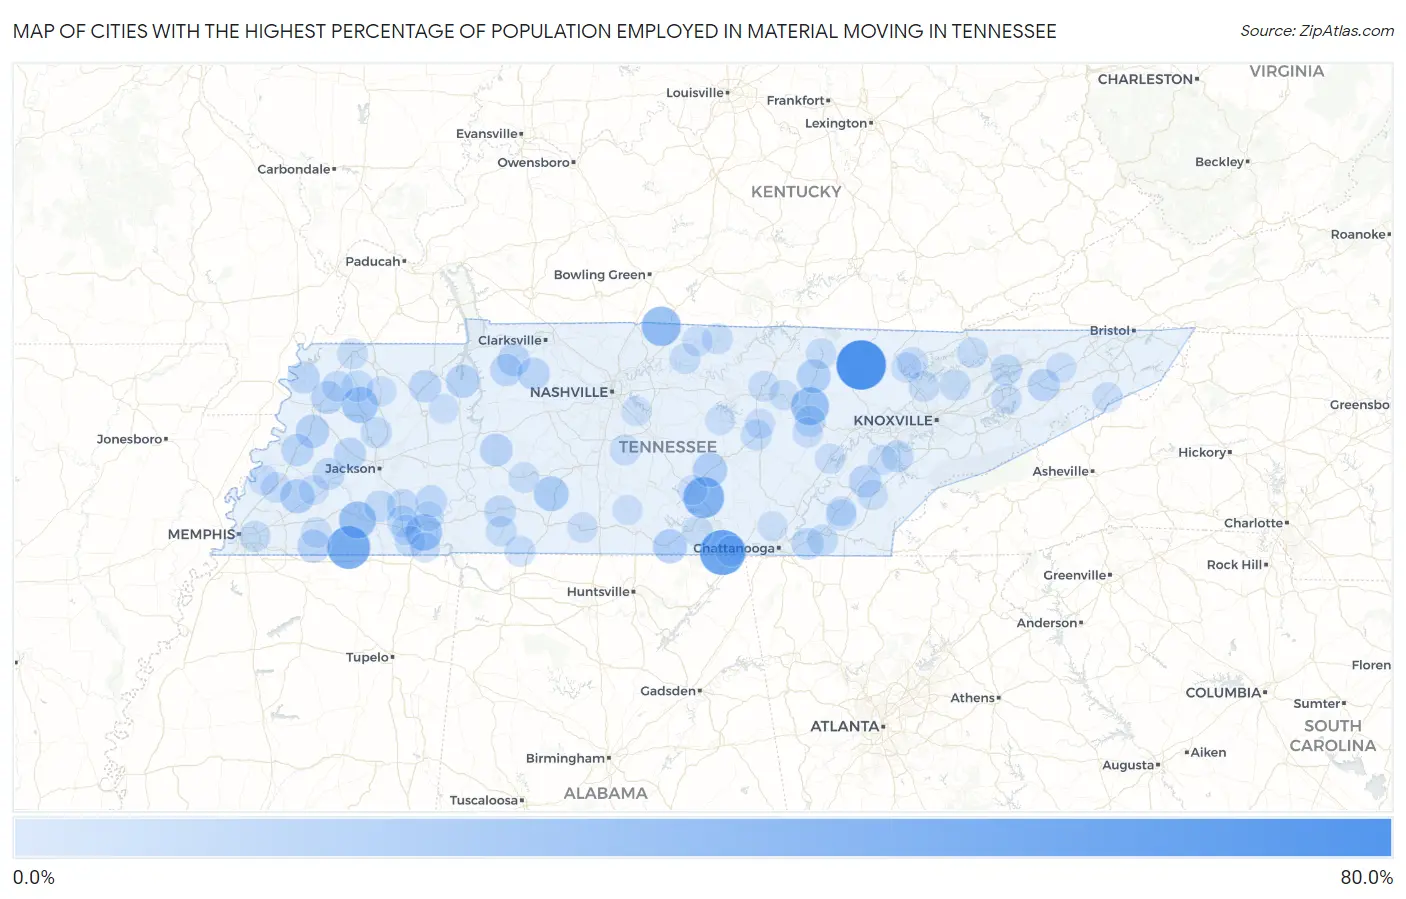
Map of Cities with the Highest Percentage of Population Employed in Material Moving in Tennessee
0.0%
80.0%
Cities with the Highest Percentage of Population Employed in Material Moving in Tennessee
| City | % Employed | vs State | vs National | |
| 1. | Robbins | 62.5% | 5.0%(+57.5)#1 | 3.8%(+58.7)#59 |
| 2. | Holladay | 58.1% | 5.0%(+53.1)#2 | 3.8%(+54.2)#74 |
| 3. | Orme | 50.0% | 5.0%(+45.0)#3 | 3.8%(+46.2)#103 |
| 4. | Saulsbury | 43.3% | 5.0%(+38.4)#4 | 3.8%(+39.5)#133 |
| 5. | Hillsboro | 37.7% | 5.0%(+32.8)#5 | 3.8%(+33.9)#186 |
| 6. | Conasauga | 36.7% | 5.0%(+31.7)#6 | 3.8%(+32.9)#195 |
| 7. | Yuma | 36.4% | 5.0%(+31.4)#7 | 3.8%(+32.5)#197 |
| 8. | Fairfield | 32.9% | 5.0%(+27.9)#8 | 3.8%(+29.0)#255 |
| 9. | Bowman | 29.3% | 5.0%(+24.3)#9 | 3.8%(+25.5)#322 |
| 10. | Bon Air | 28.5% | 5.0%(+23.5)#10 | 3.8%(+24.6)#342 |
| 11. | Bolivar | 26.9% | 5.0%(+22.0)#11 | 3.8%(+23.1)#381 |
| 12. | Stantonville | 25.8% | 5.0%(+20.8)#12 | 3.8%(+22.0)#415 |
| 13. | Dyer | 24.5% | 5.0%(+19.5)#13 | 3.8%(+20.6)#466 |
| 14. | Wildersville | 23.2% | 5.0%(+18.2)#14 | 3.8%(+19.4)#529 |
| 15. | Summertown | 21.2% | 5.0%(+16.2)#15 | 3.8%(+17.3)#645 |
| 16. | Mason | 19.4% | 5.0%(+14.5)#16 | 3.8%(+15.6)#764 |
| 17. | Morrison | 19.4% | 5.0%(+14.5)#17 | 3.8%(+15.6)#765 |
| 18. | Huntland | 18.8% | 5.0%(+13.8)#18 | 3.8%(+14.9)#818 |
| 19. | Grimsley | 18.4% | 5.0%(+13.4)#19 | 3.8%(+14.5)#866 |
| 20. | Strawberry Plains | 17.7% | 5.0%(+12.7)#20 | 3.8%(+13.9)#938 |
| 21. | Cosby | 16.9% | 5.0%(+12.0)#21 | 3.8%(+13.1)#1,045 |
| 22. | Halls | 16.7% | 5.0%(+11.8)#22 | 3.8%(+12.9)#1,068 |
| 23. | Big Sandy | 16.6% | 5.0%(+11.6)#23 | 3.8%(+12.8)#1,105 |
| 24. | Fowlkes | 16.2% | 5.0%(+11.3)#24 | 3.8%(+12.4)#1,155 |
| 25. | Kahite | 16.2% | 5.0%(+11.2)#25 | 3.8%(+12.4)#1,157 |
| 26. | Moscow | 15.7% | 5.0%(+10.8)#26 | 3.8%(+11.9)#1,236 |
| 27. | Newbern | 15.7% | 5.0%(+10.8)#27 | 3.8%(+11.9)#1,238 |
| 28. | Lobelville | 15.4% | 5.0%(+10.5)#28 | 3.8%(+11.6)#1,290 |
| 29. | Cumberland City | 14.4% | 5.0%(+9.44)#29 | 3.8%(+10.6)#1,501 |
| 30. | Ripley | 14.4% | 5.0%(+9.39)#30 | 3.8%(+10.5)#1,509 |
| 31. | Niota | 14.4% | 5.0%(+9.39)#31 | 3.8%(+10.5)#1,511 |
| 32. | Henry | 14.2% | 5.0%(+9.25)#32 | 3.8%(+10.4)#1,562 |
| 33. | Mosheim | 14.1% | 5.0%(+9.09)#33 | 3.8%(+10.2)#1,592 |
| 34. | Erin | 14.0% | 5.0%(+9.05)#34 | 3.8%(+10.2)#1,610 |
| 35. | Bells | 13.9% | 5.0%(+8.93)#35 | 3.8%(+10.1)#1,638 |
| 36. | Slayden | 13.5% | 5.0%(+8.53)#36 | 3.8%(+9.68)#1,763 |
| 37. | Ridgely | 13.5% | 5.0%(+8.49)#37 | 3.8%(+9.64)#1,776 |
| 38. | Sullivan Gardens | 13.3% | 5.0%(+8.32)#38 | 3.8%(+9.47)#1,824 |
| 39. | Mayland | 12.9% | 5.0%(+7.97)#39 | 3.8%(+9.12)#1,944 |
| 40. | Tellico Village | 12.9% | 5.0%(+7.89)#40 | 3.8%(+9.04)#1,973 |
| 41. | Brownsville | 12.8% | 5.0%(+7.79)#41 | 3.8%(+8.94)#2,009 |
| 42. | Finger | 12.6% | 5.0%(+7.60)#42 | 3.8%(+8.75)#2,072 |
| 43. | Waynesboro | 12.6% | 5.0%(+7.59)#43 | 3.8%(+8.74)#2,078 |
| 44. | Ooltewah | 12.5% | 5.0%(+7.52)#44 | 3.8%(+8.67)#2,096 |
| 45. | Milledgeville | 12.5% | 5.0%(+7.52)#45 | 3.8%(+8.67)#2,100 |
| 46. | Silerton | 12.2% | 5.0%(+7.22)#46 | 3.8%(+8.36)#2,225 |
| 47. | Kenton | 12.2% | 5.0%(+7.19)#47 | 3.8%(+8.33)#2,231 |
| 48. | Gibson | 11.9% | 5.0%(+6.97)#48 | 3.8%(+8.12)#2,309 |
| 49. | Bethel Springs | 11.8% | 5.0%(+6.83)#49 | 3.8%(+7.98)#2,366 |
| 50. | Bean Station | 11.3% | 5.0%(+6.35)#50 | 3.8%(+7.50)#2,567 |
| 51. | South Cleveland | 11.0% | 5.0%(+5.98)#51 | 3.8%(+7.13)#2,748 |
| 52. | Crossville | 10.9% | 5.0%(+5.92)#52 | 3.8%(+7.07)#2,782 |
| 53. | Charleston | 10.6% | 5.0%(+5.65)#53 | 3.8%(+6.80)#2,915 |
| 54. | Iron City | 10.6% | 5.0%(+5.63)#54 | 3.8%(+6.78)#2,922 |
| 55. | Memphis | 10.6% | 5.0%(+5.60)#55 | 3.8%(+6.75)#2,934 |
| 56. | Doyle | 10.6% | 5.0%(+5.57)#56 | 3.8%(+6.72)#2,955 |
| 57. | Trimble | 10.4% | 5.0%(+5.44)#57 | 3.8%(+6.59)#3,033 |
| 58. | Luttrell | 10.4% | 5.0%(+5.39)#58 | 3.8%(+6.54)#3,063 |
| 59. | La Follette | 10.3% | 5.0%(+5.30)#59 | 3.8%(+6.45)#3,118 |
| 60. | South Pittsburg | 10.3% | 5.0%(+5.29)#60 | 3.8%(+6.44)#3,122 |
| 61. | Red Boiling Springs | 10.2% | 5.0%(+5.26)#61 | 3.8%(+6.41)#3,135 |
| 62. | Algood | 10.2% | 5.0%(+5.25)#62 | 3.8%(+6.40)#3,140 |
| 63. | Eagleville | 10.2% | 5.0%(+5.22)#63 | 3.8%(+6.37)#3,146 |
| 64. | Andersonville | 10.2% | 5.0%(+5.18)#64 | 3.8%(+6.33)#3,185 |
| 65. | Union City | 10.2% | 5.0%(+5.17)#65 | 3.8%(+6.32)#3,189 |
| 66. | Hohenwald | 9.9% | 5.0%(+4.95)#66 | 3.8%(+6.10)#3,347 |
| 67. | Collinwood | 9.8% | 5.0%(+4.82)#67 | 3.8%(+5.97)#3,422 |
| 68. | New Tazewell | 9.8% | 5.0%(+4.80)#68 | 3.8%(+5.95)#3,448 |
| 69. | Eastview | 9.7% | 5.0%(+4.74)#69 | 3.8%(+5.89)#3,494 |
| 70. | Brighton | 9.7% | 5.0%(+4.69)#70 | 3.8%(+5.84)#3,526 |
| 71. | Jamestown | 9.7% | 5.0%(+4.69)#71 | 3.8%(+5.84)#3,530 |
| 72. | Cowan | 9.7% | 5.0%(+4.67)#72 | 3.8%(+5.82)#3,538 |
| 73. | Hartsville Trousdale County | 9.6% | 5.0%(+4.61)#73 | 3.8%(+5.76)#3,590 |
| 74. | Gilt Edge | 9.5% | 5.0%(+4.49)#74 | 3.8%(+5.64)#3,686 |
| 75. | Williston | 9.4% | 5.0%(+4.46)#75 | 3.8%(+5.61)#3,711 |
| 76. | Jacksboro | 9.4% | 5.0%(+4.39)#76 | 3.8%(+5.54)#3,780 |
| 77. | Lafayette | 9.4% | 5.0%(+4.39)#77 | 3.8%(+5.54)#3,781 |
| 78. | White Pine | 9.3% | 5.0%(+4.27)#78 | 3.8%(+5.42)#3,856 |
| 79. | Englewood | 9.2% | 5.0%(+4.27)#79 | 3.8%(+5.42)#3,862 |
| 80. | Spring City | 9.2% | 5.0%(+4.24)#80 | 3.8%(+5.39)#3,883 |
| 81. | Selmer | 9.1% | 5.0%(+4.11)#81 | 3.8%(+5.26)#3,988 |
| 82. | Finley | 9.0% | 5.0%(+4.06)#82 | 3.8%(+5.20)#4,053 |
| 83. | Greenfield | 8.9% | 5.0%(+3.91)#83 | 3.8%(+5.06)#4,159 |
| 84. | Pulaski | 8.9% | 5.0%(+3.89)#84 | 3.8%(+5.04)#4,168 |
| 85. | Banner Hill | 8.7% | 5.0%(+3.75)#85 | 3.8%(+4.90)#4,283 |
| 86. | Sparta | 8.7% | 5.0%(+3.72)#86 | 3.8%(+4.87)#4,309 |
| 87. | Lake Tansi | 8.7% | 5.0%(+3.68)#87 | 3.8%(+4.83)#4,349 |
| 88. | Michie | 8.6% | 5.0%(+3.66)#88 | 3.8%(+4.81)#4,375 |
| 89. | Smithville | 8.6% | 5.0%(+3.62)#89 | 3.8%(+4.77)#4,421 |
| 90. | Manchester | 8.4% | 5.0%(+3.43)#90 | 3.8%(+4.58)#4,599 |
| 91. | La Vergne | 8.4% | 5.0%(+3.42)#91 | 3.8%(+4.57)#4,603 |
| 92. | Baileyton | 8.4% | 5.0%(+3.40)#92 | 3.8%(+4.54)#4,631 |
| 93. | Monterey | 8.3% | 5.0%(+3.35)#93 | 3.8%(+4.50)#4,692 |
| 94. | Adamsville | 8.3% | 5.0%(+3.33)#94 | 3.8%(+4.48)#4,698 |
| 95. | Calhoun | 8.3% | 5.0%(+3.29)#95 | 3.8%(+4.44)#4,742 |
| 96. | Bruceton | 8.2% | 5.0%(+3.22)#96 | 3.8%(+4.37)#4,824 |
| 97. | Philadelphia | 8.2% | 5.0%(+3.20)#97 | 3.8%(+4.35)#4,842 |
| 98. | Lone Oak | 8.2% | 5.0%(+3.18)#98 | 3.8%(+4.33)#4,864 |
| 99. | Petersburg | 8.2% | 5.0%(+3.18)#99 | 3.8%(+4.32)#4,869 |
| 100. | Stanton | 8.2% | 5.0%(+3.17)#100 | 3.8%(+4.32)#4,873 |
Common Questions
What are the Top 10 Cities with the Highest Percentage of Population Employed in Material Moving in Tennessee?
Top 10 Cities with the Highest Percentage of Population Employed in Material Moving in Tennessee are:
#1
62.5%
#2
50.0%
#3
43.3%
#4
37.7%
#5
32.9%
#6
29.3%
#7
26.9%
#8
25.8%
#9
24.5%
#10
21.2%
What city has the Highest Percentage of Population Employed in Material Moving in Tennessee?
Robbins has the Highest Percentage of Population Employed in Material Moving in Tennessee with 62.5%.
What is the Percentage of Population Employed in Material Moving in the State of Tennessee?
Percentage of Population Employed in Material Moving in Tennessee is 5.0%.
What is the Percentage of Population Employed in Material Moving in the United States?
Percentage of Population Employed in Material Moving in the United States is 3.8%.