Cities with the Highest Percentage of Population Employed in Material Moving in Louisiana
RELATED REPORTS & OPTIONS
Material Moving
Louisiana
Compare Cities
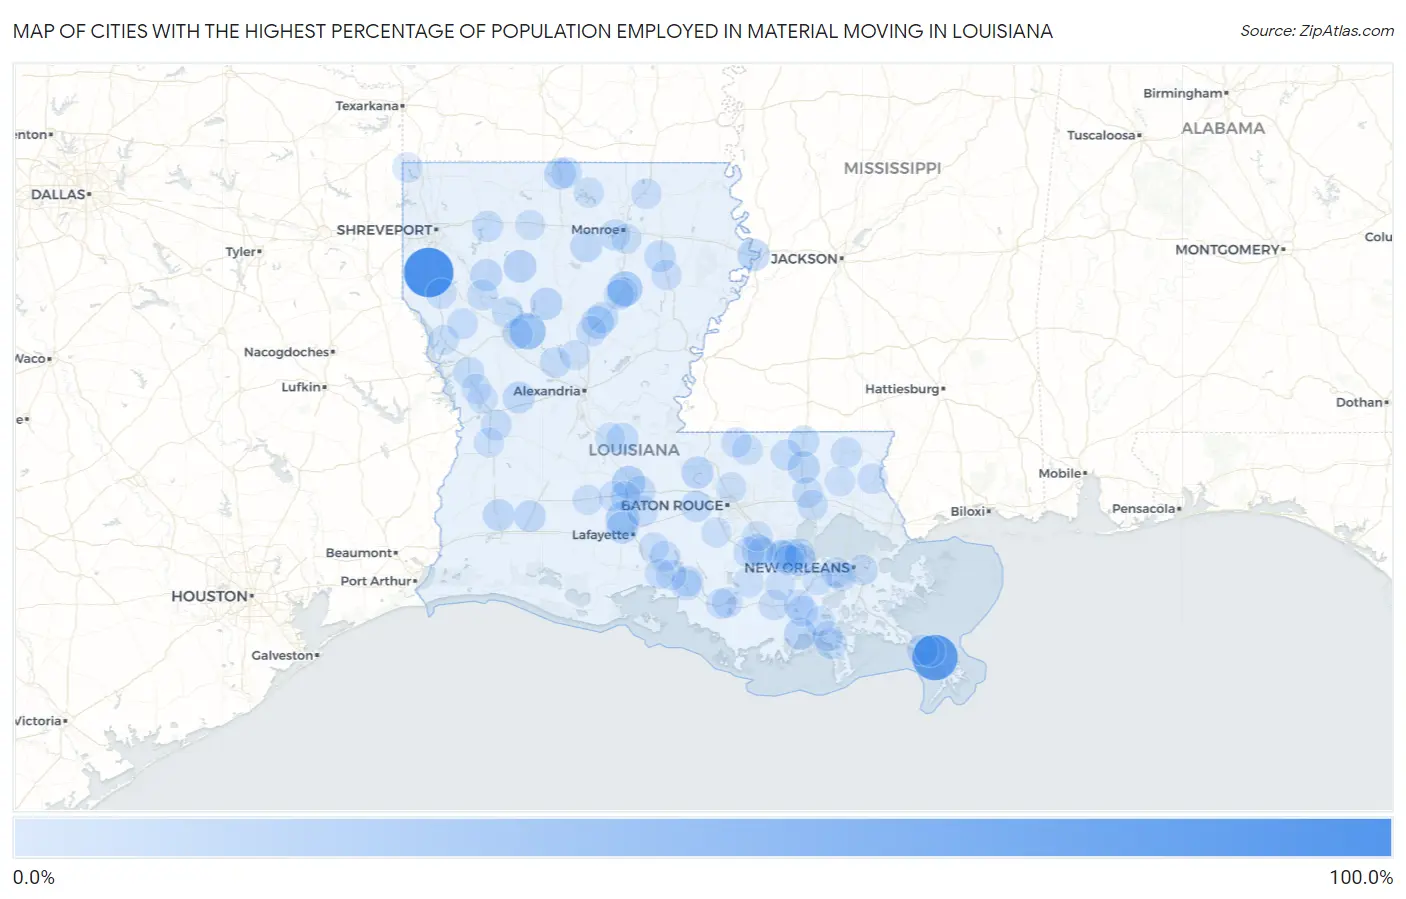
Map of Cities with the Highest Percentage of Population Employed in Material Moving in Louisiana
0.0%
100.0%
Cities with the Highest Percentage of Population Employed in Material Moving in Louisiana
| City | % Employed | vs State | vs National | |
| 1. | Gloster | 100.0% | 3.3%(+96.7)#1 | 3.8%(+96.2)#13 |
| 2. | Venice | 80.6% | 3.3%(+77.4)#2 | 3.8%(+76.8)#39 |
| 3. | St Maurice | 36.1% | 3.3%(+32.8)#3 | 3.8%(+32.3)#204 |
| 4. | Banks Springs | 27.7% | 3.3%(+24.5)#4 | 3.8%(+23.9)#362 |
| 5. | Cankton | 22.5% | 3.3%(+19.3)#5 | 3.8%(+18.7)#565 |
| 6. | Washington | 21.4% | 3.3%(+18.1)#6 | 3.8%(+17.6)#632 |
| 7. | Lucky | 19.0% | 3.3%(+15.8)#7 | 3.8%(+15.2)#798 |
| 8. | Midland | 18.6% | 3.3%(+15.3)#8 | 3.8%(+14.8)#843 |
| 9. | Tullos | 16.9% | 3.3%(+13.7)#9 | 3.8%(+13.1)#1,044 |
| 10. | Ossun | 16.7% | 3.3%(+13.4)#10 | 3.8%(+12.8)#1,069 |
| 11. | Delta | 16.7% | 3.3%(+13.4)#11 | 3.8%(+12.8)#1,082 |
| 12. | Amite City | 15.8% | 3.3%(+12.5)#12 | 3.8%(+11.9)#1,233 |
| 13. | Calvin | 15.7% | 3.3%(+12.4)#13 | 3.8%(+11.9)#1,245 |
| 14. | Montegut | 15.1% | 3.3%(+11.8)#14 | 3.8%(+11.3)#1,353 |
| 15. | New Roads | 15.1% | 3.3%(+11.8)#15 | 3.8%(+11.3)#1,358 |
| 16. | Edgard | 15.1% | 3.3%(+11.8)#16 | 3.8%(+11.2)#1,365 |
| 17. | Hall Summit | 14.8% | 3.3%(+11.5)#17 | 3.8%(+11.0)#1,423 |
| 18. | Gillis | 14.3% | 3.3%(+11.1)#18 | 3.8%(+10.5)#1,517 |
| 19. | Lemannville | 14.3% | 3.3%(+11.0)#19 | 3.8%(+10.5)#1,528 |
| 20. | Eros | 14.1% | 3.3%(+10.8)#20 | 3.8%(+10.3)#1,578 |
| 21. | Simpson | 14.0% | 3.3%(+10.7)#21 | 3.8%(+10.1)#1,625 |
| 22. | Fenton | 13.6% | 3.3%(+10.3)#22 | 3.8%(+9.73)#1,750 |
| 23. | Lillie | 13.4% | 3.3%(+10.2)#23 | 3.8%(+9.60)#1,785 |
| 24. | Evergreen | 13.3% | 3.3%(+10.1)#24 | 3.8%(+9.50)#1,807 |
| 25. | Urania | 13.0% | 3.3%(+9.68)#25 | 3.8%(+9.12)#1,941 |
| 26. | Mangham | 12.6% | 3.3%(+9.35)#26 | 3.8%(+8.79)#2,055 |
| 27. | Rosedale | 12.4% | 3.3%(+9.16)#27 | 3.8%(+8.60)#2,137 |
| 28. | Garyville | 12.3% | 3.3%(+9.08)#28 | 3.8%(+8.52)#2,156 |
| 29. | Gramercy | 11.7% | 3.3%(+8.47)#29 | 3.8%(+7.91)#2,406 |
| 30. | Kentwood | 11.4% | 3.3%(+8.15)#30 | 3.8%(+7.59)#2,532 |
| 31. | Campti | 11.3% | 3.3%(+8.07)#31 | 3.8%(+7.51)#2,563 |
| 32. | Greensburg | 11.0% | 3.3%(+7.78)#32 | 3.8%(+7.22)#2,709 |
| 33. | Triumph | 10.8% | 3.3%(+7.57)#33 | 3.8%(+7.01)#2,805 |
| 34. | Bawcomville | 10.8% | 3.3%(+7.53)#34 | 3.8%(+6.97)#2,825 |
| 35. | Golden Meadow | 10.8% | 3.3%(+7.50)#35 | 3.8%(+6.94)#2,838 |
| 36. | Florien | 10.7% | 3.3%(+7.44)#36 | 3.8%(+6.88)#2,863 |
| 37. | Boothville | 10.4% | 3.3%(+7.17)#37 | 3.8%(+6.61)#3,020 |
| 38. | Sibley | 10.3% | 3.3%(+7.07)#38 | 3.8%(+6.51)#3,079 |
| 39. | Franklinton | 10.2% | 3.3%(+6.98)#39 | 3.8%(+6.42)#3,134 |
| 40. | Perry | 10.1% | 3.3%(+6.85)#40 | 3.8%(+6.29)#3,209 |
| 41. | Coushatta | 10.1% | 3.3%(+6.79)#41 | 3.8%(+6.23)#3,253 |
| 42. | Baldwin | 9.9% | 3.3%(+6.63)#42 | 3.8%(+6.07)#3,363 |
| 43. | Colfax | 9.9% | 3.3%(+6.62)#43 | 3.8%(+6.06)#3,375 |
| 44. | Arnaudville | 9.9% | 3.3%(+6.59)#44 | 3.8%(+6.03)#3,392 |
| 45. | Donaldsonville | 9.8% | 3.3%(+6.49)#45 | 3.8%(+5.93)#3,460 |
| 46. | Spearsville | 9.7% | 3.3%(+6.44)#46 | 3.8%(+5.88)#3,502 |
| 47. | Lutcher | 9.7% | 3.3%(+6.40)#47 | 3.8%(+5.84)#3,528 |
| 48. | Fort Polk South | 9.5% | 3.3%(+6.26)#48 | 3.8%(+5.70)#3,617 |
| 49. | Union | 9.3% | 3.3%(+6.04)#49 | 3.8%(+5.48)#3,814 |
| 50. | Pleasant Hill | 9.3% | 3.3%(+6.02)#50 | 3.8%(+5.46)#3,830 |
| 51. | Port Barre | 9.3% | 3.3%(+6.00)#51 | 3.8%(+5.44)#3,843 |
| 52. | Grayson | 9.2% | 3.3%(+5.96)#52 | 3.8%(+5.40)#3,870 |
| 53. | Natalbany | 9.2% | 3.3%(+5.95)#53 | 3.8%(+5.39)#3,879 |
| 54. | Vienna Bend | 9.2% | 3.3%(+5.95)#54 | 3.8%(+5.39)#3,884 |
| 55. | Reserve | 9.2% | 3.3%(+5.91)#55 | 3.8%(+5.35)#3,922 |
| 56. | Charenton | 9.0% | 3.3%(+5.74)#56 | 3.8%(+5.18)#4,076 |
| 57. | Wallace | 9.0% | 3.3%(+5.71)#57 | 3.8%(+5.15)#4,095 |
| 58. | Arabi | 8.9% | 3.3%(+5.61)#58 | 3.8%(+5.05)#4,160 |
| 59. | Waggaman | 8.9% | 3.3%(+5.61)#59 | 3.8%(+5.05)#4,162 |
| 60. | Lockport | 8.8% | 3.3%(+5.58)#60 | 3.8%(+5.02)#4,194 |
| 61. | Ponchatoula | 8.6% | 3.3%(+5.28)#61 | 3.8%(+4.72)#4,460 |
| 62. | Jeanerette | 8.5% | 3.3%(+5.19)#62 | 3.8%(+4.63)#4,536 |
| 63. | Morgan City | 8.3% | 3.3%(+5.01)#63 | 3.8%(+4.45)#4,735 |
| 64. | Winnsboro | 8.2% | 3.3%(+4.94)#64 | 3.8%(+4.38)#4,807 |
| 65. | Gray | 8.2% | 3.3%(+4.88)#65 | 3.8%(+4.32)#4,871 |
| 66. | Loreauville | 8.1% | 3.3%(+4.87)#66 | 3.8%(+4.31)#4,880 |
| 67. | Mathews | 8.1% | 3.3%(+4.84)#67 | 3.8%(+4.28)#4,918 |
| 68. | Clinton | 8.0% | 3.3%(+4.76)#68 | 3.8%(+4.20)#4,998 |
| 69. | Lawtell | 7.9% | 3.3%(+4.65)#69 | 3.8%(+4.09)#5,146 |
| 70. | Bastrop | 7.9% | 3.3%(+4.60)#70 | 3.8%(+4.04)#5,197 |
| 71. | Wilson | 7.9% | 3.3%(+4.59)#71 | 3.8%(+4.03)#5,211 |
| 72. | Mansfield | 7.8% | 3.3%(+4.54)#72 | 3.8%(+3.98)#5,298 |
| 73. | Georgetown | 7.8% | 3.3%(+4.51)#73 | 3.8%(+3.95)#5,333 |
| 74. | Berwick | 7.7% | 3.3%(+4.44)#74 | 3.8%(+3.88)#5,405 |
| 75. | Avondale | 7.4% | 3.3%(+4.14)#75 | 3.8%(+3.58)#5,789 |
| 76. | Clarks | 7.4% | 3.3%(+4.14)#76 | 3.8%(+3.58)#5,794 |
| 77. | Sun | 7.3% | 3.3%(+4.08)#77 | 3.8%(+3.52)#5,877 |
| 78. | Noble | 7.3% | 3.3%(+4.03)#78 | 3.8%(+3.47)#5,957 |
| 79. | St Martinville | 7.2% | 3.3%(+3.92)#79 | 3.8%(+3.36)#6,099 |
| 80. | Lydia | 7.2% | 3.3%(+3.92)#80 | 3.8%(+3.36)#6,108 |
| 81. | Anacoco | 7.1% | 3.3%(+3.86)#81 | 3.8%(+3.30)#6,200 |
| 82. | Boutte | 7.1% | 3.3%(+3.78)#82 | 3.8%(+3.22)#6,285 |
| 83. | Farmerville | 7.0% | 3.3%(+3.75)#83 | 3.8%(+3.19)#6,350 |
| 84. | Folsom | 6.9% | 3.3%(+3.66)#84 | 3.8%(+3.10)#6,486 |
| 85. | Supreme | 6.9% | 3.3%(+3.66)#85 | 3.8%(+3.10)#6,500 |
| 86. | Opelousas | 6.9% | 3.3%(+3.64)#86 | 3.8%(+3.08)#6,515 |
| 87. | Arcadia | 6.8% | 3.3%(+3.56)#87 | 3.8%(+3.00)#6,647 |
| 88. | Galliano | 6.7% | 3.3%(+3.48)#88 | 3.8%(+2.92)#6,771 |
| 89. | Rodessa | 6.7% | 3.3%(+3.40)#89 | 3.8%(+2.84)#6,924 |
| 90. | Gonzales | 6.7% | 3.3%(+3.40)#90 | 3.8%(+2.84)#6,939 |
| 91. | Eunice | 6.7% | 3.3%(+3.38)#91 | 3.8%(+2.82)#6,948 |
| 92. | Crescent | 6.6% | 3.3%(+3.38)#92 | 3.8%(+2.82)#6,958 |
| 93. | Richwood | 6.6% | 3.3%(+3.32)#93 | 3.8%(+2.76)#7,038 |
| 94. | Choctaw | 6.5% | 3.3%(+3.21)#94 | 3.8%(+2.65)#7,201 |
| 95. | Bunkie | 6.5% | 3.3%(+3.19)#95 | 3.8%(+2.63)#7,228 |
| 96. | Hornbeck | 6.4% | 3.3%(+3.15)#96 | 3.8%(+2.59)#7,296 |
| 97. | Dry Prong | 6.4% | 3.3%(+3.15)#97 | 3.8%(+2.59)#7,297 |
| 98. | Larose | 6.4% | 3.3%(+3.15)#98 | 3.8%(+2.59)#7,312 |
| 99. | Baker | 6.4% | 3.3%(+3.11)#99 | 3.8%(+2.55)#7,365 |
| 100. | Rosepine | 6.4% | 3.3%(+3.08)#100 | 3.8%(+2.52)#7,424 |
Common Questions
What are the Top 10 Cities with the Highest Percentage of Population Employed in Material Moving in Louisiana?
Top 10 Cities with the Highest Percentage of Population Employed in Material Moving in Louisiana are:
#1
100.0%
#2
80.6%
#3
36.1%
#4
27.7%
#5
22.5%
#6
21.4%
#7
19.0%
#8
16.9%
#9
16.7%
#10
16.7%
What city has the Highest Percentage of Population Employed in Material Moving in Louisiana?
Gloster has the Highest Percentage of Population Employed in Material Moving in Louisiana with 100.0%.
What is the Percentage of Population Employed in Material Moving in the State of Louisiana?
Percentage of Population Employed in Material Moving in Louisiana is 3.3%.
What is the Percentage of Population Employed in Material Moving in the United States?
Percentage of Population Employed in Material Moving in the United States is 3.8%.