Cities with the Highest Percentage of Population Employed in Material Moving in Montana
RELATED REPORTS & OPTIONS
Material Moving
Montana
Compare Cities
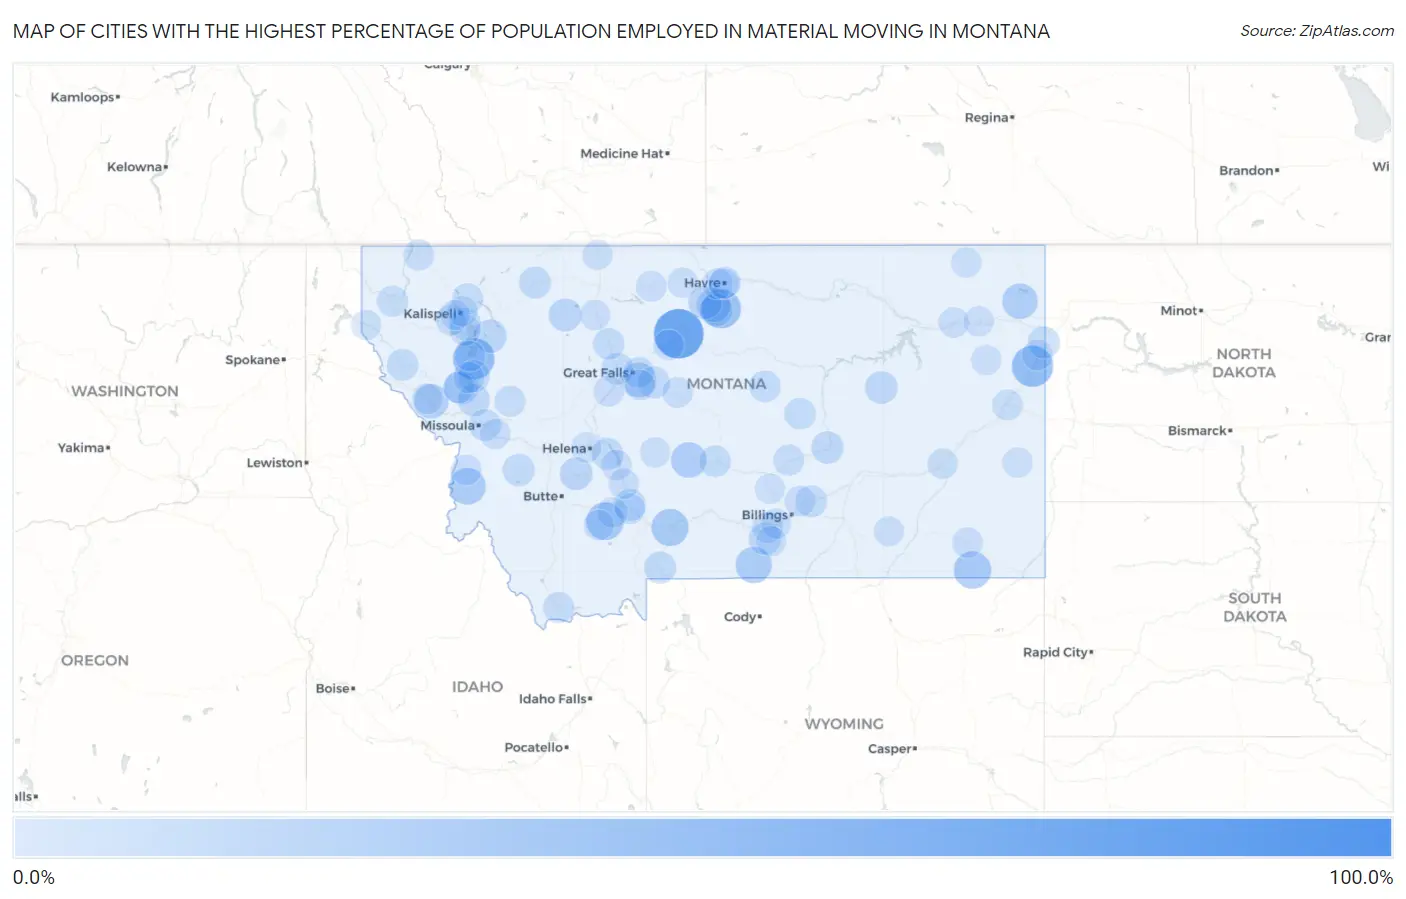
Map of Cities with the Highest Percentage of Population Employed in Material Moving in Montana
0.0%
100.0%
Cities with the Highest Percentage of Population Employed in Material Moving in Montana
| City | % Employed | vs State | vs National | |
| 1. | Goldcreek | 100.0% | 3.2%(+96.8)#1 | 3.8%(+96.2)#31 |
| 2. | Pendroy | 85.7% | 3.2%(+82.6)#2 | 3.8%(+81.9)#35 |
| 3. | Loma | 75.0% | 3.2%(+71.8)#3 | 3.8%(+71.2)#44 |
| 4. | Turtle Lake | 45.5% | 3.2%(+42.3)#4 | 3.8%(+41.6)#119 |
| 5. | Crane | 44.4% | 3.2%(+41.3)#5 | 3.8%(+40.6)#127 |
| 6. | Hillside Colony | 42.6% | 3.2%(+39.5)#6 | 3.8%(+38.8)#140 |
| 7. | Helmville | 38.9% | 3.2%(+35.7)#7 | 3.8%(+35.1)#177 |
| 8. | Parker School | 37.5% | 3.2%(+34.3)#8 | 3.8%(+33.7)#189 |
| 9. | Nibbe | 34.3% | 3.2%(+31.1)#9 | 3.8%(+30.5)#229 |
| 10. | Harrison | 31.4% | 3.2%(+28.3)#10 | 3.8%(+27.6)#279 |
| 11. | Biddle | 30.0% | 3.2%(+26.8)#11 | 3.8%(+26.2)#309 |
| 12. | Wineglass | 29.3% | 3.2%(+26.1)#12 | 3.8%(+25.5)#324 |
| 13. | Charlos Heights | 27.6% | 3.2%(+24.4)#13 | 3.8%(+23.8)#367 |
| 14. | Bearcreek | 26.4% | 3.2%(+23.3)#14 | 3.8%(+22.6)#395 |
| 15. | Essex | 24.1% | 3.2%(+21.0)#15 | 3.8%(+20.3)#484 |
| 16. | Froid | 23.4% | 3.2%(+20.2)#16 | 3.8%(+19.5)#518 |
| 17. | Martinsdale | 23.3% | 3.2%(+20.2)#17 | 3.8%(+19.5)#523 |
| 18. | Sand Coulee | 21.3% | 3.2%(+18.1)#18 | 3.8%(+17.4)#639 |
| 19. | Riverbend | 20.2% | 3.2%(+17.0)#19 | 3.8%(+16.4)#713 |
| 20. | Boneau | 18.6% | 3.2%(+15.5)#20 | 3.8%(+14.8)#836 |
| 21. | Old Agency | 17.4% | 3.2%(+14.2)#21 | 3.8%(+13.6)#990 |
| 22. | Lindsay | 16.7% | 3.2%(+13.5)#22 | 3.8%(+12.8)#1,100 |
| 23. | Box Elder | 15.8% | 3.2%(+12.6)#23 | 3.8%(+12.0)#1,230 |
| 24. | Swan Lake | 15.6% | 3.2%(+12.5)#24 | 3.8%(+11.8)#1,254 |
| 25. | St Pierre | 15.0% | 3.2%(+11.8)#25 | 3.8%(+11.2)#1,378 |
| 26. | Dupuyer | 14.0% | 3.2%(+10.8)#26 | 3.8%(+10.2)#1,614 |
| 27. | Basin | 13.7% | 3.2%(+10.5)#27 | 3.8%(+9.85)#1,706 |
| 28. | Jordan | 13.0% | 3.2%(+9.88)#28 | 3.8%(+9.21)#1,903 |
| 29. | Joliet | 12.9% | 3.2%(+9.74)#29 | 3.8%(+9.07)#1,957 |
| 30. | Melstone | 12.2% | 3.2%(+9.03)#30 | 3.8%(+8.36)#2,226 |
| 31. | Arlee | 11.9% | 3.2%(+8.72)#31 | 3.8%(+8.06)#2,331 |
| 32. | Belt | 11.6% | 3.2%(+8.42)#32 | 3.8%(+7.75)#2,469 |
| 33. | Philipsburg | 11.5% | 3.2%(+8.30)#33 | 3.8%(+7.63)#2,512 |
| 34. | Fairview | 11.4% | 3.2%(+8.28)#34 | 3.8%(+7.62)#2,517 |
| 35. | Kicking Horse | 11.4% | 3.2%(+8.23)#35 | 3.8%(+7.56)#2,542 |
| 36. | Corwin Springs | 11.0% | 3.2%(+7.85)#36 | 3.8%(+7.19)#2,721 |
| 37. | Browning | 11.0% | 3.2%(+7.84)#37 | 3.8%(+7.17)#2,727 |
| 38. | Spokane Creek | 10.9% | 3.2%(+7.76)#38 | 3.8%(+7.09)#2,768 |
| 39. | Gallatin River Ranch | 10.9% | 3.2%(+7.75)#39 | 3.8%(+7.08)#2,775 |
| 40. | Somers | 10.5% | 3.2%(+7.32)#40 | 3.8%(+6.65)#2,994 |
| 41. | Vaughn | 10.4% | 3.2%(+7.24)#41 | 3.8%(+6.57)#3,044 |
| 42. | Ballantine | 10.1% | 3.2%(+6.94)#42 | 3.8%(+6.27)#3,224 |
| 43. | Thompson Falls | 10.0% | 3.2%(+6.85)#43 | 3.8%(+6.18)#3,276 |
| 44. | Bonner West Riverside | 10.0% | 3.2%(+6.80)#44 | 3.8%(+6.13)#3,328 |
| 45. | Harlowton | 9.8% | 3.2%(+6.61)#45 | 3.8%(+5.95)#3,451 |
| 46. | Dutton | 9.7% | 3.2%(+6.51)#46 | 3.8%(+5.85)#3,524 |
| 47. | Havre North | 9.4% | 3.2%(+6.24)#47 | 3.8%(+5.57)#3,751 |
| 48. | Roy | 9.2% | 3.2%(+6.03)#48 | 3.8%(+5.37)#3,898 |
| 49. | Winnett | 9.2% | 3.2%(+6.02)#49 | 3.8%(+5.35)#3,910 |
| 50. | Dixon | 8.8% | 3.2%(+5.66)#50 | 3.8%(+4.99)#4,215 |
| 51. | Park City | 8.5% | 3.2%(+5.30)#51 | 3.8%(+4.64)#4,530 |
| 52. | Lakeside | 8.2% | 3.2%(+5.04)#52 | 3.8%(+4.38)#4,820 |
| 53. | Lima | 8.1% | 3.2%(+4.94)#53 | 3.8%(+4.28)#4,926 |
| 54. | White Haven | 7.9% | 3.2%(+4.77)#54 | 3.8%(+4.10)#5,124 |
| 55. | Columbia Falls | 7.7% | 3.2%(+4.52)#55 | 3.8%(+3.85)#5,459 |
| 56. | Charlo | 7.6% | 3.2%(+4.48)#56 | 3.8%(+3.82)#5,494 |
| 57. | Roundup | 7.6% | 3.2%(+4.42)#57 | 3.8%(+3.76)#5,570 |
| 58. | Seeley Lake | 7.5% | 3.2%(+4.36)#58 | 3.8%(+3.70)#5,647 |
| 59. | Malmstrom Afb | 7.5% | 3.2%(+4.35)#59 | 3.8%(+3.69)#5,659 |
| 60. | St. Mary | 7.4% | 3.2%(+4.24)#60 | 3.8%(+3.58)#5,805 |
| 61. | Kila | 7.4% | 3.2%(+4.19)#61 | 3.8%(+3.52)#5,872 |
| 62. | Shepherd | 7.0% | 3.2%(+3.88)#62 | 3.8%(+3.22)#6,300 |
| 63. | Eureka | 7.0% | 3.2%(+3.87)#63 | 3.8%(+3.20)#6,328 |
| 64. | Cascade | 7.0% | 3.2%(+3.85)#64 | 3.8%(+3.19)#6,358 |
| 65. | Beaver Creek | 6.9% | 3.2%(+3.71)#65 | 3.8%(+3.04)#6,583 |
| 66. | Glendive | 6.8% | 3.2%(+3.64)#66 | 3.8%(+2.98)#6,680 |
| 67. | Sidney | 6.8% | 3.2%(+3.63)#67 | 3.8%(+2.96)#6,701 |
| 68. | Chester | 6.5% | 3.2%(+3.38)#68 | 3.8%(+2.72)#7,115 |
| 69. | Stockett | 6.3% | 3.2%(+3.19)#69 | 3.8%(+2.52)#7,432 |
| 70. | Manhattan | 6.1% | 3.2%(+2.98)#70 | 3.8%(+2.31)#7,773 |
| 71. | Willow Creek | 6.1% | 3.2%(+2.96)#71 | 3.8%(+2.29)#7,803 |
| 72. | The Silos | 6.1% | 3.2%(+2.94)#72 | 3.8%(+2.27)#7,838 |
| 73. | Fort Benton | 6.0% | 3.2%(+2.83)#73 | 3.8%(+2.16)#8,069 |
| 74. | Superior | 5.9% | 3.2%(+2.76)#74 | 3.8%(+2.09)#8,193 |
| 75. | Wolf Point | 5.9% | 3.2%(+2.74)#75 | 3.8%(+2.07)#8,235 |
| 76. | Pony | 5.9% | 3.2%(+2.72)#76 | 3.8%(+2.05)#8,282 |
| 77. | Havre | 5.9% | 3.2%(+2.71)#77 | 3.8%(+2.05)#8,296 |
| 78. | Toston | 5.7% | 3.2%(+2.55)#78 | 3.8%(+1.88)#8,613 |
| 79. | Geyser | 5.7% | 3.2%(+2.55)#79 | 3.8%(+1.88)#8,621 |
| 80. | Conrad | 5.7% | 3.2%(+2.52)#80 | 3.8%(+1.85)#8,690 |
| 81. | Broadus | 5.7% | 3.2%(+2.50)#81 | 3.8%(+1.83)#8,733 |
| 82. | Pinesdale | 5.6% | 3.2%(+2.45)#82 | 3.8%(+1.79)#8,826 |
| 83. | Clinton | 5.6% | 3.2%(+2.41)#83 | 3.8%(+1.74)#8,909 |
| 84. | Miles City | 5.5% | 3.2%(+2.37)#84 | 3.8%(+1.70)#8,999 |
| 85. | Scobey | 5.5% | 3.2%(+2.32)#85 | 3.8%(+1.66)#9,091 |
| 86. | White Sulphur Springs | 5.4% | 3.2%(+2.20)#86 | 3.8%(+1.53)#9,334 |
| 87. | Polson | 5.3% | 3.2%(+2.18)#87 | 3.8%(+1.51)#9,382 |
| 88. | Plevna | 5.3% | 3.2%(+2.10)#88 | 3.8%(+1.43)#9,559 |
| 89. | Helena West Side | 5.3% | 3.2%(+2.09)#89 | 3.8%(+1.43)#9,591 |
| 90. | Evergreen | 5.2% | 3.2%(+2.03)#90 | 3.8%(+1.36)#9,731 |
| 91. | Poplar | 5.2% | 3.2%(+2.00)#91 | 3.8%(+1.33)#9,796 |
| 92. | Heron | 5.0% | 3.2%(+1.84)#92 | 3.8%(+1.17)#10,143 |
| 93. | Hingham | 5.0% | 3.2%(+1.84)#93 | 3.8%(+1.17)#10,154 |
| 94. | Richey | 5.0% | 3.2%(+1.80)#94 | 3.8%(+1.13)#10,236 |
| 95. | Laurel | 4.9% | 3.2%(+1.73)#95 | 3.8%(+1.07)#10,388 |
| 96. | Broadview | 4.9% | 3.2%(+1.71)#96 | 3.8%(+1.05)#10,449 |
| 97. | Edgar | 4.9% | 3.2%(+1.71)#97 | 3.8%(+1.05)#10,453 |
| 98. | Sunburst | 4.8% | 3.2%(+1.65)#98 | 3.8%(+0.983)#10,605 |
| 99. | Batavia | 4.8% | 3.2%(+1.63)#99 | 3.8%(+0.959)#10,671 |
| 100. | Muddy | 4.7% | 3.2%(+1.55)#100 | 3.8%(+0.887)#10,883 |
Common Questions
What are the Top 10 Cities with the Highest Percentage of Population Employed in Material Moving in Montana?
Top 10 Cities with the Highest Percentage of Population Employed in Material Moving in Montana are:
#1
75.0%
#2
45.5%
#3
44.4%
#4
37.5%
#5
31.4%
#6
30.0%
#7
29.3%
#8
27.6%
#9
26.4%
#10
23.4%
What city has the Highest Percentage of Population Employed in Material Moving in Montana?
Loma has the Highest Percentage of Population Employed in Material Moving in Montana with 75.0%.
What is the Percentage of Population Employed in Material Moving in the State of Montana?
Percentage of Population Employed in Material Moving in Montana is 3.2%.
What is the Percentage of Population Employed in Material Moving in the United States?
Percentage of Population Employed in Material Moving in the United States is 3.8%.