Cities with the Highest Percentage of Population Employed in Material Moving in Utah
RELATED REPORTS & OPTIONS
Material Moving
Utah
Compare Cities
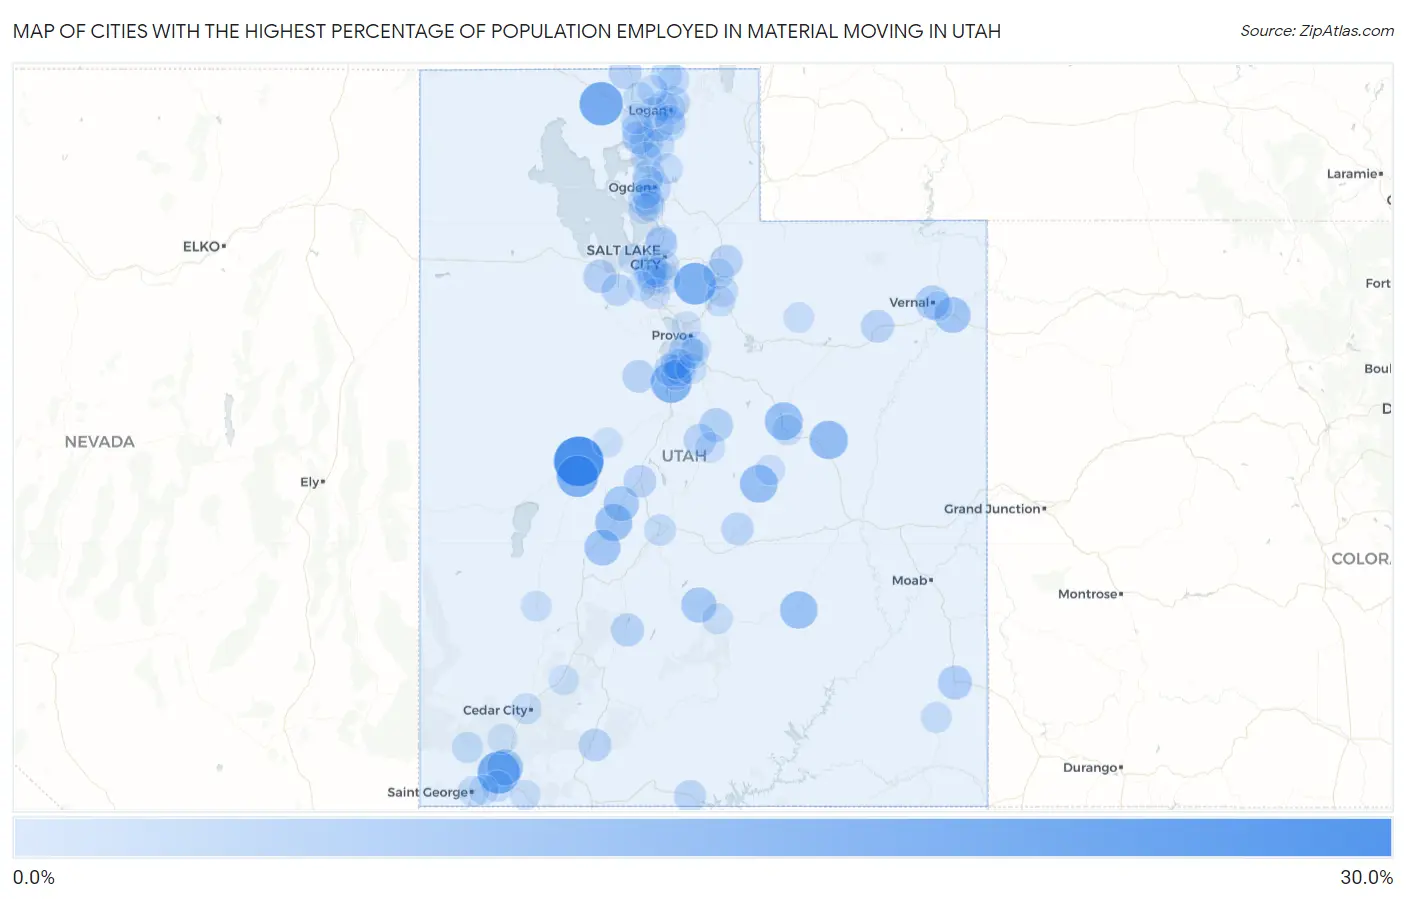
Map of Cities with the Highest Percentage of Population Employed in Material Moving in Utah
0.0%
30.0%
Cities with the Highest Percentage of Population Employed in Material Moving in Utah
| City | % Employed | vs State | vs National | |
| 1. | Sutherland | 27.5% | 3.8%(+23.7)#1 | 3.8%(+23.7)#368 |
| 2. | Howell | 19.8% | 3.8%(+15.9)#2 | 3.8%(+15.9)#742 |
| 3. | Leeds | 18.4% | 3.8%(+14.6)#3 | 3.8%(+14.6)#865 |
| 4. | Alta | 18.0% | 3.8%(+14.2)#4 | 3.8%(+14.2)#908 |
| 5. | Deseret | 17.5% | 3.8%(+13.7)#5 | 3.8%(+13.7)#970 |
| 6. | Rocky Ridge | 16.6% | 3.8%(+12.8)#6 | 3.8%(+12.8)#1,102 |
| 7. | East Carbon | 13.7% | 3.8%(+9.90)#7 | 3.8%(+9.90)#1,687 |
| 8. | Orangeville | 13.1% | 3.8%(+9.22)#8 | 3.8%(+9.22)#1,900 |
| 9. | Spring Glen | 13.0% | 3.8%(+9.12)#9 | 3.8%(+9.13)#1,940 |
| 10. | Hanksville | 12.6% | 3.8%(+8.80)#10 | 3.8%(+8.80)#2,050 |
| 11. | Fillmore | 12.1% | 3.8%(+8.25)#11 | 3.8%(+8.25)#2,264 |
| 12. | Kanosh | 10.9% | 3.8%(+7.08)#12 | 3.8%(+7.08)#2,774 |
| 13. | Toquerville | 10.9% | 3.8%(+7.06)#13 | 3.8%(+7.06)#2,783 |
| 14. | Jensen | 10.9% | 3.8%(+7.05)#14 | 3.8%(+7.05)#2,789 |
| 15. | Holden | 9.9% | 3.8%(+6.09)#15 | 3.8%(+6.09)#3,352 |
| 16. | Lyman | 9.9% | 3.8%(+6.07)#16 | 3.8%(+6.07)#3,365 |
| 17. | Palmyra | 9.0% | 3.8%(+5.13)#17 | 3.8%(+5.13)#4,111 |
| 18. | Vernal | 8.7% | 3.8%(+4.90)#18 | 3.8%(+4.90)#4,287 |
| 19. | Monticello | 8.5% | 3.8%(+4.70)#19 | 3.8%(+4.70)#4,477 |
| 20. | Fairview | 8.2% | 3.8%(+4.32)#20 | 3.8%(+4.32)#4,872 |
| 21. | Grantsville | 8.1% | 3.8%(+4.24)#21 | 3.8%(+4.24)#4,970 |
| 22. | Brigham City | 7.8% | 3.8%(+3.94)#22 | 3.8%(+3.94)#5,340 |
| 23. | Junction | 7.4% | 3.8%(+3.58)#23 | 3.8%(+3.58)#5,800 |
| 24. | Portage | 7.3% | 3.8%(+3.49)#24 | 3.8%(+3.49)#5,930 |
| 25. | Roosevelt | 7.3% | 3.8%(+3.47)#25 | 3.8%(+3.47)#5,961 |
| 26. | Moroni | 7.2% | 3.8%(+3.36)#26 | 3.8%(+3.36)#6,101 |
| 27. | Corinne | 7.2% | 3.8%(+3.35)#27 | 3.8%(+3.35)#6,114 |
| 28. | Peoa | 7.1% | 3.8%(+3.31)#28 | 3.8%(+3.31)#6,187 |
| 29. | Eureka | 7.1% | 3.8%(+3.24)#29 | 3.8%(+3.24)#6,262 |
| 30. | Alton | 7.0% | 3.8%(+3.21)#30 | 3.8%(+3.21)#6,311 |
| 31. | Scipio | 7.0% | 3.8%(+3.13)#31 | 3.8%(+3.13)#6,444 |
| 32. | North Salt Lake | 6.9% | 3.8%(+3.09)#32 | 3.8%(+3.09)#6,504 |
| 33. | Kearns | 6.9% | 3.8%(+3.06)#33 | 3.8%(+3.06)#6,558 |
| 34. | West Valley City | 6.9% | 3.8%(+3.03)#34 | 3.8%(+3.04)#6,592 |
| 35. | Emery | 6.9% | 3.8%(+3.03)#35 | 3.8%(+3.03)#6,605 |
| 36. | Ogden | 6.6% | 3.8%(+2.77)#36 | 3.8%(+2.77)#7,025 |
| 37. | North Logan | 6.6% | 3.8%(+2.77)#37 | 3.8%(+2.77)#7,030 |
| 38. | Spring Lake | 6.5% | 3.8%(+2.65)#38 | 3.8%(+2.65)#7,215 |
| 39. | Big Water | 6.4% | 3.8%(+2.59)#39 | 3.8%(+2.60)#7,291 |
| 40. | Tooele | 6.3% | 3.8%(+2.51)#40 | 3.8%(+2.52)#7,440 |
| 41. | Genola | 6.3% | 3.8%(+2.49)#41 | 3.8%(+2.50)#7,469 |
| 42. | Hyrum | 5.9% | 3.8%(+2.11)#42 | 3.8%(+2.12)#8,153 |
| 43. | Bear River City | 5.9% | 3.8%(+2.10)#43 | 3.8%(+2.10)#8,186 |
| 44. | Payson | 5.8% | 3.8%(+2.00)#44 | 3.8%(+2.00)#8,371 |
| 45. | Farr West | 5.8% | 3.8%(+1.95)#45 | 3.8%(+1.95)#8,461 |
| 46. | Aurora | 5.8% | 3.8%(+1.93)#46 | 3.8%(+1.93)#8,508 |
| 47. | Mantua | 5.8% | 3.8%(+1.92)#47 | 3.8%(+1.92)#8,532 |
| 48. | Clinton | 5.7% | 3.8%(+1.87)#48 | 3.8%(+1.87)#8,636 |
| 49. | Lewiston | 5.5% | 3.8%(+1.69)#49 | 3.8%(+1.69)#9,029 |
| 50. | Fielding | 5.4% | 3.8%(+1.60)#50 | 3.8%(+1.60)#9,202 |
| 51. | Central | 5.4% | 3.8%(+1.54)#51 | 3.8%(+1.54)#9,310 |
| 52. | Hurricane | 5.3% | 3.8%(+1.51)#52 | 3.8%(+1.51)#9,395 |
| 53. | Willard | 5.3% | 3.8%(+1.43)#53 | 3.8%(+1.43)#9,550 |
| 54. | Logan | 5.2% | 3.8%(+1.39)#54 | 3.8%(+1.39)#9,676 |
| 55. | Santaquin | 5.2% | 3.8%(+1.35)#55 | 3.8%(+1.35)#9,753 |
| 56. | White | 5.2% | 3.8%(+1.32)#56 | 3.8%(+1.32)#9,834 |
| 57. | Midvale | 5.1% | 3.8%(+1.28)#57 | 3.8%(+1.28)#9,909 |
| 58. | Heber | 5.1% | 3.8%(+1.27)#58 | 3.8%(+1.27)#9,919 |
| 59. | Richmond | 5.1% | 3.8%(+1.24)#59 | 3.8%(+1.24)#9,992 |
| 60. | Hideout | 5.0% | 3.8%(+1.20)#60 | 3.8%(+1.20)#10,089 |
| 61. | Sunset | 5.0% | 3.8%(+1.20)#61 | 3.8%(+1.20)#10,093 |
| 62. | Blanding | 5.0% | 3.8%(+1.18)#62 | 3.8%(+1.18)#10,121 |
| 63. | St George | 5.0% | 3.8%(+1.17)#63 | 3.8%(+1.17)#10,161 |
| 64. | Cedar City | 5.0% | 3.8%(+1.12)#64 | 3.8%(+1.12)#10,263 |
| 65. | Magna | 4.9% | 3.8%(+1.09)#65 | 3.8%(+1.09)#10,341 |
| 66. | Elwood | 4.9% | 3.8%(+1.03)#66 | 3.8%(+1.03)#10,481 |
| 67. | West Mountain | 4.8% | 3.8%(+0.968)#67 | 3.8%(+0.969)#10,644 |
| 68. | South Salt Lake | 4.8% | 3.8%(+0.966)#68 | 3.8%(+0.967)#10,649 |
| 69. | Milford | 4.8% | 3.8%(+0.961)#69 | 3.8%(+0.962)#10,661 |
| 70. | Benson | 4.8% | 3.8%(+0.956)#70 | 3.8%(+0.956)#10,678 |
| 71. | Daniel | 4.8% | 3.8%(+0.949)#71 | 3.8%(+0.950)#10,694 |
| 72. | Liberty | 4.8% | 3.8%(+0.923)#72 | 3.8%(+0.924)#10,785 |
| 73. | Wellsville | 4.7% | 3.8%(+0.881)#73 | 3.8%(+0.882)#10,894 |
| 74. | Woodland Hills | 4.7% | 3.8%(+0.867)#74 | 3.8%(+0.868)#10,932 |
| 75. | Tabiona | 4.7% | 3.8%(+0.857)#75 | 3.8%(+0.857)#10,963 |
| 76. | Mendon | 4.7% | 3.8%(+0.838)#76 | 3.8%(+0.838)#11,009 |
| 77. | Marriott Slaterville | 4.7% | 3.8%(+0.831)#77 | 3.8%(+0.832)#11,023 |
| 78. | Price | 4.7% | 3.8%(+0.828)#78 | 3.8%(+0.829)#11,034 |
| 79. | Torrey | 4.7% | 3.8%(+0.820)#79 | 3.8%(+0.821)#11,066 |
| 80. | Syracuse | 4.6% | 3.8%(+0.816)#80 | 3.8%(+0.816)#11,086 |
| 81. | Newton | 4.6% | 3.8%(+0.770)#81 | 3.8%(+0.770)#11,196 |
| 82. | West Jordan | 4.5% | 3.8%(+0.672)#82 | 3.8%(+0.672)#11,464 |
| 83. | Riverton | 4.5% | 3.8%(+0.630)#83 | 3.8%(+0.631)#11,574 |
| 84. | Apple Valley | 4.5% | 3.8%(+0.626)#84 | 3.8%(+0.626)#11,581 |
| 85. | Paragonah | 4.5% | 3.8%(+0.623)#85 | 3.8%(+0.623)#11,591 |
| 86. | Spring City | 4.4% | 3.8%(+0.549)#86 | 3.8%(+0.549)#11,766 |
| 87. | Clearfield | 4.4% | 3.8%(+0.547)#87 | 3.8%(+0.547)#11,775 |
| 88. | Nibley | 4.4% | 3.8%(+0.520)#88 | 3.8%(+0.520)#11,840 |
| 89. | Taylorsville | 4.3% | 3.8%(+0.474)#89 | 3.8%(+0.474)#12,002 |
| 90. | Naples | 4.3% | 3.8%(+0.427)#90 | 3.8%(+0.427)#12,131 |
| 91. | Huntington | 4.2% | 3.8%(+0.388)#91 | 3.8%(+0.389)#12,246 |
| 92. | Orem | 4.1% | 3.8%(+0.296)#92 | 3.8%(+0.296)#12,520 |
| 93. | New Harmony | 4.1% | 3.8%(+0.279)#93 | 3.8%(+0.279)#12,557 |
| 94. | Springville | 4.1% | 3.8%(+0.257)#94 | 3.8%(+0.258)#12,612 |
| 95. | Copperton | 4.1% | 3.8%(+0.255)#95 | 3.8%(+0.255)#12,623 |
| 96. | Spanish Fork | 4.1% | 3.8%(+0.242)#96 | 3.8%(+0.242)#12,667 |
| 97. | Washington | 4.1% | 3.8%(+0.235)#97 | 3.8%(+0.236)#12,692 |
| 98. | Roy | 4.1% | 3.8%(+0.220)#98 | 3.8%(+0.220)#12,739 |
| 99. | Woods Cross | 4.0% | 3.8%(+0.193)#99 | 3.8%(+0.194)#12,816 |
| 100. | Lynndyl | 4.0% | 3.8%(+0.169)#100 | 3.8%(+0.170)#12,896 |
Common Questions
What are the Top 10 Cities with the Highest Percentage of Population Employed in Material Moving in Utah?
Top 10 Cities with the Highest Percentage of Population Employed in Material Moving in Utah are:
#1
27.5%
#2
19.8%
#3
18.4%
#4
18.0%
#5
17.5%
#6
16.6%
#7
13.7%
#8
13.1%
#9
13.0%
#10
12.6%
What city has the Highest Percentage of Population Employed in Material Moving in Utah?
Sutherland has the Highest Percentage of Population Employed in Material Moving in Utah with 27.5%.
What is the Percentage of Population Employed in Material Moving in the State of Utah?
Percentage of Population Employed in Material Moving in Utah is 3.8%.
What is the Percentage of Population Employed in Material Moving in the United States?
Percentage of Population Employed in Material Moving in the United States is 3.8%.