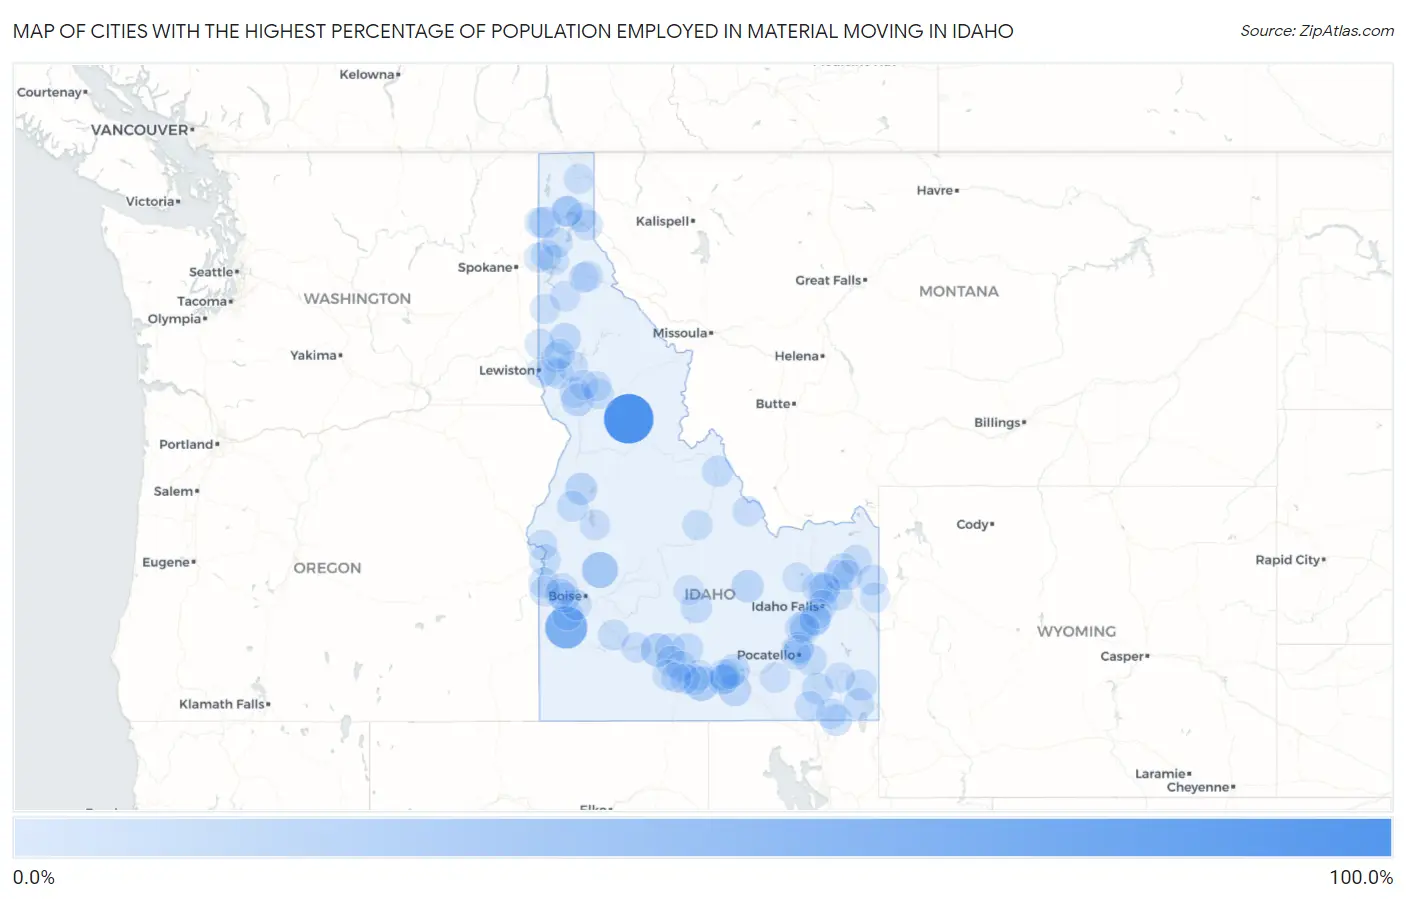
Cities with the Highest Percentage of Population Employed in Material Moving in Idaho
RELATED REPORTS & OPTIONS
Material Moving
Idaho
Compare Cities
Map of Cities with the Highest Percentage of Population Employed in Material Moving in Idaho
0.0%
100.0%
Cities with the Highest Percentage of Population Employed in Material Moving in Idaho
| City | % Employed | vs State | vs National | |
| 1. | Elk City | 89.1% | 3.6%(+85.5)#1 | 3.8%(+85.3)#34 |
| 2. | Murphy | 55.2% | 3.6%(+51.5)#2 | 3.8%(+51.3)#83 |
| 3. | Placerville | 28.6% | 3.6%(+24.9)#3 | 3.8%(+24.7)#339 |
| 4. | Murtaugh | 22.3% | 3.6%(+18.7)#4 | 3.8%(+18.5)#575 |
| 5. | Gannett | 20.5% | 3.6%(+16.8)#5 | 3.8%(+16.6)#696 |
| 6. | Bliss | 18.1% | 3.6%(+14.5)#6 | 3.8%(+14.3)#905 |
| 7. | Cottonwood | 13.5% | 3.6%(+9.90)#7 | 3.8%(+9.69)#1,761 |
| 8. | Moore | 13.1% | 3.6%(+9.49)#8 | 3.8%(+9.28)#1,885 |
| 9. | Albion | 12.9% | 3.6%(+9.30)#9 | 3.8%(+9.09)#1,953 |
| 10. | New Meadows | 12.2% | 3.6%(+8.62)#10 | 3.8%(+8.41)#2,198 |
| 11. | Acequia | 11.7% | 3.6%(+8.04)#11 | 3.8%(+7.84)#2,432 |
| 12. | Lewisville | 10.8% | 3.6%(+7.13)#12 | 3.8%(+6.92)#2,842 |
| 13. | Silverton | 10.5% | 3.6%(+6.87)#13 | 3.8%(+6.66)#2,989 |
| 14. | Deary | 10.5% | 3.6%(+6.85)#14 | 3.8%(+6.64)#3,000 |
| 15. | Priest River | 10.4% | 3.6%(+6.82)#15 | 3.8%(+6.61)#3,022 |
| 16. | Franklin | 9.7% | 3.6%(+6.08)#16 | 3.8%(+5.88)#3,504 |
| 17. | Shoshone | 9.6% | 3.6%(+6.02)#17 | 3.8%(+5.81)#3,547 |
| 18. | Firth | 9.5% | 3.6%(+5.83)#18 | 3.8%(+5.62)#3,699 |
| 19. | Downey | 9.3% | 3.6%(+5.70)#19 | 3.8%(+5.49)#3,805 |
| 20. | Bellevue | 9.2% | 3.6%(+5.58)#20 | 3.8%(+5.37)#3,894 |
| 21. | Inkom | 9.2% | 3.6%(+5.54)#21 | 3.8%(+5.33)#3,940 |
| 22. | Payette | 8.5% | 3.6%(+4.89)#22 | 3.8%(+4.68)#4,486 |
| 23. | Georgetown | 8.5% | 3.6%(+4.83)#23 | 3.8%(+4.62)#4,545 |
| 24. | Paul | 8.4% | 3.6%(+4.82)#24 | 3.8%(+4.61)#4,562 |
| 25. | Salmon | 8.2% | 3.6%(+4.56)#25 | 3.8%(+4.36)#4,840 |
| 26. | Ponderay | 7.9% | 3.6%(+4.29)#26 | 3.8%(+4.09)#5,147 |
| 27. | Council | 7.8% | 3.6%(+4.22)#27 | 3.8%(+4.01)#5,241 |
| 28. | Ririe | 7.6% | 3.6%(+3.96)#28 | 3.8%(+3.76)#5,567 |
| 29. | Paris | 7.5% | 3.6%(+3.88)#29 | 3.8%(+3.67)#5,677 |
| 30. | Mountain Home | 7.4% | 3.6%(+3.74)#30 | 3.8%(+3.54)#5,855 |
| 31. | Ferdinand | 7.3% | 3.6%(+3.67)#31 | 3.8%(+3.46)#5,970 |
| 32. | Smelterville | 7.3% | 3.6%(+3.63)#32 | 3.8%(+3.42)#6,019 |
| 33. | Melba | 7.1% | 3.6%(+3.49)#33 | 3.8%(+3.28)#6,215 |
| 34. | Eden | 7.1% | 3.6%(+3.46)#34 | 3.8%(+3.26)#6,244 |
| 35. | Middleton | 7.1% | 3.6%(+3.44)#35 | 3.8%(+3.23)#6,274 |
| 36. | St Anthony | 7.0% | 3.6%(+3.42)#36 | 3.8%(+3.22)#6,299 |
| 37. | Gooding | 6.9% | 3.6%(+3.33)#37 | 3.8%(+3.12)#6,458 |
| 38. | Roberts | 6.9% | 3.6%(+3.24)#38 | 3.8%(+3.03)#6,595 |
| 39. | Burley | 6.7% | 3.6%(+3.11)#39 | 3.8%(+2.91)#6,792 |
| 40. | Oldtown | 6.7% | 3.6%(+3.11)#40 | 3.8%(+2.91)#6,795 |
| 41. | Clark Fork | 6.7% | 3.6%(+3.11)#41 | 3.8%(+2.90)#6,810 |
| 42. | Tyhee | 6.6% | 3.6%(+3.02)#42 | 3.8%(+2.81)#6,964 |
| 43. | Hansen | 6.6% | 3.6%(+3.01)#43 | 3.8%(+2.80)#6,981 |
| 44. | Ashton | 6.5% | 3.6%(+2.90)#44 | 3.8%(+2.69)#7,143 |
| 45. | Tetonia | 6.2% | 3.6%(+2.63)#45 | 3.8%(+2.42)#7,576 |
| 46. | Parma | 6.2% | 3.6%(+2.62)#46 | 3.8%(+2.41)#7,608 |
| 47. | Wendell | 6.2% | 3.6%(+2.57)#47 | 3.8%(+2.36)#7,673 |
| 48. | Rathdrum | 6.1% | 3.6%(+2.49)#48 | 3.8%(+2.28)#7,822 |
| 49. | Jerome | 6.1% | 3.6%(+2.44)#49 | 3.8%(+2.23)#7,917 |
| 50. | Kuna | 6.1% | 3.6%(+2.43)#50 | 3.8%(+2.22)#7,949 |
| 51. | St Maries | 6.0% | 3.6%(+2.40)#51 | 3.8%(+2.20)#7,994 |
| 52. | Cascade | 5.8% | 3.6%(+2.21)#52 | 3.8%(+2.00)#8,374 |
| 53. | Peck | 5.8% | 3.6%(+2.17)#53 | 3.8%(+1.97)#8,442 |
| 54. | Kootenai | 5.8% | 3.6%(+2.15)#54 | 3.8%(+1.94)#8,473 |
| 55. | Nampa | 5.6% | 3.6%(+1.97)#55 | 3.8%(+1.76)#8,873 |
| 56. | Sugar City | 5.6% | 3.6%(+1.96)#56 | 3.8%(+1.75)#8,886 |
| 57. | Buhl | 5.6% | 3.6%(+1.95)#57 | 3.8%(+1.74)#8,912 |
| 58. | Heyburn | 5.5% | 3.6%(+1.92)#58 | 3.8%(+1.72)#8,978 |
| 59. | Preston | 5.5% | 3.6%(+1.91)#59 | 3.8%(+1.71)#8,991 |
| 60. | Newdale | 5.5% | 3.6%(+1.89)#60 | 3.8%(+1.68)#9,044 |
| 61. | Grace | 5.4% | 3.6%(+1.76)#61 | 3.8%(+1.56)#9,273 |
| 62. | Wilder | 5.4% | 3.6%(+1.74)#62 | 3.8%(+1.54)#9,327 |
| 63. | Kooskia | 5.3% | 3.6%(+1.71)#63 | 3.8%(+1.50)#9,403 |
| 64. | Kamiah | 5.3% | 3.6%(+1.70)#64 | 3.8%(+1.49)#9,420 |
| 65. | Menan | 5.3% | 3.6%(+1.69)#65 | 3.8%(+1.49)#9,447 |
| 66. | Weiser | 5.3% | 3.6%(+1.68)#66 | 3.8%(+1.47)#9,477 |
| 67. | Rockland | 5.3% | 3.6%(+1.64)#67 | 3.8%(+1.43)#9,567 |
| 68. | Moreland | 5.3% | 3.6%(+1.63)#68 | 3.8%(+1.42)#9,597 |
| 69. | Caldwell | 5.2% | 3.6%(+1.62)#69 | 3.8%(+1.41)#9,618 |
| 70. | Twin Falls | 5.2% | 3.6%(+1.57)#70 | 3.8%(+1.36)#9,735 |
| 71. | Leadore | 5.2% | 3.6%(+1.55)#71 | 3.8%(+1.34)#9,785 |
| 72. | Basalt | 5.2% | 3.6%(+1.54)#72 | 3.8%(+1.33)#9,801 |
| 73. | Groveland | 5.1% | 3.6%(+1.45)#73 | 3.8%(+1.24)#10,008 |
| 74. | Glenns Ferry | 5.1% | 3.6%(+1.43)#74 | 3.8%(+1.23)#10,036 |
| 75. | Challis | 4.9% | 3.6%(+1.27)#75 | 3.8%(+1.06)#10,407 |
| 76. | Malad City | 4.9% | 3.6%(+1.24)#76 | 3.8%(+1.04)#10,471 |
| 77. | Dalton Gardens | 4.8% | 3.6%(+1.22)#77 | 3.8%(+1.01)#10,533 |
| 78. | Filer | 4.7% | 3.6%(+1.10)#78 | 3.8%(+0.894)#10,863 |
| 79. | Culdesac | 4.6% | 3.6%(+1.01)#79 | 3.8%(+0.806)#11,105 |
| 80. | Idaho Falls | 4.6% | 3.6%(+0.994)#80 | 3.8%(+0.788)#11,154 |
| 81. | Lapwai | 4.6% | 3.6%(+0.942)#81 | 3.8%(+0.735)#11,283 |
| 82. | Victor | 4.5% | 3.6%(+0.844)#82 | 3.8%(+0.637)#11,558 |
| 83. | Nezperce | 4.4% | 3.6%(+0.807)#83 | 3.8%(+0.600)#11,650 |
| 84. | Shelley | 4.4% | 3.6%(+0.751)#84 | 3.8%(+0.545)#11,787 |
| 85. | Blackfoot | 4.4% | 3.6%(+0.734)#85 | 3.8%(+0.527)#11,827 |
| 86. | Juliaetta | 4.3% | 3.6%(+0.709)#86 | 3.8%(+0.502)#11,927 |
| 87. | Chubbuck | 4.3% | 3.6%(+0.695)#87 | 3.8%(+0.488)#11,956 |
| 88. | Lewiston | 4.3% | 3.6%(+0.680)#88 | 3.8%(+0.474)#12,003 |
| 89. | East Hope | 4.3% | 3.6%(+0.678)#89 | 3.8%(+0.471)#12,018 |
| 90. | Pocatello | 4.2% | 3.6%(+0.594)#90 | 3.8%(+0.387)#12,247 |
| 91. | Rupert | 4.2% | 3.6%(+0.588)#91 | 3.8%(+0.382)#12,268 |
| 92. | Mud Lake | 4.2% | 3.6%(+0.565)#92 | 3.8%(+0.358)#12,343 |
| 93. | Bonners Ferry | 4.2% | 3.6%(+0.565)#93 | 3.8%(+0.358)#12,345 |
| 94. | Tensed | 4.2% | 3.6%(+0.543)#94 | 3.8%(+0.336)#12,419 |
| 95. | Moscow | 4.1% | 3.6%(+0.500)#95 | 3.8%(+0.293)#12,528 |
| 96. | Kendrick | 4.1% | 3.6%(+0.475)#96 | 3.8%(+0.268)#12,581 |
| 97. | Ketchum | 4.0% | 3.6%(+0.420)#97 | 3.8%(+0.213)#12,757 |
| 98. | Hauser | 4.0% | 3.6%(+0.399)#98 | 3.8%(+0.193)#12,823 |
| 99. | Pinehurst | 4.0% | 3.6%(+0.376)#99 | 3.8%(+0.170)#12,876 |
| 100. | Athol | 4.0% | 3.6%(+0.350)#100 | 3.8%(+0.143)#12,962 |
Common Questions
What are the Top 10 Cities with the Highest Percentage of Population Employed in Material Moving in Idaho?
Top 10 Cities with the Highest Percentage of Population Employed in Material Moving in Idaho are:
#1
89.1%
#2
55.2%
#3
28.6%
#4
22.3%
#5
18.1%
#6
13.5%
#7
13.1%
#8
12.9%
#9
12.2%
#10
11.7%
What city has the Highest Percentage of Population Employed in Material Moving in Idaho?
Elk City has the Highest Percentage of Population Employed in Material Moving in Idaho with 89.1%.
What is the Percentage of Population Employed in Material Moving in the State of Idaho?
Percentage of Population Employed in Material Moving in Idaho is 3.6%.
What is the Percentage of Population Employed in Material Moving in the United States?
Percentage of Population Employed in Material Moving in the United States is 3.8%.