Desert Shores, CA Map & Demographics
Desert Shores Map
Desert Shores Overview
$18,419
PER CAPITA INCOME
$43,833
AVG FAMILY INCOME
$22,939
AVG HOUSEHOLD INCOME
0.32
INEQUALITY / GINI INDEX
360
TOTAL POPULATION
259
MALE POPULATION
101
FEMALE POPULATION
256.44
MALES / 100 FEMALES
39.00
FEMALES / 100 MALES
52.6
MEDIAN AGE
3.0
AVG FAMILY SIZE
1.7
AVG HOUSEHOLD SIZE
152
LABOR FORCE [ PEOPLE ]
42.2%
PERCENT IN LABOR FORCE
11.2%
UNEMPLOYMENT RATE
Income in Desert Shores
Income Overview in Desert Shores
Per Capita Income in Desert Shores is $18,419, while median incomes of families and households are $43,833 and $22,939 respectively.
| Characteristic | Number | Measure |
| Per Capita Income | 360 | $18,419 |
| Median Family Income | 72 | $43,833 |
| Mean Family Income | 72 | $48,214 |
| Median Household Income | 216 | $22,939 |
| Mean Household Income | 216 | $28,649 |
| Income Deficit | 72 | $0 |
| Wage / Income Gap (%) | 360 | 0.00% |
| Wage / Income Gap ($) | 360 | 100.00¢ per $1 |
| Gini / Inequality Index | 360 | 0.32 |
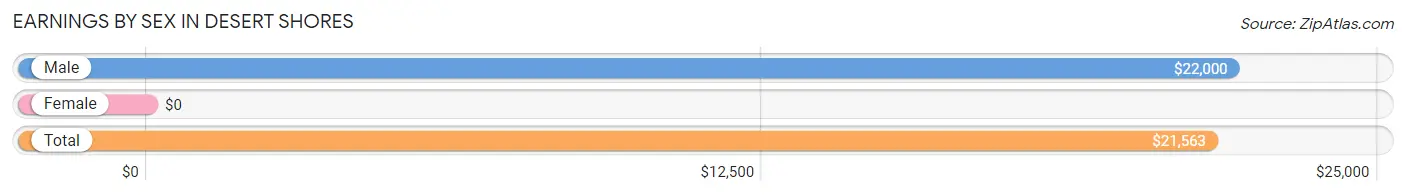
Earnings by Sex in Desert Shores
| Sex | Number | Average Earnings |
| Male | 128 (94.8%) | $22,000 |
| Female | 7 (5.2%) | $0 |
| Total | 135 (100.0%) | $21,563 |
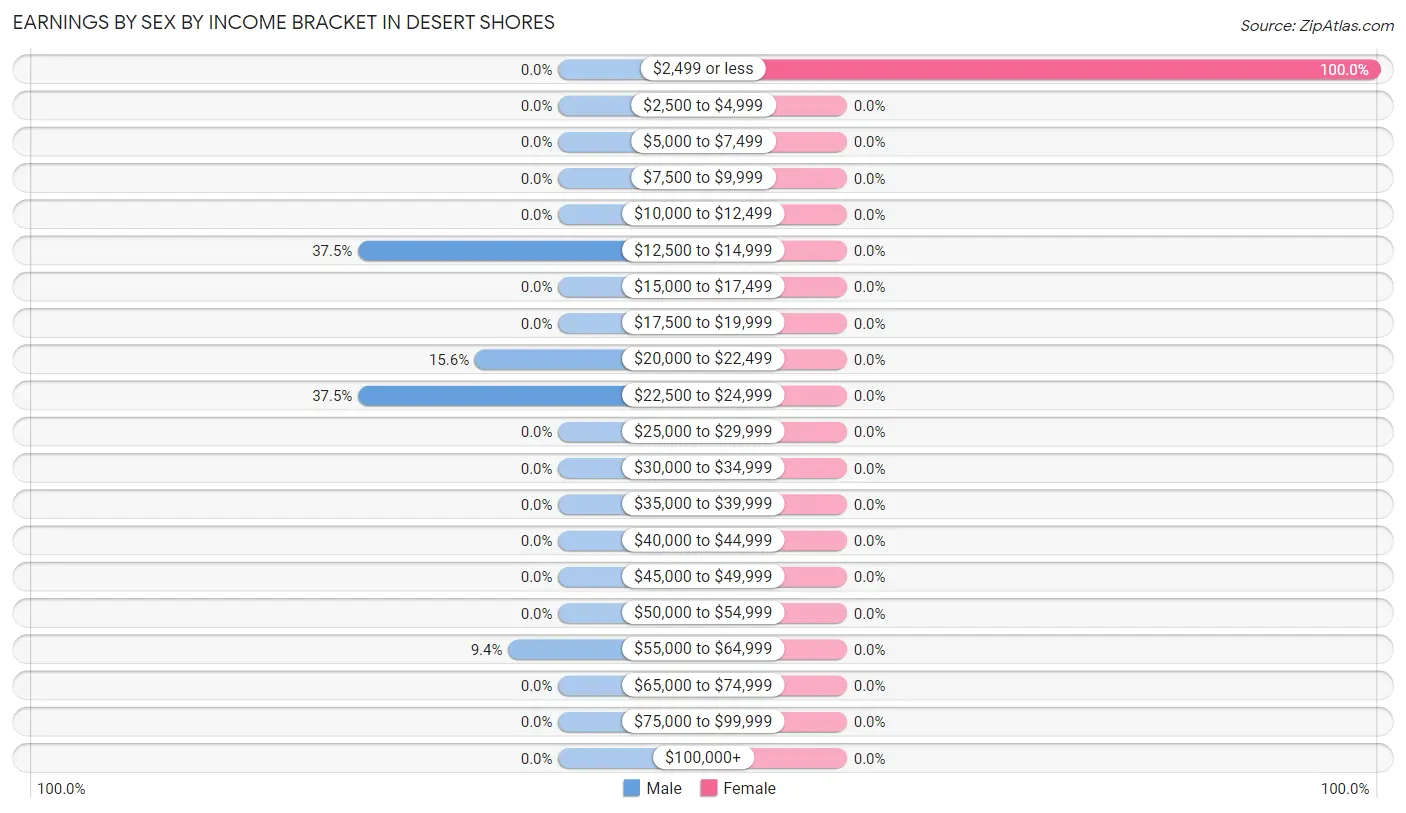
Earnings by Sex by Income Bracket in Desert Shores
The most common earnings brackets in Desert Shores are $12,500 to $14,999 for men (48 | 37.5%) and $2,499 or less for women (7 | 100.0%).
| Income | Male | Female |
| $2,499 or less | 0 (0.0%) | 7 (100.0%) |
| $2,500 to $4,999 | 0 (0.0%) | 0 (0.0%) |
| $5,000 to $7,499 | 0 (0.0%) | 0 (0.0%) |
| $7,500 to $9,999 | 0 (0.0%) | 0 (0.0%) |
| $10,000 to $12,499 | 0 (0.0%) | 0 (0.0%) |
| $12,500 to $14,999 | 48 (37.5%) | 0 (0.0%) |
| $15,000 to $17,499 | 0 (0.0%) | 0 (0.0%) |
| $17,500 to $19,999 | 0 (0.0%) | 0 (0.0%) |
| $20,000 to $22,499 | 20 (15.6%) | 0 (0.0%) |
| $22,500 to $24,999 | 48 (37.5%) | 0 (0.0%) |
| $25,000 to $29,999 | 0 (0.0%) | 0 (0.0%) |
| $30,000 to $34,999 | 0 (0.0%) | 0 (0.0%) |
| $35,000 to $39,999 | 0 (0.0%) | 0 (0.0%) |
| $40,000 to $44,999 | 0 (0.0%) | 0 (0.0%) |
| $45,000 to $49,999 | 0 (0.0%) | 0 (0.0%) |
| $50,000 to $54,999 | 0 (0.0%) | 0 (0.0%) |
| $55,000 to $64,999 | 12 (9.4%) | 0 (0.0%) |
| $65,000 to $74,999 | 0 (0.0%) | 0 (0.0%) |
| $75,000 to $99,999 | 0 (0.0%) | 0 (0.0%) |
| $100,000+ | 0 (0.0%) | 0 (0.0%) |
| Total | 128 (100.0%) | 7 (100.0%) |
Earnings by Sex by Educational Attainment in Desert Shores
| Educational Attainment | Male Income | Female Income |
| Less than High School | - | - |
| High School Diploma | - | - |
| College or Associate's Degree | - | - |
| Bachelor's Degree | - | - |
| Graduate Degree | - | - |
| Total | $22,000 | $0 |
Family Income in Desert Shores
Family Income Brackets in Desert Shores
According to the Desert Shores family income data, there are 30 families falling into the $35,000 to $49,999 income range, which is the most common income bracket and makes up 41.7% of all families.
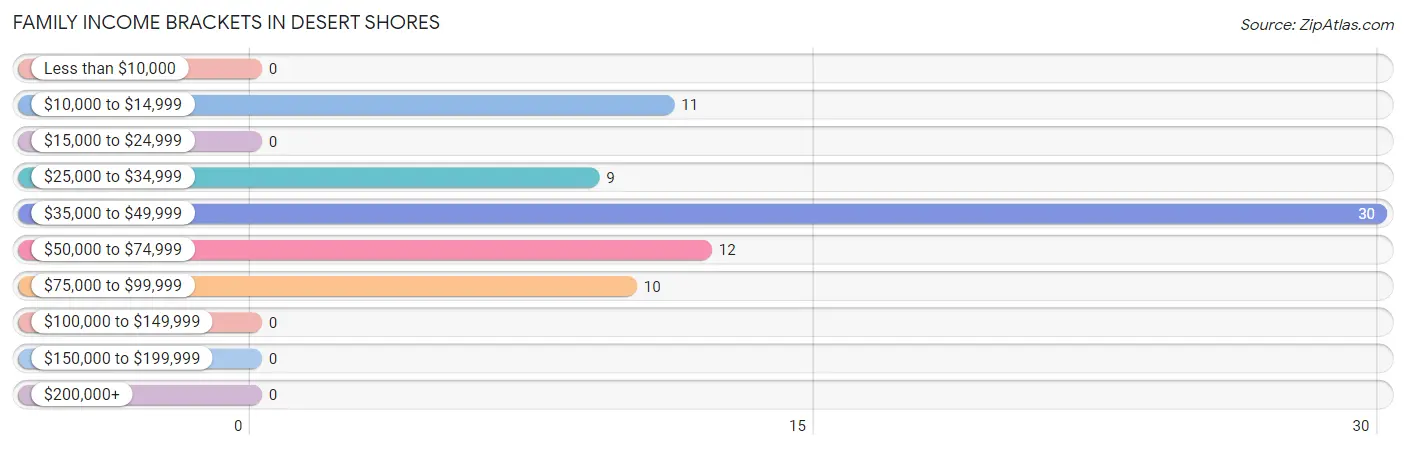
| Income Bracket | # Families | % Families |
| Less than $10,000 | 0 | 0.0% |
| $10,000 to $14,999 | 11 | 15.3% |
| $15,000 to $24,999 | 0 | 0.0% |
| $25,000 to $34,999 | 9 | 12.5% |
| $35,000 to $49,999 | 30 | 41.7% |
| $50,000 to $74,999 | 12 | 16.7% |
| $75,000 to $99,999 | 10 | 13.9% |
| $100,000 to $149,999 | 0 | 0.0% |
| $150,000 to $199,999 | 0 | 0.0% |
| $200,000+ | 0 | 0.0% |
Family Income by Famaliy Size in Desert Shores
2-person families (62 | 86.1%) account for the highest median family income in Desert Shores with $43,417 per family, while 2-person families (62 | 86.1%) have the highest median income of $21,708 per family member.
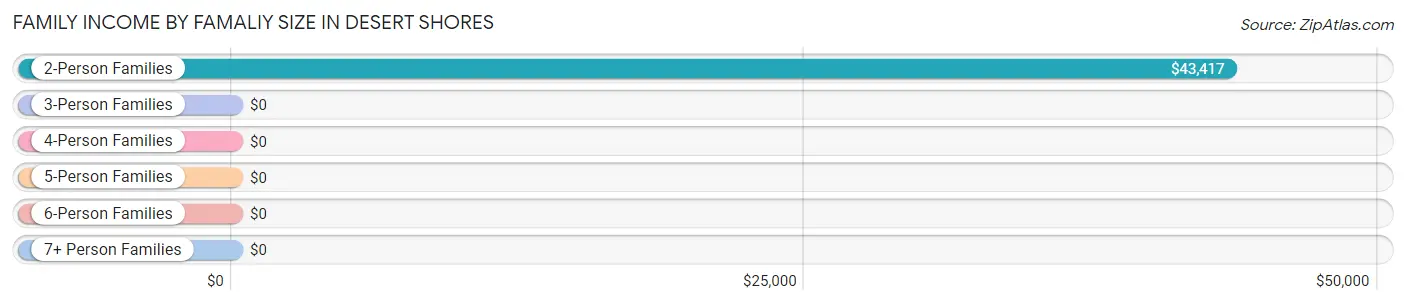
| Income Bracket | # Families | Median Income |
| 2-Person Families | 62 (86.1%) | $43,417 |
| 3-Person Families | 0 (0.0%) | $0 |
| 4-Person Families | 0 (0.0%) | $0 |
| 5-Person Families | 10 (13.9%) | $0 |
| 6-Person Families | 0 (0.0%) | $0 |
| 7+ Person Families | 0 (0.0%) | $0 |
| Total | 72 (100.0%) | $43,833 |
Family Income by Number of Earners in Desert Shores
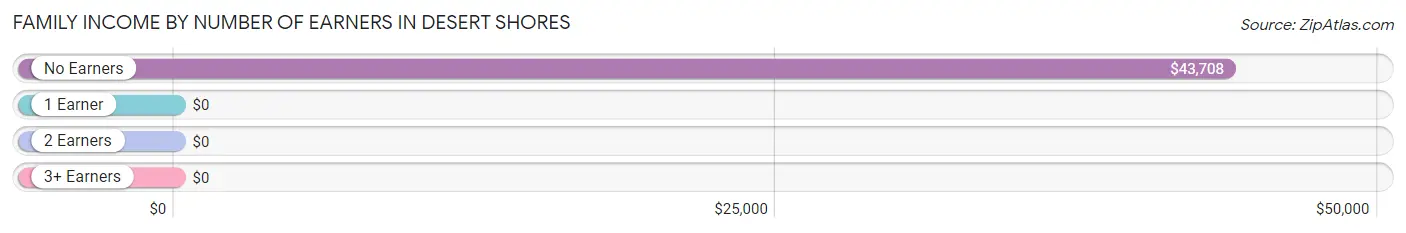
| Number of Earners | # Families | Median Income |
| No Earners | 51 (70.8%) | $43,708 |
| 1 Earner | 21 (29.2%) | $0 |
| 2 Earners | 0 (0.0%) | $0 |
| 3+ Earners | 0 (0.0%) | $0 |
| Total | 72 (100.0%) | $43,833 |
Household Income in Desert Shores
Household Income Brackets in Desert Shores
With 96 households falling in the category, the $15,000 to $24,999 income range is the most frequent in Desert Shores, accounting for 44.4% of all households.
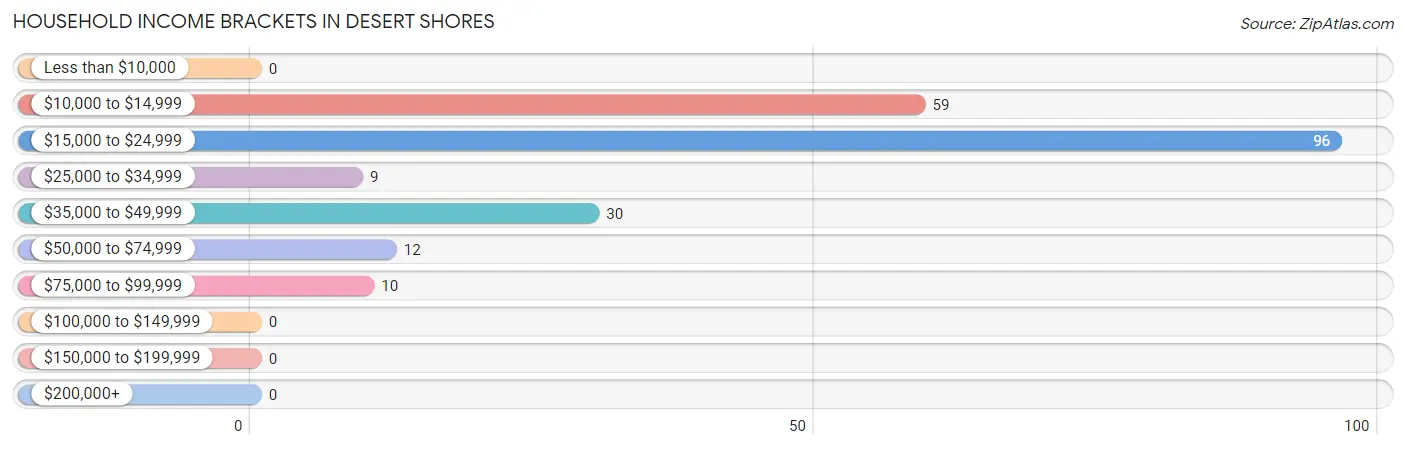
| Income Bracket | # Households | % Households |
| Less than $10,000 | 0 | 0.0% |
| $10,000 to $14,999 | 59 | 27.3% |
| $15,000 to $24,999 | 96 | 44.4% |
| $25,000 to $34,999 | 9 | 4.2% |
| $35,000 to $49,999 | 30 | 13.9% |
| $50,000 to $74,999 | 12 | 5.6% |
| $75,000 to $99,999 | 10 | 4.6% |
| $100,000 to $149,999 | 0 | 0.0% |
| $150,000 to $199,999 | 0 | 0.0% |
| $200,000+ | 0 | 0.0% |
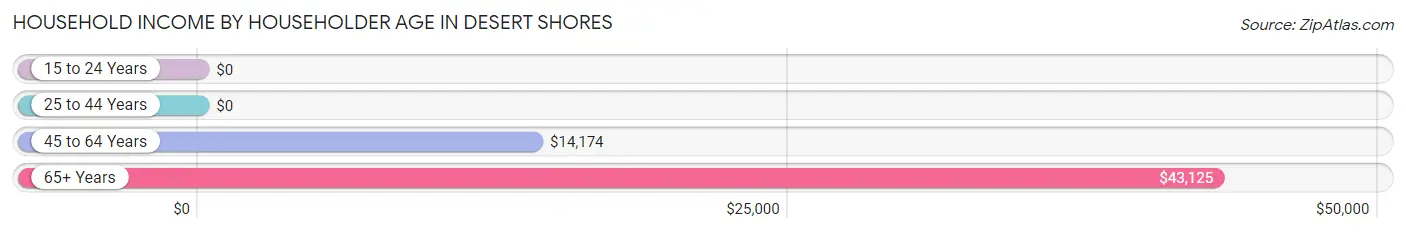
Household Income by Householder Age in Desert Shores
The median household income in Desert Shores is $22,939, with the highest median household income of $43,125 found in the 65+ years age bracket for the primary householder. A total of 89 households (41.2%) fall into this category.
| Income Bracket | # Households | Median Income |
| 15 to 24 Years | 0 (0.0%) | $0 |
| 25 to 44 Years | 48 (22.2%) | $0 |
| 45 to 64 Years | 79 (36.6%) | $14,174 |
| 65+ Years | 89 (41.2%) | $43,125 |
| Total | 216 (100.0%) | $22,939 |
Poverty in Desert Shores
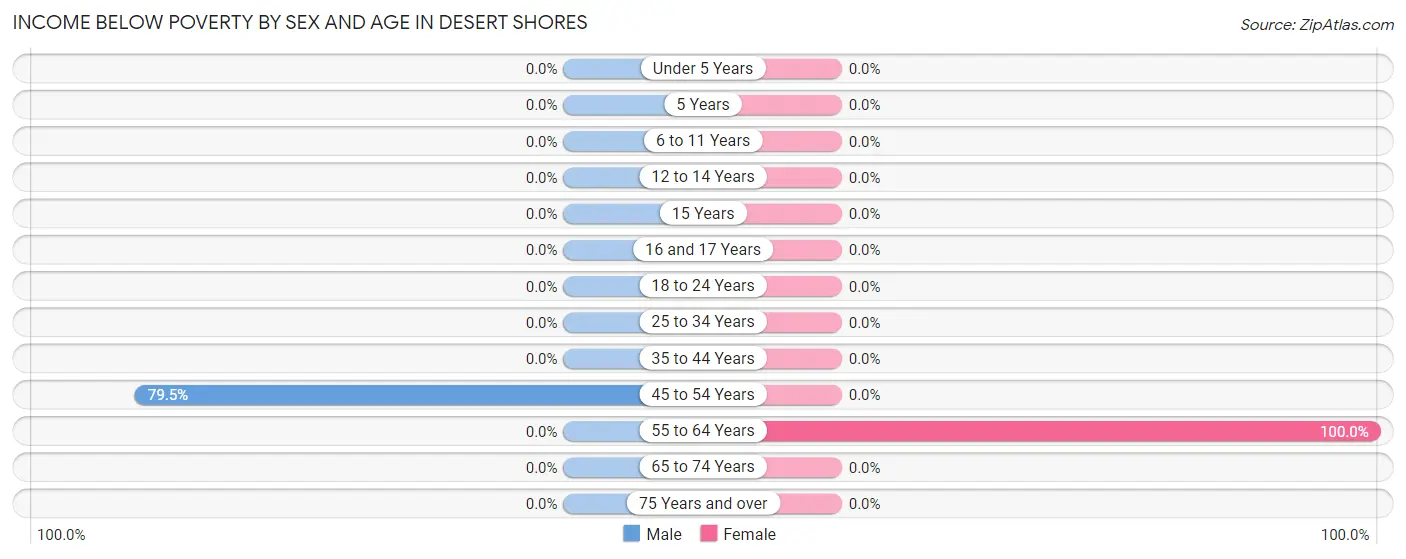
Income Below Poverty by Sex and Age in Desert Shores
With 25.5% poverty level for males and 10.9% for females among the residents of Desert Shores, 45 to 54 year old males and 55 to 64 year old females are the most vulnerable to poverty, with 66 males (79.5%) and 11 females (100.0%) in their respective age groups living below the poverty level.
| Age Bracket | Male | Female |
| Under 5 Years | 0 (0.0%) | 0 (0.0%) |
| 5 Years | 0 (0.0%) | 0 (0.0%) |
| 6 to 11 Years | 0 (0.0%) | 0 (0.0%) |
| 12 to 14 Years | 0 (0.0%) | 0 (0.0%) |
| 15 Years | 0 (0.0%) | 0 (0.0%) |
| 16 and 17 Years | 0 (0.0%) | 0 (0.0%) |
| 18 to 24 Years | 0 (0.0%) | 0 (0.0%) |
| 25 to 34 Years | 0 (0.0%) | 0 (0.0%) |
| 35 to 44 Years | 0 (0.0%) | 0 (0.0%) |
| 45 to 54 Years | 66 (79.5%) | 0 (0.0%) |
| 55 to 64 Years | 0 (0.0%) | 11 (100.0%) |
| 65 to 74 Years | 0 (0.0%) | 0 (0.0%) |
| 75 Years and over | 0 (0.0%) | 0 (0.0%) |
| Total | 66 (25.5%) | 11 (10.9%) |
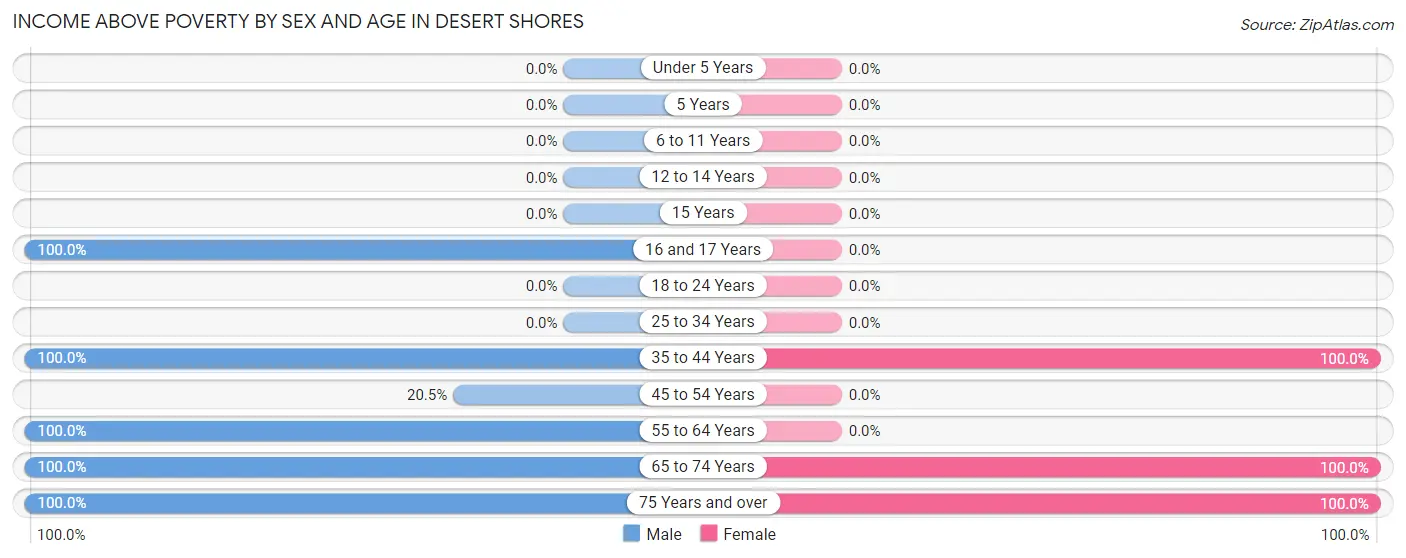
Income Above Poverty by Sex and Age in Desert Shores
According to the poverty statistics in Desert Shores, males aged 16 and 17 years and females aged 35 to 44 years are the age groups that are most secure financially, with 100.0% of males and 100.0% of females in these age groups living above the poverty line.
| Age Bracket | Male | Female |
| Under 5 Years | 0 (0.0%) | 0 (0.0%) |
| 5 Years | 0 (0.0%) | 0 (0.0%) |
| 6 to 11 Years | 0 (0.0%) | 0 (0.0%) |
| 12 to 14 Years | 0 (0.0%) | 0 (0.0%) |
| 15 Years | 0 (0.0%) | 0 (0.0%) |
| 16 and 17 Years | 15 (100.0%) | 0 (0.0%) |
| 18 to 24 Years | 0 (0.0%) | 0 (0.0%) |
| 25 to 34 Years | 0 (0.0%) | 0 (0.0%) |
| 35 to 44 Years | 71 (100.0%) | 17 (100.0%) |
| 45 to 54 Years | 17 (20.5%) | 0 (0.0%) |
| 55 to 64 Years | 20 (100.0%) | 0 (0.0%) |
| 65 to 74 Years | 31 (100.0%) | 26 (100.0%) |
| 75 Years and over | 39 (100.0%) | 47 (100.0%) |
| Total | 193 (74.5%) | 90 (89.1%) |
Income Below Poverty Among Married-Couple Families in Desert Shores
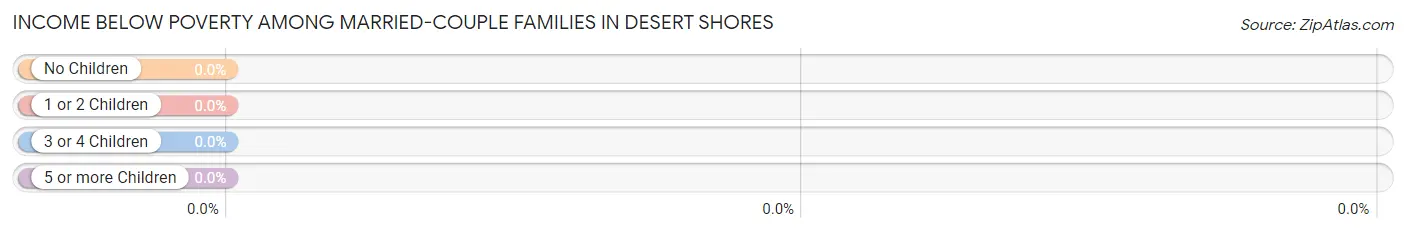
| Children | Above Poverty | Below Poverty |
| No Children | 51 (100.0%) | 0 (0.0%) |
| 1 or 2 Children | 0 (0.0%) | 0 (0.0%) |
| 3 or 4 Children | 0 (0.0%) | 0 (0.0%) |
| 5 or more Children | 0 (0.0%) | 0 (0.0%) |
| Total | 51 (100.0%) | 0 (0.0%) |
Income Below Poverty Among Single-Parent Households in Desert Shores
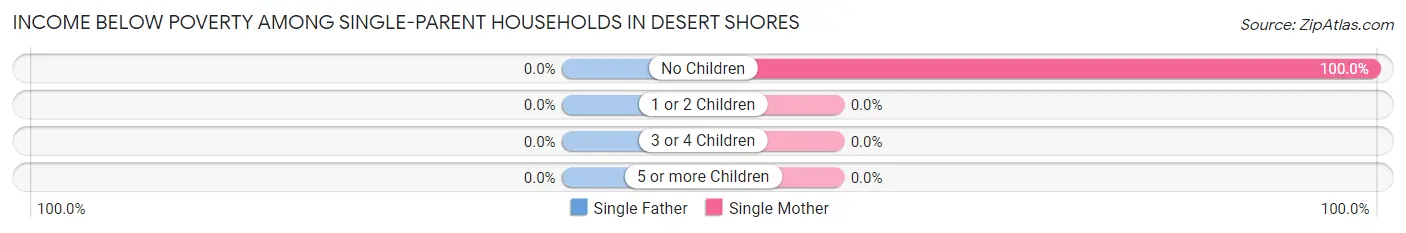
| Children | Single Father | Single Mother |
| No Children | 0 (0.0%) | 11 (100.0%) |
| 1 or 2 Children | 0 (0.0%) | 0 (0.0%) |
| 3 or 4 Children | 0 (0.0%) | 0 (0.0%) |
| 5 or more Children | 0 (0.0%) | 0 (0.0%) |
| Total | 0 (0.0%) | 11 (52.4%) |
Income Below Poverty Among Married-Couple vs Single-Parent Households in Desert Shores
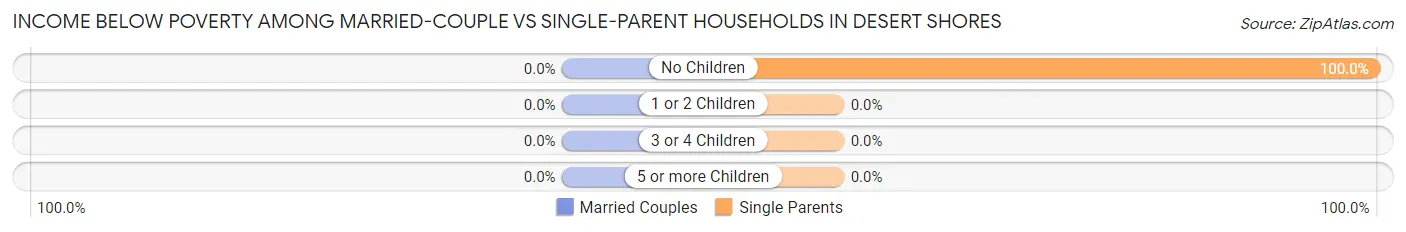
| Children | Married-Couple Families | Single-Parent Households |
| No Children | 0 (0.0%) | 11 (100.0%) |
| 1 or 2 Children | 0 (0.0%) | 0 (0.0%) |
| 3 or 4 Children | 0 (0.0%) | 0 (0.0%) |
| 5 or more Children | 0 (0.0%) | 0 (0.0%) |
| Total | 0 (0.0%) | 11 (52.4%) |
Race in Desert Shores
The most populous races in Desert Shores are Hispanic or Latino (268 | 74.4%), White / Caucasian (225 | 62.5%), and Some other Race (135 | 37.5%).
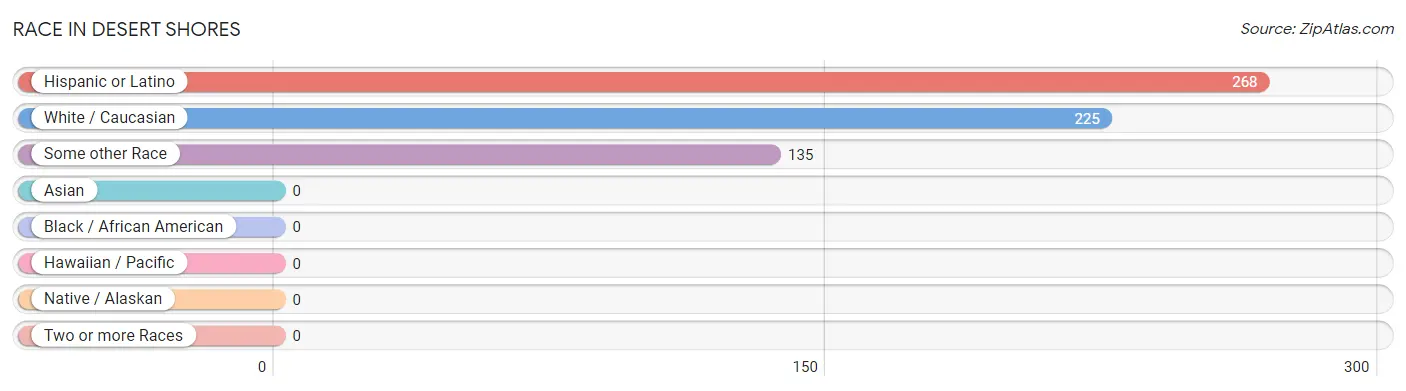
| Race | # Population | % Population |
| Asian | 0 | 0.0% |
| Black / African American | 0 | 0.0% |
| Hawaiian / Pacific | 0 | 0.0% |
| Hispanic or Latino | 268 | 74.4% |
| Native / Alaskan | 0 | 0.0% |
| White / Caucasian | 225 | 62.5% |
| Two or more Races | 0 | 0.0% |
| Some other Race | 135 | 37.5% |
| Total | 360 | 100.0% |
Ancestry in Desert Shores
The most populous ancestries reported in Desert Shores are Mexican (268 | 74.4%), German (96 | 26.7%), English (84 | 23.3%), Irish (23 | 6.4%), and Czech (9 | 2.5%), together accounting for 133.3% of all Desert Shores residents.
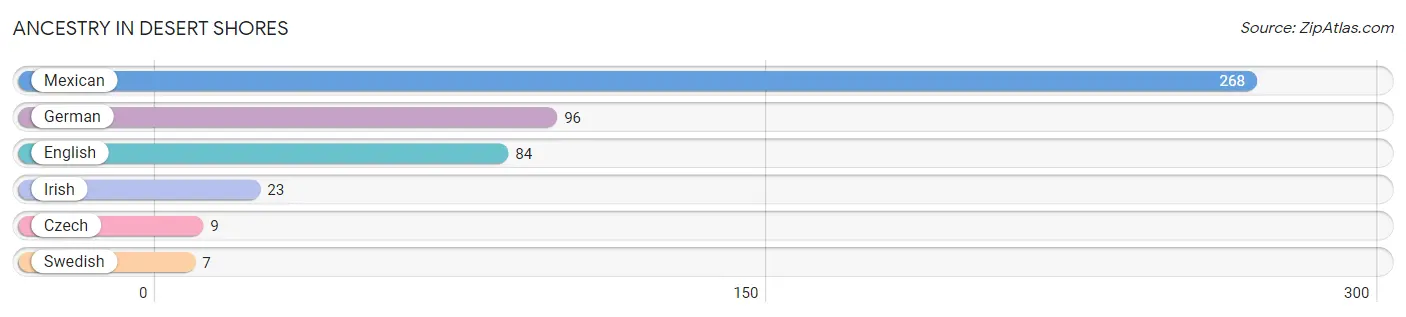
| Ancestry | # Population | % Population |
| Czech | 9 | 2.5% |
| English | 84 | 23.3% |
| German | 96 | 26.7% |
| Irish | 23 | 6.4% |
| Mexican | 268 | 74.4% |
| Swedish | 7 | 1.9% | View All 6 Rows |
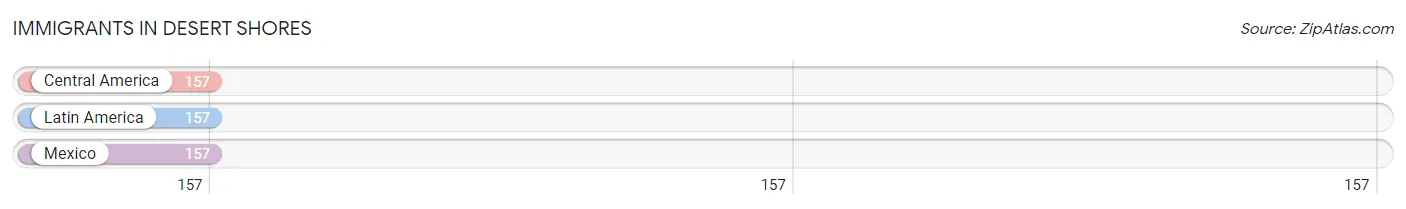
Immigrants in Desert Shores
The most numerous immigrant groups reported in Desert Shores came from Central America (157 | 43.6%), Latin America (157 | 43.6%), and Mexico (157 | 43.6%), together accounting for 130.8% of all Desert Shores residents.
| Immigration Origin | # Population | % Population |
| Central America | 157 | 43.6% |
| Latin America | 157 | 43.6% |
| Mexico | 157 | 43.6% | View All 3 Rows |
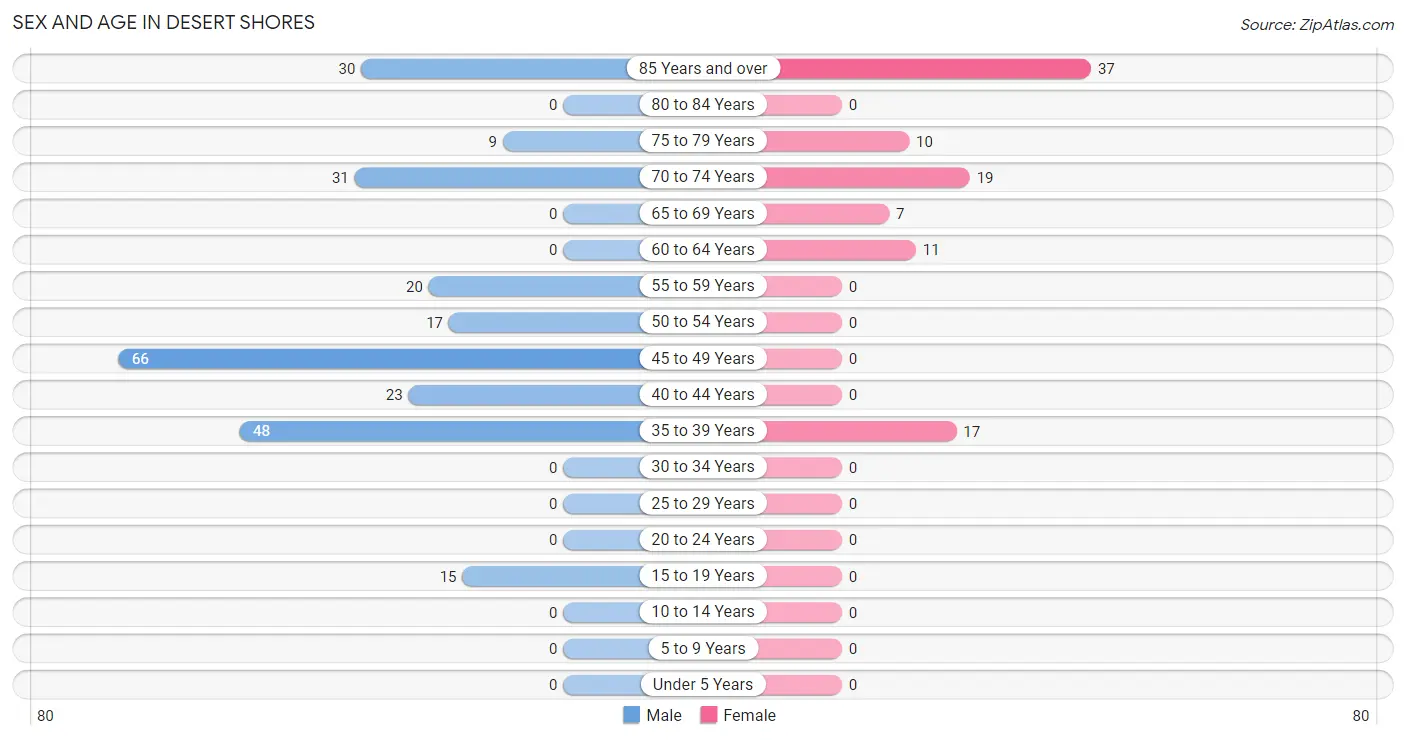
Sex and Age in Desert Shores
Sex and Age in Desert Shores
The most populous age groups in Desert Shores are 45 to 49 Years (66 | 25.5%) for men and 85 Years and over (37 | 36.6%) for women.
| Age Bracket | Male | Female |
| Under 5 Years | 0 (0.0%) | 0 (0.0%) |
| 5 to 9 Years | 0 (0.0%) | 0 (0.0%) |
| 10 to 14 Years | 0 (0.0%) | 0 (0.0%) |
| 15 to 19 Years | 15 (5.8%) | 0 (0.0%) |
| 20 to 24 Years | 0 (0.0%) | 0 (0.0%) |
| 25 to 29 Years | 0 (0.0%) | 0 (0.0%) |
| 30 to 34 Years | 0 (0.0%) | 0 (0.0%) |
| 35 to 39 Years | 48 (18.5%) | 17 (16.8%) |
| 40 to 44 Years | 23 (8.9%) | 0 (0.0%) |
| 45 to 49 Years | 66 (25.5%) | 0 (0.0%) |
| 50 to 54 Years | 17 (6.6%) | 0 (0.0%) |
| 55 to 59 Years | 20 (7.7%) | 0 (0.0%) |
| 60 to 64 Years | 0 (0.0%) | 11 (10.9%) |
| 65 to 69 Years | 0 (0.0%) | 7 (6.9%) |
| 70 to 74 Years | 31 (12.0%) | 19 (18.8%) |
| 75 to 79 Years | 9 (3.5%) | 10 (9.9%) |
| 80 to 84 Years | 0 (0.0%) | 0 (0.0%) |
| 85 Years and over | 30 (11.6%) | 37 (36.6%) |
| Total | 259 (100.0%) | 101 (100.0%) |
Families and Households in Desert Shores
Median Family Size in Desert Shores
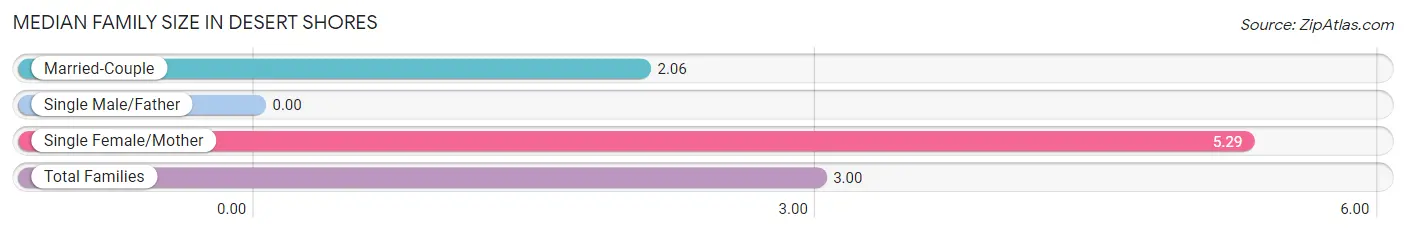
| Family Type | # Families | Family Size |
| Married-Couple | 51 (70.8%) | 2.06 |
| Single Male/Father | 0 (0.0%) | - |
| Single Female/Mother | 21 (29.2%) | 5.29 |
| Total Families | 72 (100.0%) | 3.00 |
Median Household Size in Desert Shores
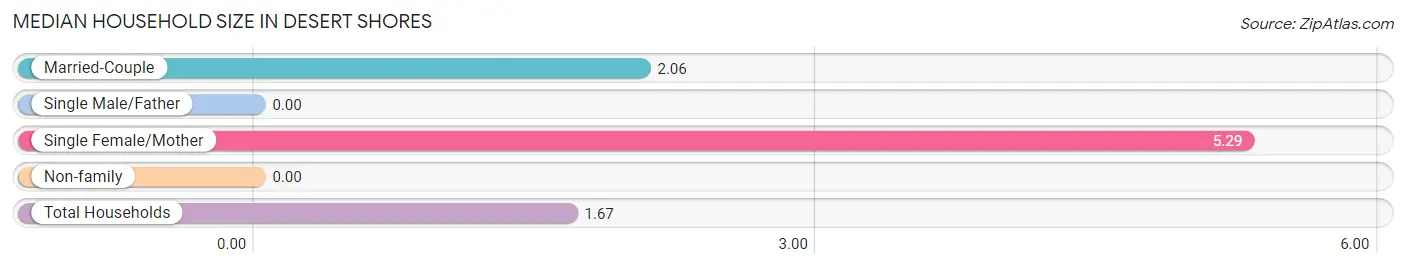
| Household Type | # Households | Household Size |
| Married-Couple | 51 (23.6%) | 2.06 |
| Single Male/Father | 0 (0.0%) | - |
| Single Female/Mother | 21 (9.7%) | 5.29 |
| Non-family | 144 (66.7%) | - |
| Total Households | 216 (100.0%) | 1.67 |
Household Size by Marriage Status in Desert Shores
Out of a total of 216 households in Desert Shores, 72 (33.3%) are family households, while 144 (66.7%) are nonfamily households. The most numerous type of family households are 2-person households, comprising 62, and the most common type of nonfamily households are 1-person households, comprising 144.
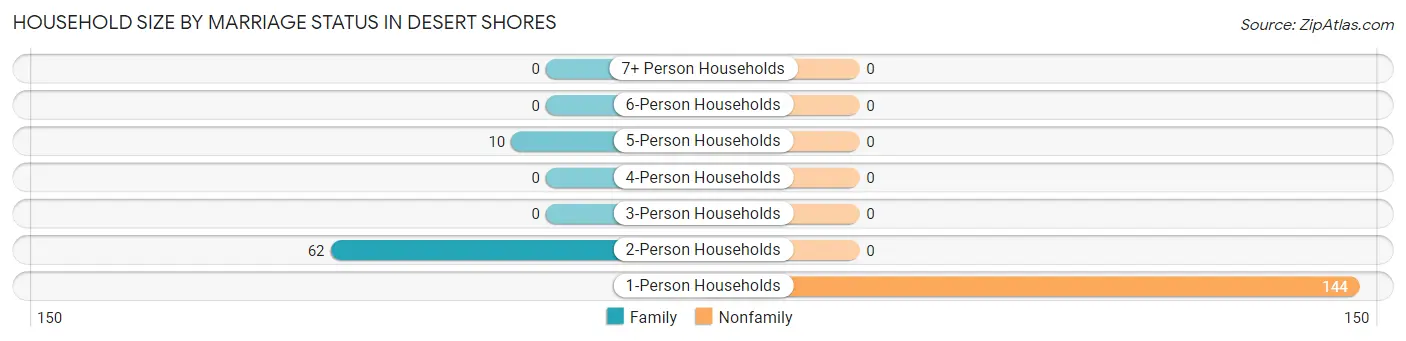
| Household Size | Family Households | Nonfamily Households |
| 1-Person Households | - | 144 (66.7%) |
| 2-Person Households | 62 (28.7%) | 0 (0.0%) |
| 3-Person Households | 0 (0.0%) | 0 (0.0%) |
| 4-Person Households | 0 (0.0%) | 0 (0.0%) |
| 5-Person Households | 10 (4.6%) | 0 (0.0%) |
| 6-Person Households | 0 (0.0%) | 0 (0.0%) |
| 7+ Person Households | 0 (0.0%) | 0 (0.0%) |
| Total | 72 (33.3%) | 144 (66.7%) |
Female Fertility in Desert Shores
Fertility by Age in Desert Shores
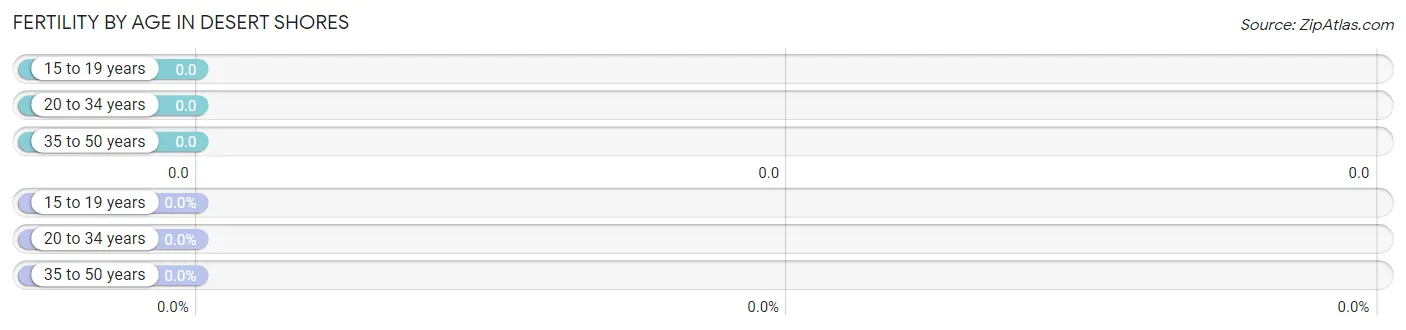
| Age Bracket | Women with Births | Births / 1,000 Women |
| 15 to 19 years | 0 (0.0%) | 0.0 |
| 20 to 34 years | 0 (0.0%) | 0.0 |
| 35 to 50 years | 0 (0.0%) | 0.0 |
| Total | 0 (0.0%) | 0.0 |
Fertility by Age by Marriage Status in Desert Shores
| Age Bracket | Married | Unmarried |
| 15 to 19 years | 0 (0.0%) | 0 (0.0%) |
| 20 to 34 years | 0 (0.0%) | 0 (0.0%) |
| 35 to 50 years | 0 (0.0%) | 0 (0.0%) |
| Total | 0 (0.0%) | 0 (0.0%) |
Fertility by Education in Desert Shores
| Educational Attainment | Women with Births | Births / 1,000 Women |
| Less than High School | 0 (0.0%) | 0.0 |
| High School Diploma | 0 (0.0%) | 0.0 |
| College or Associate's Degree | 0 (0.0%) | 0.0 |
| Bachelor's Degree | 0 (0.0%) | 0.0 |
| Graduate Degree | 0 (0.0%) | 0.0 |
| Total | 0 (0.0%) | 0.0 |
Fertility by Education by Marriage Status in Desert Shores
| Educational Attainment | Married | Unmarried |
| Less than High School | 0 (0.0%) | 0 (0.0%) |
| High School Diploma | 0 (0.0%) | 0 (0.0%) |
| College or Associate's Degree | 0 (0.0%) | 0 (0.0%) |
| Bachelor's Degree | 0 (0.0%) | 0 (0.0%) |
| Graduate Degree | 0 (0.0%) | 0 (0.0%) |
| Total | 0 (0.0%) | 0 (0.0%) |
Employment Characteristics in Desert Shores
Employment by Class of Employer in Desert Shores
Among the 135 employed individuals in Desert Shores, , and private company employees (135 | 100.0%) make up the most common classes of employment.
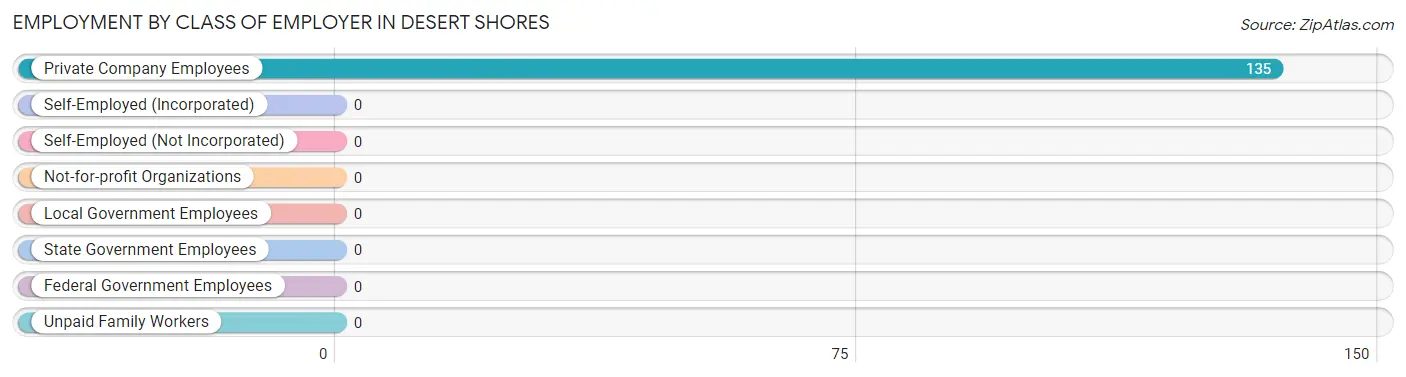
| Employer Class | # Employees | % Employees |
| Private Company Employees | 135 | 100.0% |
| Self-Employed (Incorporated) | 0 | 0.0% |
| Self-Employed (Not Incorporated) | 0 | 0.0% |
| Not-for-profit Organizations | 0 | 0.0% |
| Local Government Employees | 0 | 0.0% |
| State Government Employees | 0 | 0.0% |
| Federal Government Employees | 0 | 0.0% |
| Unpaid Family Workers | 0 | 0.0% |
| Total | 135 | 100.0% |
Employment Status by Age in Desert Shores
According to the labor force statistics for Desert Shores, out of the total population over 16 years of age (360), 42.2% or 152 individuals are in the labor force, with 11.2% or 17 of them unemployed. The age group with the highest labor force participation rate is 55 to 59 years, with 100.0% or 20 individuals in the labor force. Within the labor force, the 45 to 54 years age range has the highest percentage of unemployed individuals, with 26.2% or 17 of them being unemployed.
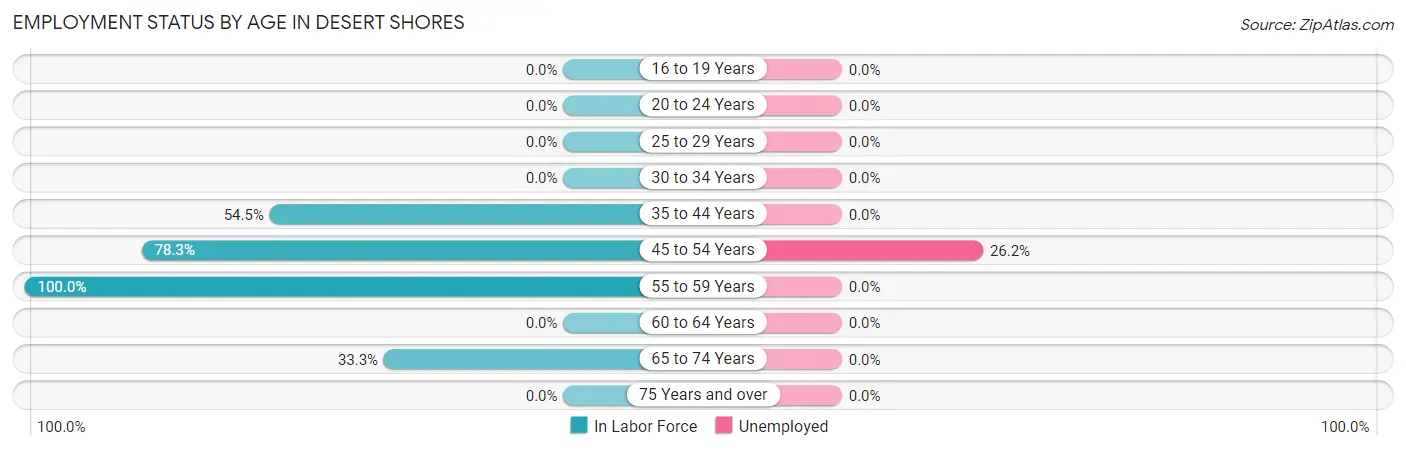
| Age Bracket | In Labor Force | Unemployed |
| 16 to 19 Years | 0 (0.0%) | 0 (0.0%) |
| 20 to 24 Years | 0 (0.0%) | 0 (0.0%) |
| 25 to 29 Years | 0 (0.0%) | 0 (0.0%) |
| 30 to 34 Years | 0 (0.0%) | 0 (0.0%) |
| 35 to 44 Years | 48 (54.5%) | 0 (0.0%) |
| 45 to 54 Years | 65 (78.3%) | 17 (26.2%) |
| 55 to 59 Years | 20 (100.0%) | 0 (0.0%) |
| 60 to 64 Years | 0 (0.0%) | 0 (0.0%) |
| 65 to 74 Years | 19 (33.3%) | 0 (0.0%) |
| 75 Years and over | 0 (0.0%) | 0 (0.0%) |
| Total | 152 (42.2%) | 17 (11.2%) |
Employment Status by Educational Attainment in Desert Shores
According to labor force statistics for Desert Shores, 65.8% of individuals (133) out of the total population between 25 and 64 years of age (202) are in the labor force, with 12.8% or 17 of them being unemployed. The group with the highest labor force participation rate are those with the educational attainment of high school diploma, with 100.0% or 48 individuals in the labor force. Within the labor force, individuals with college / associate degree education have the highest percentage of unemployment, with 100.0% or 17 of them being unemployed.
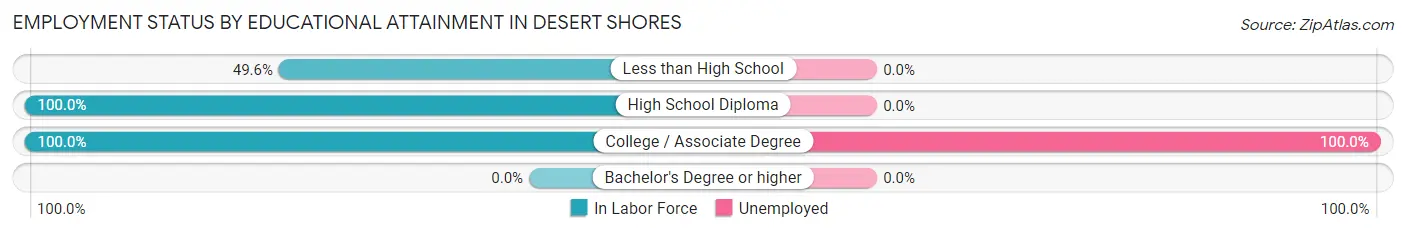
| Educational Attainment | In Labor Force | Unemployed |
| Less than High School | 68 (49.6%) | 0 (0.0%) |
| High School Diploma | 48 (100.0%) | 0 (0.0%) |
| College / Associate Degree | 17 (100.0%) | 17 (100.0%) |
| Bachelor's Degree or higher | 0 (0.0%) | 0 (0.0%) |
| Total | 133 (65.8%) | 26 (12.8%) |
Employment Occupations by Sex in Desert Shores
Management, Business, Science and Arts Occupations
Management, Business, Science and Arts Occupations by Sex
| Occupation | Male | Female |
| Management | 0 (0.0%) | 0 (0.0%) |
| Business & Financial | 0 (0.0%) | 0 (0.0%) |
| Computers, Engineering & Science | 0 (0.0%) | 0 (0.0%) |
| Computers & Mathematics | 0 (0.0%) | 0 (0.0%) |
| Architecture & Engineering | 0 (0.0%) | 0 (0.0%) |
| Life, Physical & Social Science | 0 (0.0%) | 0 (0.0%) |
| Community & Social Service | 0 (0.0%) | 0 (0.0%) |
| Education, Arts & Media | 0 (0.0%) | 0 (0.0%) |
| Legal Services & Support | 0 (0.0%) | 0 (0.0%) |
| Education Instruction & Library | 0 (0.0%) | 0 (0.0%) |
| Arts, Media & Entertainment | 0 (0.0%) | 0 (0.0%) |
| Health Diagnosing & Treating | 0 (0.0%) | 0 (0.0%) |
| Health Technologists | 0 (0.0%) | 0 (0.0%) |
| Total (Category) | 0 (0.0%) | 0 (0.0%) |
| Total (Overall) | 128 (94.8%) | 7 (5.2%) |
Services Occupations
The most common Services occupations in Desert Shores are , and Healthcare Support (7 | 5.2%).
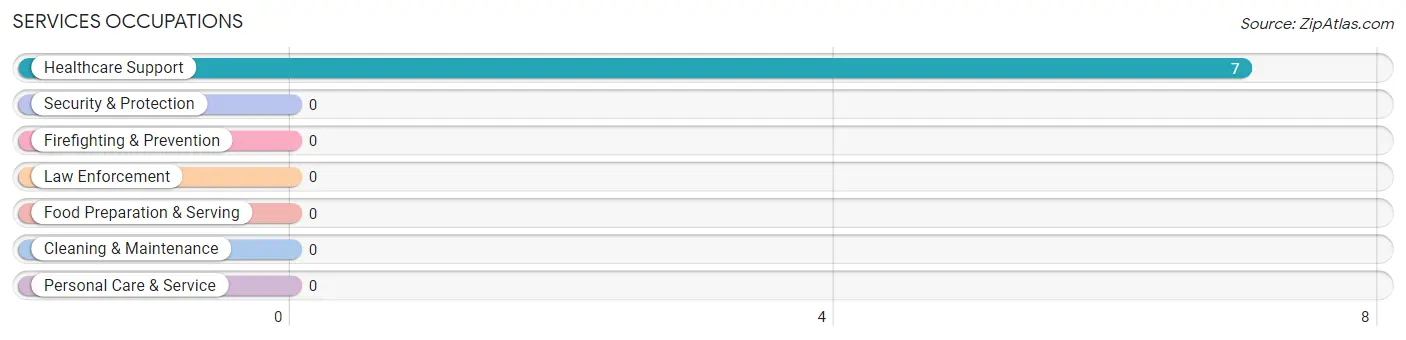
Services Occupations by Sex
| Occupation | Male | Female |
| Healthcare Support | 0 (0.0%) | 7 (100.0%) |
| Security & Protection | 0 (0.0%) | 0 (0.0%) |
| Firefighting & Prevention | 0 (0.0%) | 0 (0.0%) |
| Law Enforcement | 0 (0.0%) | 0 (0.0%) |
| Food Preparation & Serving | 0 (0.0%) | 0 (0.0%) |
| Cleaning & Maintenance | 0 (0.0%) | 0 (0.0%) |
| Personal Care & Service | 0 (0.0%) | 0 (0.0%) |
| Total (Category) | 0 (0.0%) | 7 (100.0%) |
| Total (Overall) | 128 (94.8%) | 7 (5.2%) |
Sales and Office Occupations
Sales and Office Occupations by Sex
| Occupation | Male | Female |
| Sales & Related | 0 (0.0%) | 0 (0.0%) |
| Office & Administration | 0 (0.0%) | 0 (0.0%) |
| Total (Category) | 0 (0.0%) | 0 (0.0%) |
| Total (Overall) | 128 (94.8%) | 7 (5.2%) |
Natural Resources, Construction and Maintenance Occupations
The most common Natural Resources, Construction and Maintenance occupations in Desert Shores are , and Farming, Fishing & Forestry (80 | 59.3%).
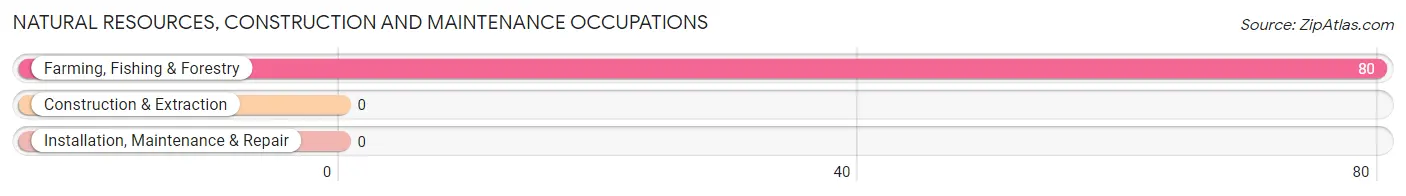
Natural Resources, Construction and Maintenance Occupations by Sex
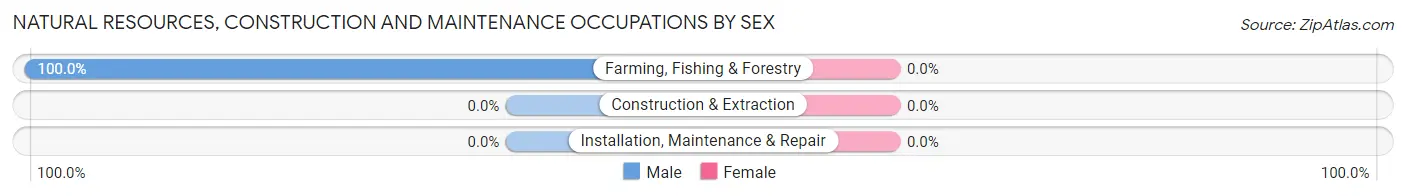
| Occupation | Male | Female |
| Farming, Fishing & Forestry | 80 (100.0%) | 0 (0.0%) |
| Construction & Extraction | 0 (0.0%) | 0 (0.0%) |
| Installation, Maintenance & Repair | 0 (0.0%) | 0 (0.0%) |
| Total (Category) | 80 (100.0%) | 0 (0.0%) |
| Total (Overall) | 128 (94.8%) | 7 (5.2%) |
Production, Transportation and Moving Occupations
The most common Production, Transportation and Moving occupations in Desert Shores are , and Material Moving (48 | 35.6%).
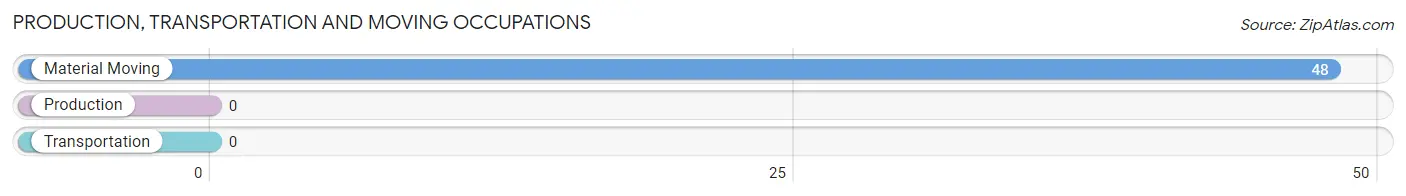
Production, Transportation and Moving Occupations by Sex
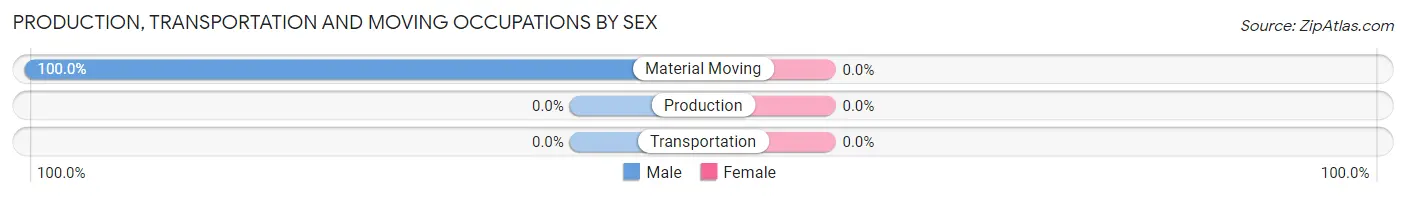
| Occupation | Male | Female |
| Production | 0 (0.0%) | 0 (0.0%) |
| Transportation | 0 (0.0%) | 0 (0.0%) |
| Material Moving | 48 (100.0%) | 0 (0.0%) |
| Total (Category) | 48 (100.0%) | 0 (0.0%) |
| Total (Overall) | 128 (94.8%) | 7 (5.2%) |
Employment Industries by Sex in Desert Shores
Employment Industries in Desert Shores
The major employment industries in Desert Shores include , and Agriculture, Fishing & Hunting (128 | 94.8%).
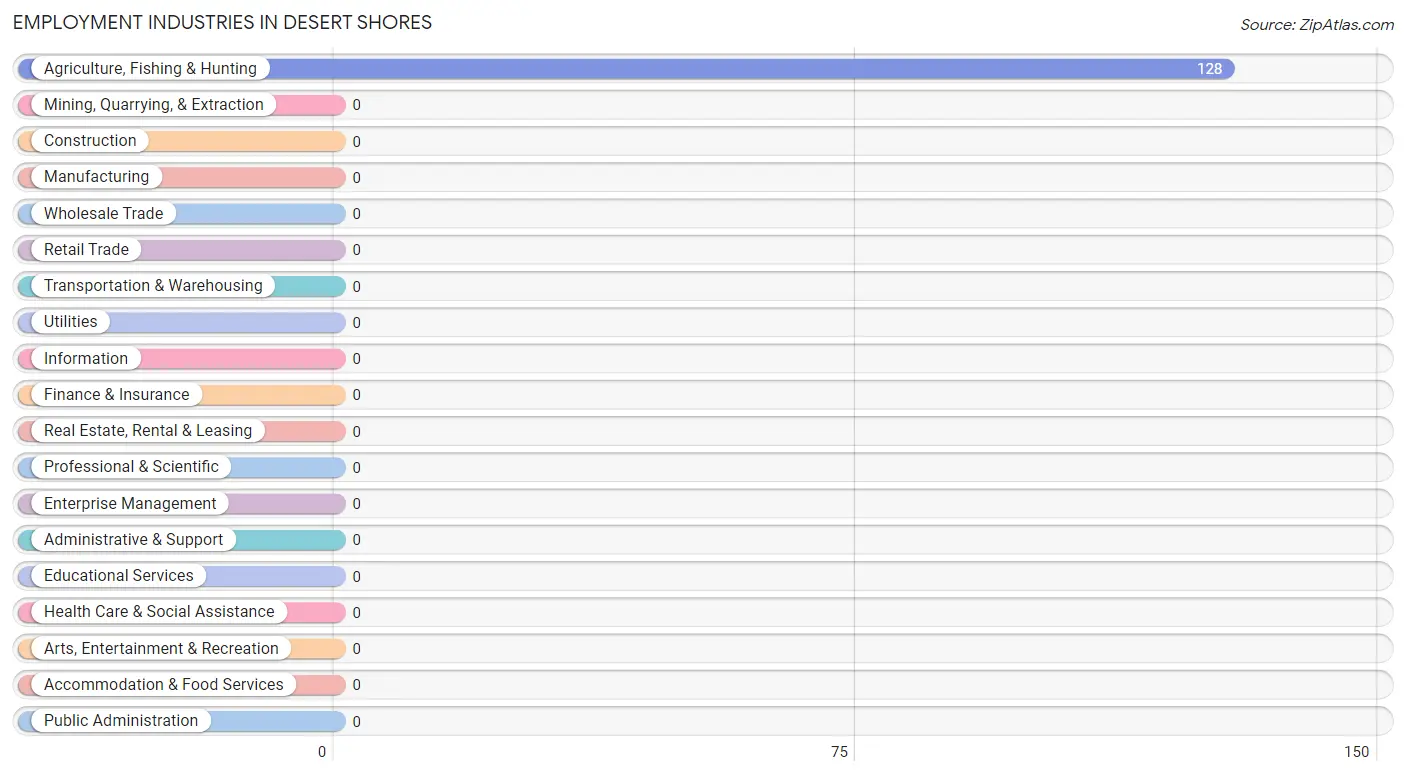
Employment Industries by Sex in Desert Shores
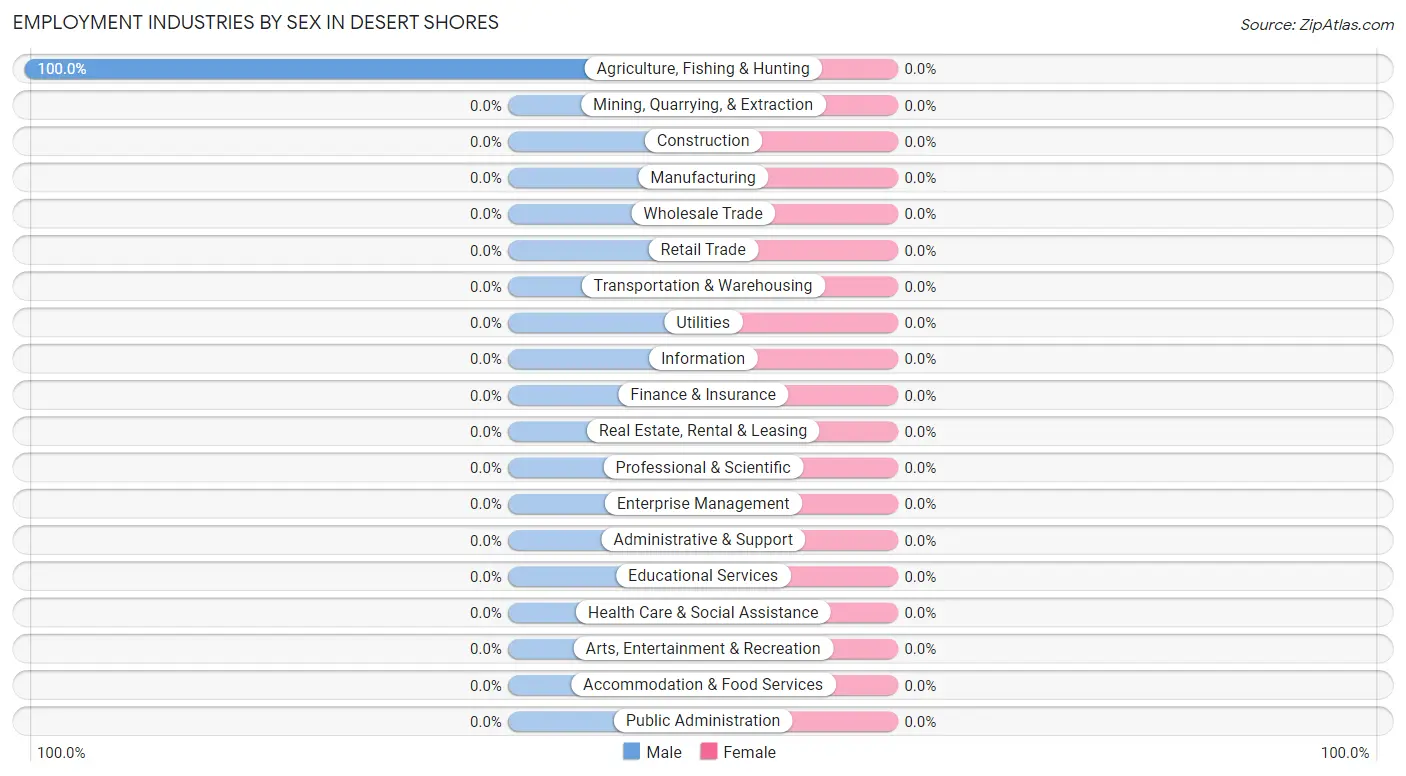
| Industry | Male | Female |
| Agriculture, Fishing & Hunting | 128 (100.0%) | 0 (0.0%) |
| Mining, Quarrying, & Extraction | 0 (0.0%) | 0 (0.0%) |
| Construction | 0 (0.0%) | 0 (0.0%) |
| Manufacturing | 0 (0.0%) | 0 (0.0%) |
| Wholesale Trade | 0 (0.0%) | 0 (0.0%) |
| Retail Trade | 0 (0.0%) | 0 (0.0%) |
| Transportation & Warehousing | 0 (0.0%) | 0 (0.0%) |
| Utilities | 0 (0.0%) | 0 (0.0%) |
| Information | 0 (0.0%) | 0 (0.0%) |
| Finance & Insurance | 0 (0.0%) | 0 (0.0%) |
| Real Estate, Rental & Leasing | 0 (0.0%) | 0 (0.0%) |
| Professional & Scientific | 0 (0.0%) | 0 (0.0%) |
| Enterprise Management | 0 (0.0%) | 0 (0.0%) |
| Administrative & Support | 0 (0.0%) | 0 (0.0%) |
| Educational Services | 0 (0.0%) | 0 (0.0%) |
| Health Care & Social Assistance | 0 (0.0%) | 0 (0.0%) |
| Arts, Entertainment & Recreation | 0 (0.0%) | 0 (0.0%) |
| Accommodation & Food Services | 0 (0.0%) | 0 (0.0%) |
| Public Administration | 0 (0.0%) | 0 (0.0%) |
| Total | 128 (94.8%) | 7 (5.2%) |
Education in Desert Shores
School Enrollment in Desert Shores
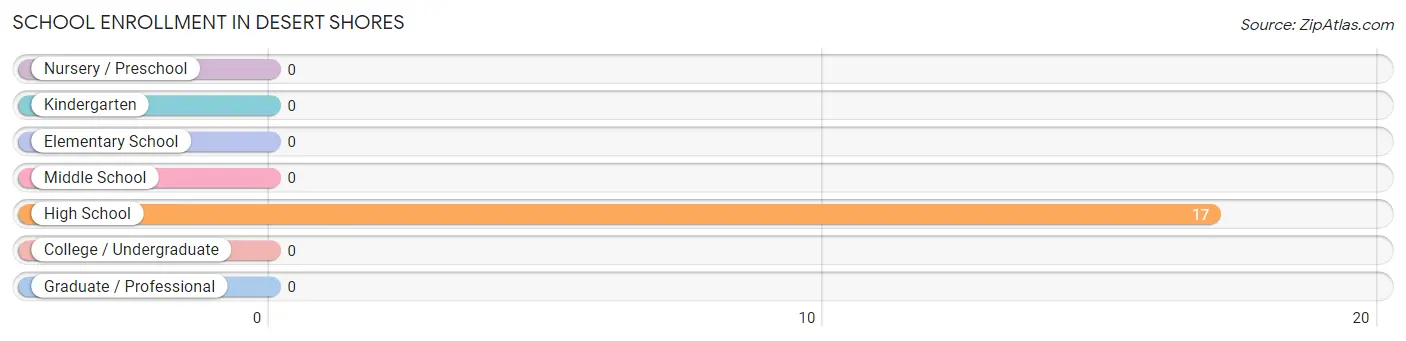
| School Level | # Students | % Students |
| Nursery / Preschool | 0 | 0.0% |
| Kindergarten | 0 | 0.0% |
| Elementary School | 0 | 0.0% |
| Middle School | 0 | 0.0% |
| High School | 17 | 100.0% |
| College / Undergraduate | 0 | 0.0% |
| Graduate / Professional | 0 | 0.0% |
| Total | 17 | 100.0% |
School Enrollment by Age by Funding Source in Desert Shores
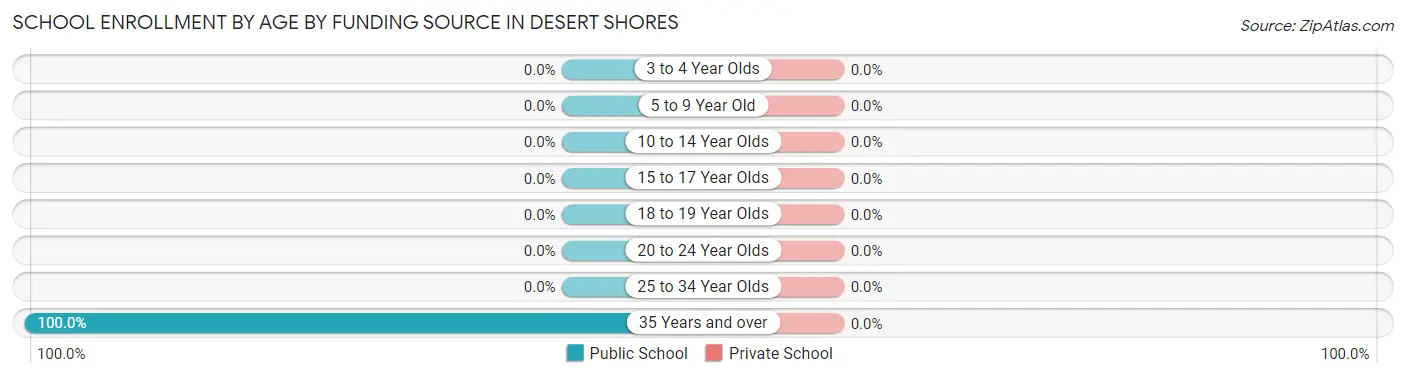
| Age Bracket | Public School | Private School |
| 3 to 4 Year Olds | 0 (0.0%) | 0 (0.0%) |
| 5 to 9 Year Old | 0 (0.0%) | 0 (0.0%) |
| 10 to 14 Year Olds | 0 (0.0%) | 0 (0.0%) |
| 15 to 17 Year Olds | 0 (0.0%) | 0 (0.0%) |
| 18 to 19 Year Olds | 0 (0.0%) | 0 (0.0%) |
| 20 to 24 Year Olds | 0 (0.0%) | 0 (0.0%) |
| 25 to 34 Year Olds | 0 (0.0%) | 0 (0.0%) |
| 35 Years and over | 17 (100.0%) | 0 (0.0%) |
| Total | 17 (100.0%) | 0 (0.0%) |
Educational Attainment by Field of Study in Desert Shores
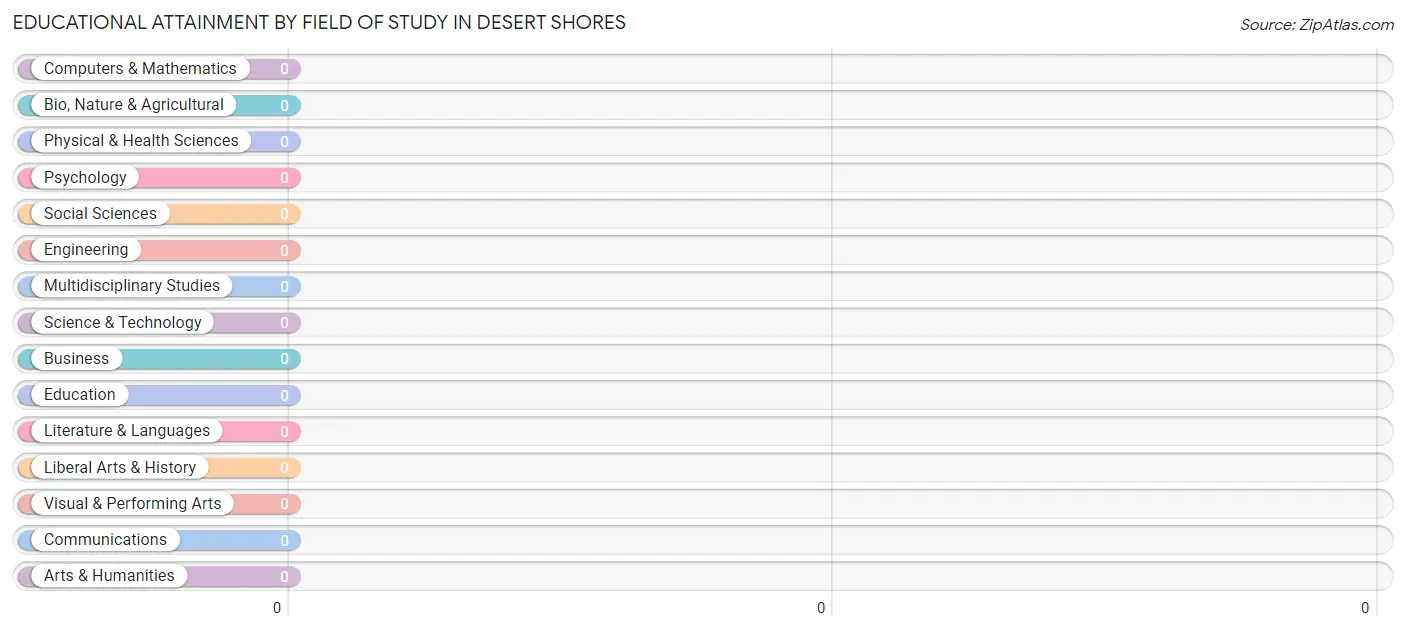
| Field of Study | # Graduates | % Graduates |
| Computers & Mathematics | 0 | 0.0% |
| Bio, Nature & Agricultural | 0 | 0.0% |
| Physical & Health Sciences | 0 | 0.0% |
| Psychology | 0 | 0.0% |
| Social Sciences | 0 | 0.0% |
| Engineering | 0 | 0.0% |
| Multidisciplinary Studies | 0 | 0.0% |
| Science & Technology | 0 | 0.0% |
| Business | 0 | 0.0% |
| Education | 0 | 0.0% |
| Literature & Languages | 0 | 0.0% |
| Liberal Arts & History | 0 | 0.0% |
| Visual & Performing Arts | 0 | 0.0% |
| Communications | 0 | 0.0% |
| Arts & Humanities | 0 | 0.0% |
| Total | 0 | 0.0% |
Transportation & Commute in Desert Shores
Vehicle Availability by Sex in Desert Shores
The most prevalent vehicle ownership categories in Desert Shores are males with 1 vehicle (68, accounting for 53.1%) and females with 1 vehicle (7, making up 971.4%).
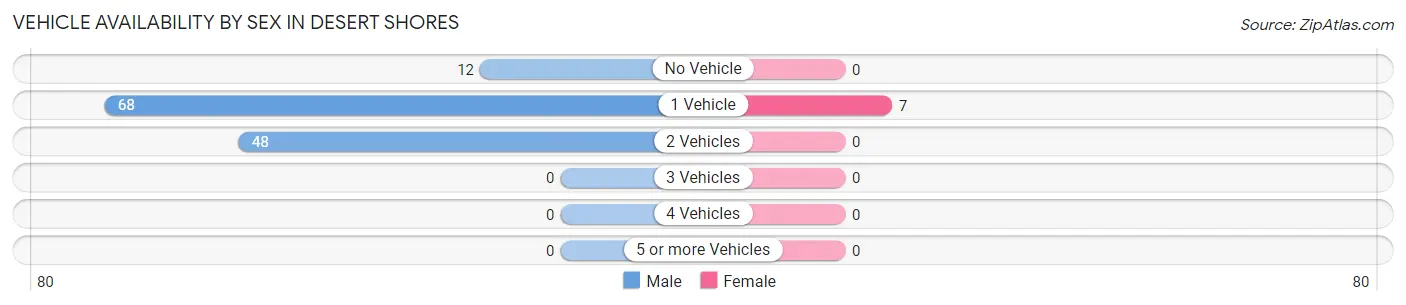
| Vehicles Available | Male | Female |
| No Vehicle | 12 (9.4%) | 0 (0.0%) |
| 1 Vehicle | 68 (53.1%) | 7 (100.0%) |
| 2 Vehicles | 48 (37.5%) | 0 (0.0%) |
| 3 Vehicles | 0 (0.0%) | 0 (0.0%) |
| 4 Vehicles | 0 (0.0%) | 0 (0.0%) |
| 5 or more Vehicles | 0 (0.0%) | 0 (0.0%) |
| Total | 128 (100.0%) | 7 (100.0%) |
Commute Time in Desert Shores
The most frequently occuring commute durations in Desert Shores are 20 to 24 minutes (48 commuters, 39.0%), 25 to 29 minutes (48 commuters, 39.0%), and 15 to 19 minutes (20 commuters, 16.3%).
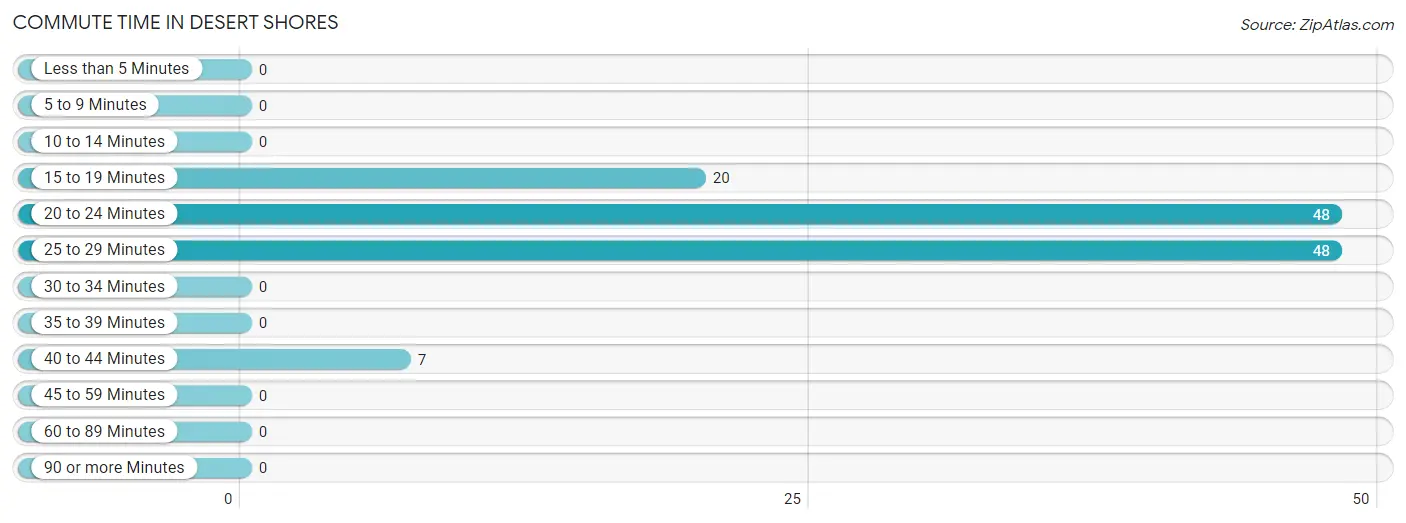
| Commute Time | # Commuters | % Commuters |
| Less than 5 Minutes | 0 | 0.0% |
| 5 to 9 Minutes | 0 | 0.0% |
| 10 to 14 Minutes | 0 | 0.0% |
| 15 to 19 Minutes | 20 | 16.3% |
| 20 to 24 Minutes | 48 | 39.0% |
| 25 to 29 Minutes | 48 | 39.0% |
| 30 to 34 Minutes | 0 | 0.0% |
| 35 to 39 Minutes | 0 | 0.0% |
| 40 to 44 Minutes | 7 | 5.7% |
| 45 to 59 Minutes | 0 | 0.0% |
| 60 to 89 Minutes | 0 | 0.0% |
| 90 or more Minutes | 0 | 0.0% |
Commute Time by Sex in Desert Shores
The most common commute times in Desert Shores are 20 to 24 minutes (48 commuters, 41.4%) for males and 40 to 44 minutes (7 commuters, 100.0%) for females.
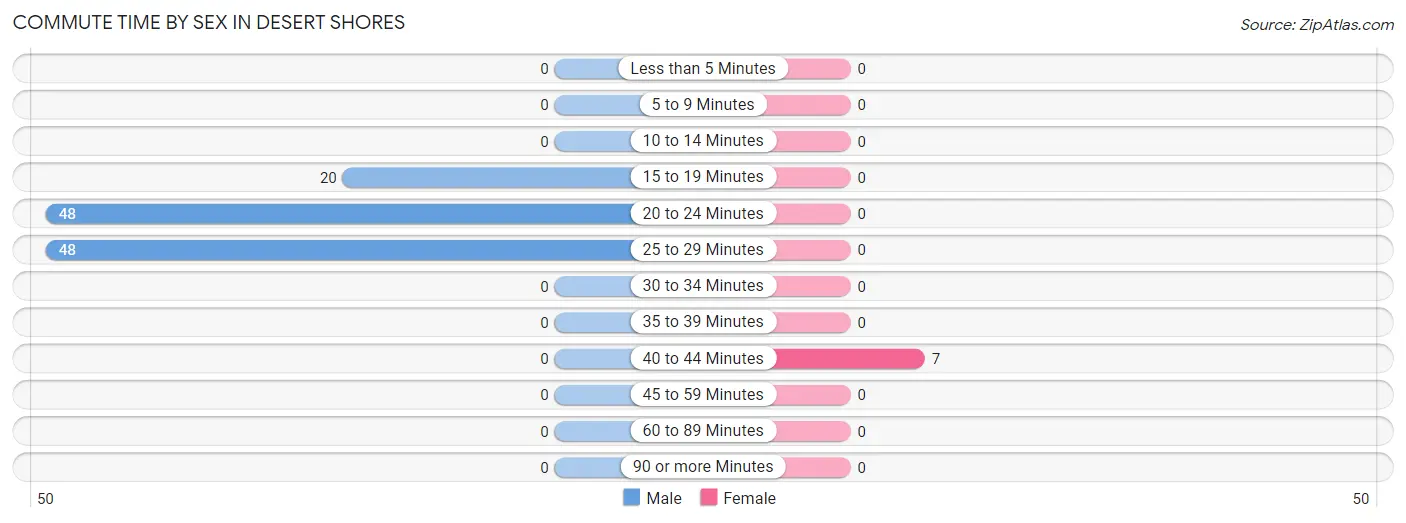
| Commute Time | Male | Female |
| Less than 5 Minutes | 0 (0.0%) | 0 (0.0%) |
| 5 to 9 Minutes | 0 (0.0%) | 0 (0.0%) |
| 10 to 14 Minutes | 0 (0.0%) | 0 (0.0%) |
| 15 to 19 Minutes | 20 (17.2%) | 0 (0.0%) |
| 20 to 24 Minutes | 48 (41.4%) | 0 (0.0%) |
| 25 to 29 Minutes | 48 (41.4%) | 0 (0.0%) |
| 30 to 34 Minutes | 0 (0.0%) | 0 (0.0%) |
| 35 to 39 Minutes | 0 (0.0%) | 0 (0.0%) |
| 40 to 44 Minutes | 0 (0.0%) | 7 (100.0%) |
| 45 to 59 Minutes | 0 (0.0%) | 0 (0.0%) |
| 60 to 89 Minutes | 0 (0.0%) | 0 (0.0%) |
| 90 or more Minutes | 0 (0.0%) | 0 (0.0%) |
Time of Departure to Work by Sex in Desert Shores
The most frequent times of departure to work in Desert Shores are 5:00 AM to 5:29 AM (48, 41.4%) for males and 9:00 AM to 9:59 AM (7, 100.0%) for females.
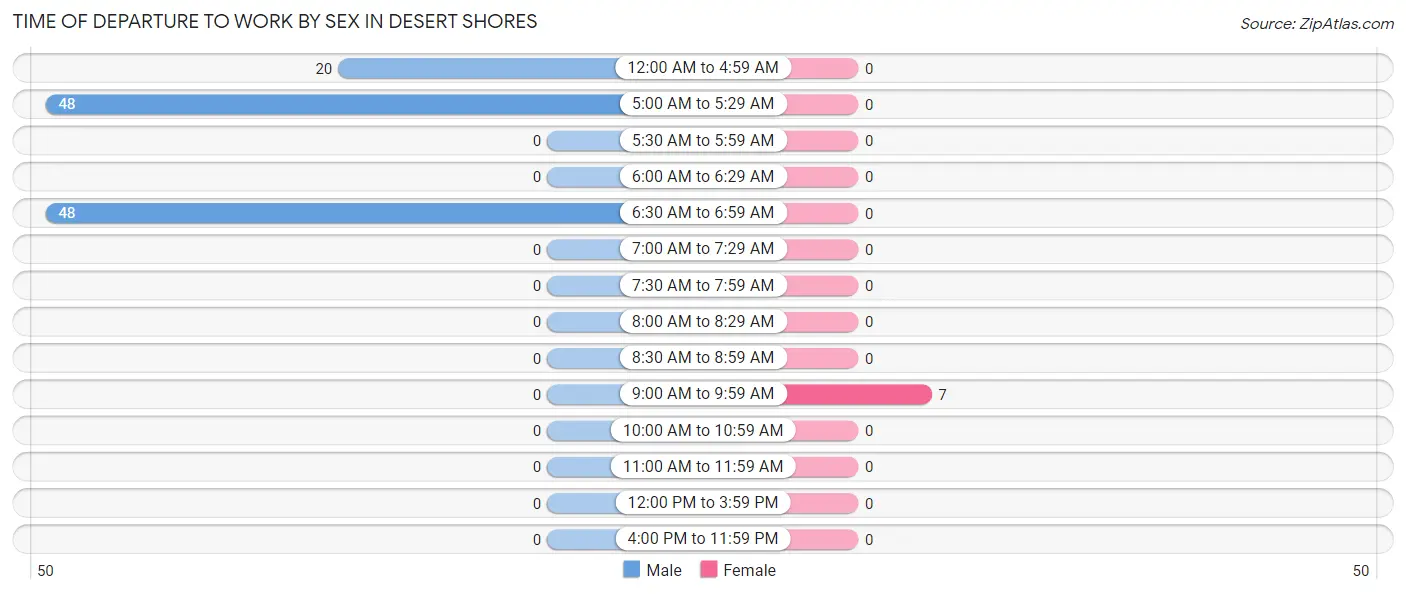
| Time of Departure | Male | Female |
| 12:00 AM to 4:59 AM | 20 (17.2%) | 0 (0.0%) |
| 5:00 AM to 5:29 AM | 48 (41.4%) | 0 (0.0%) |
| 5:30 AM to 5:59 AM | 0 (0.0%) | 0 (0.0%) |
| 6:00 AM to 6:29 AM | 0 (0.0%) | 0 (0.0%) |
| 6:30 AM to 6:59 AM | 48 (41.4%) | 0 (0.0%) |
| 7:00 AM to 7:29 AM | 0 (0.0%) | 0 (0.0%) |
| 7:30 AM to 7:59 AM | 0 (0.0%) | 0 (0.0%) |
| 8:00 AM to 8:29 AM | 0 (0.0%) | 0 (0.0%) |
| 8:30 AM to 8:59 AM | 0 (0.0%) | 0 (0.0%) |
| 9:00 AM to 9:59 AM | 0 (0.0%) | 7 (100.0%) |
| 10:00 AM to 10:59 AM | 0 (0.0%) | 0 (0.0%) |
| 11:00 AM to 11:59 AM | 0 (0.0%) | 0 (0.0%) |
| 12:00 PM to 3:59 PM | 0 (0.0%) | 0 (0.0%) |
| 4:00 PM to 11:59 PM | 0 (0.0%) | 0 (0.0%) |
| Total | 116 (100.0%) | 7 (100.0%) |
Housing Occupancy in Desert Shores
Occupancy by Ownership in Desert Shores
Of the total 216 dwellings in Desert Shores, owner-occupied units account for 205 (94.9%), while renter-occupied units make up 11 (5.1%).
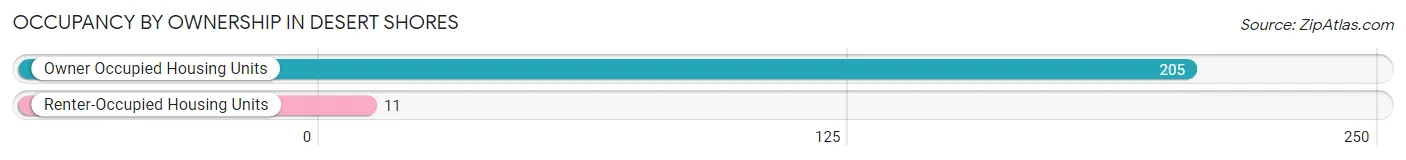
| Occupancy | # Housing Units | % Housing Units |
| Owner Occupied Housing Units | 205 | 94.9% |
| Renter-Occupied Housing Units | 11 | 5.1% |
| Total Occupied Housing Units | 216 | 100.0% |
Occupancy by Household Size in Desert Shores
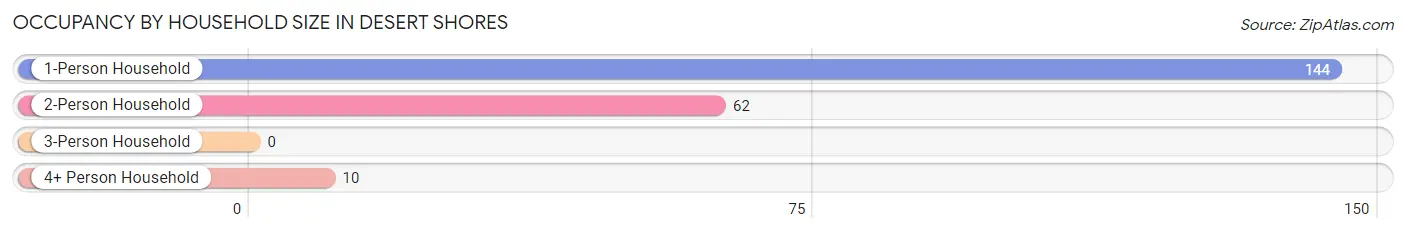
| Household Size | # Housing Units | % Housing Units |
| 1-Person Household | 144 | 66.7% |
| 2-Person Household | 62 | 28.7% |
| 3-Person Household | 0 | 0.0% |
| 4+ Person Household | 10 | 4.6% |
| Total Housing Units | 216 | 100.0% |
Occupancy by Ownership by Household Size in Desert Shores
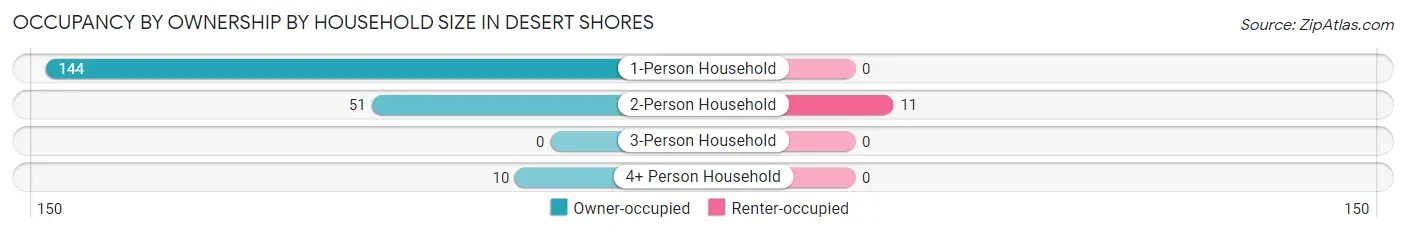
| Household Size | Owner-occupied | Renter-occupied |
| 1-Person Household | 144 (100.0%) | 0 (0.0%) |
| 2-Person Household | 51 (82.3%) | 11 (17.7%) |
| 3-Person Household | 0 (0.0%) | 0 (0.0%) |
| 4+ Person Household | 10 (100.0%) | 0 (0.0%) |
| Total Housing Units | 205 (94.9%) | 11 (5.1%) |
Occupancy by Educational Attainment in Desert Shores
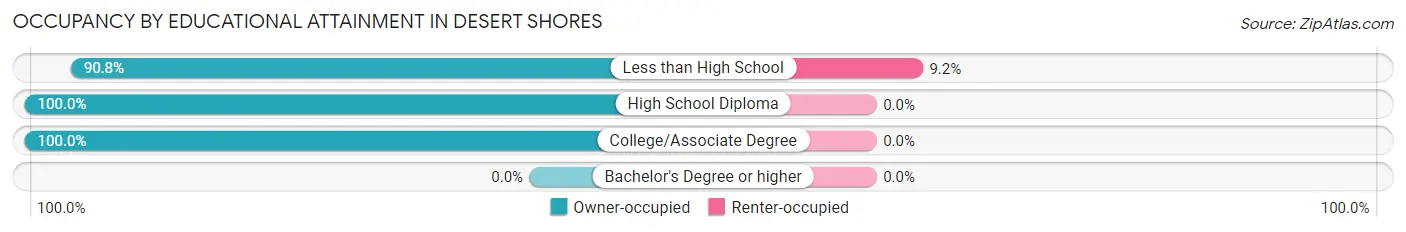
| Household Size | Owner-occupied | Renter-occupied |
| Less than High School | 109 (90.8%) | 11 (9.2%) |
| High School Diploma | 78 (100.0%) | 0 (0.0%) |
| College/Associate Degree | 18 (100.0%) | 0 (0.0%) |
| Bachelor's Degree or higher | 0 (0.0%) | 0 (0.0%) |
Occupancy by Age of Householder in Desert Shores
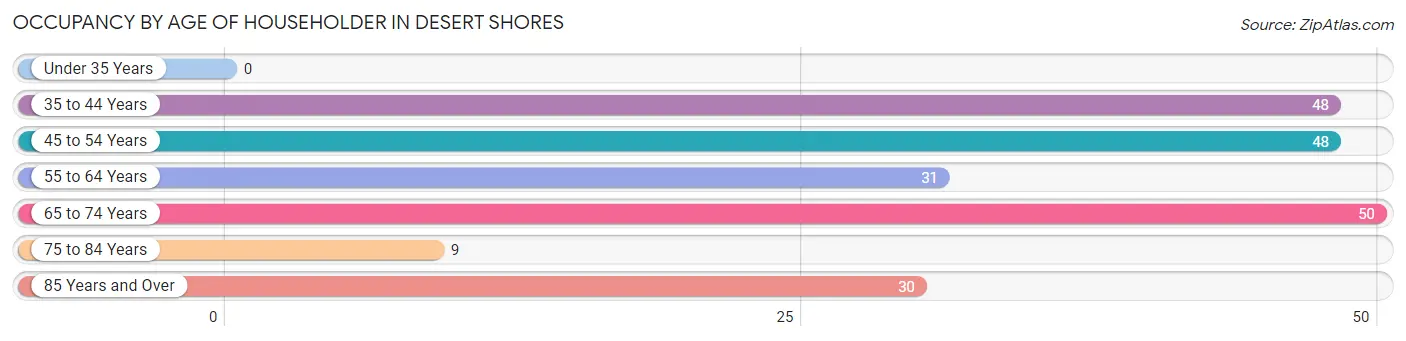
| Age Bracket | # Households | % Households |
| Under 35 Years | 0 | 0.0% |
| 35 to 44 Years | 48 | 22.2% |
| 45 to 54 Years | 48 | 22.2% |
| 55 to 64 Years | 31 | 14.3% |
| 65 to 74 Years | 50 | 23.2% |
| 75 to 84 Years | 9 | 4.2% |
| 85 Years and Over | 30 | 13.9% |
| Total | 216 | 100.0% |
Housing Finances in Desert Shores
Median Income by Occupancy in Desert Shores
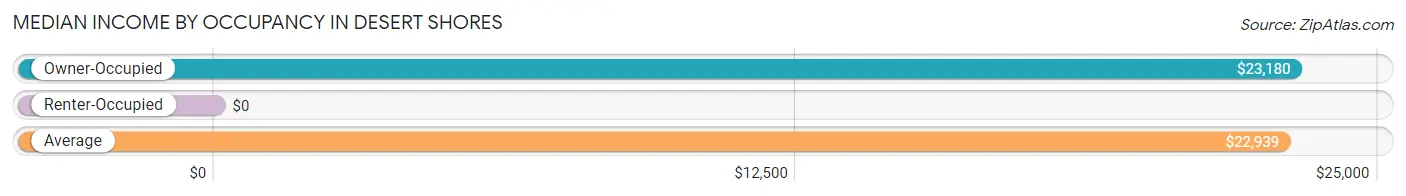
| Occupancy Type | # Households | Median Income |
| Owner-Occupied | 205 (94.9%) | $23,180 |
| Renter-Occupied | 11 (5.1%) | $0 |
| Average | 216 (100.0%) | $22,939 |
Occupancy by Householder Income Bracket in Desert Shores
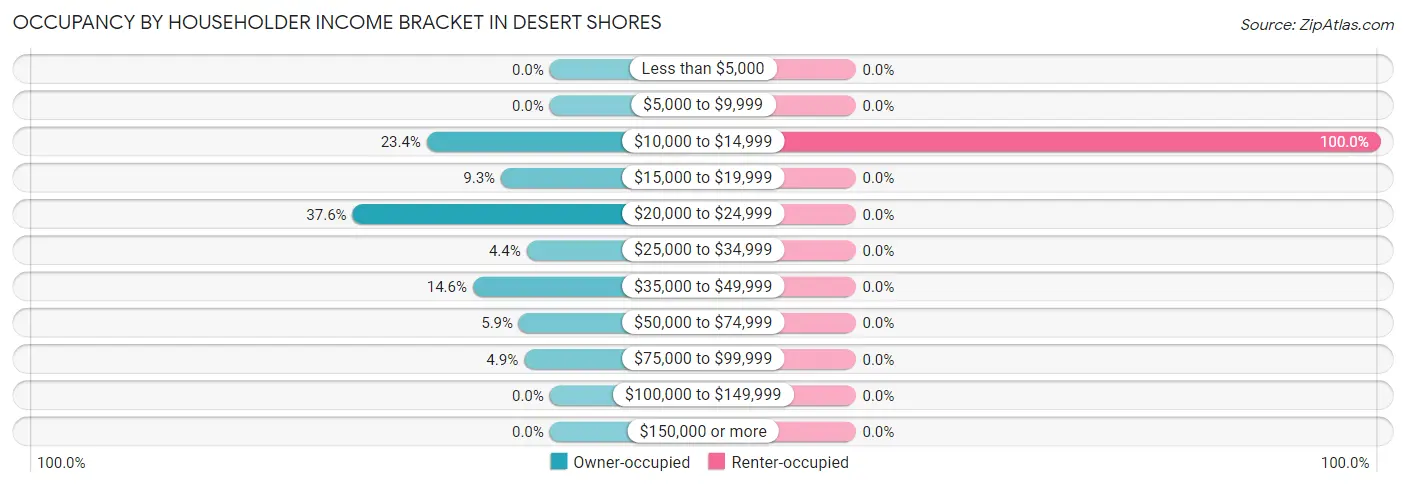
| Income Bracket | Owner-occupied | Renter-occupied |
| Less than $5,000 | 0 (0.0%) | 0 (0.0%) |
| $5,000 to $9,999 | 0 (0.0%) | 0 (0.0%) |
| $10,000 to $14,999 | 48 (23.4%) | 11 (100.0%) |
| $15,000 to $19,999 | 19 (9.3%) | 0 (0.0%) |
| $20,000 to $24,999 | 77 (37.6%) | 0 (0.0%) |
| $25,000 to $34,999 | 9 (4.4%) | 0 (0.0%) |
| $35,000 to $49,999 | 30 (14.6%) | 0 (0.0%) |
| $50,000 to $74,999 | 12 (5.9%) | 0 (0.0%) |
| $75,000 to $99,999 | 10 (4.9%) | 0 (0.0%) |
| $100,000 to $149,999 | 0 (0.0%) | 0 (0.0%) |
| $150,000 or more | 0 (0.0%) | 0 (0.0%) |
| Total | 205 (100.0%) | 11 (100.0%) |
Monthly Housing Cost Tiers in Desert Shores
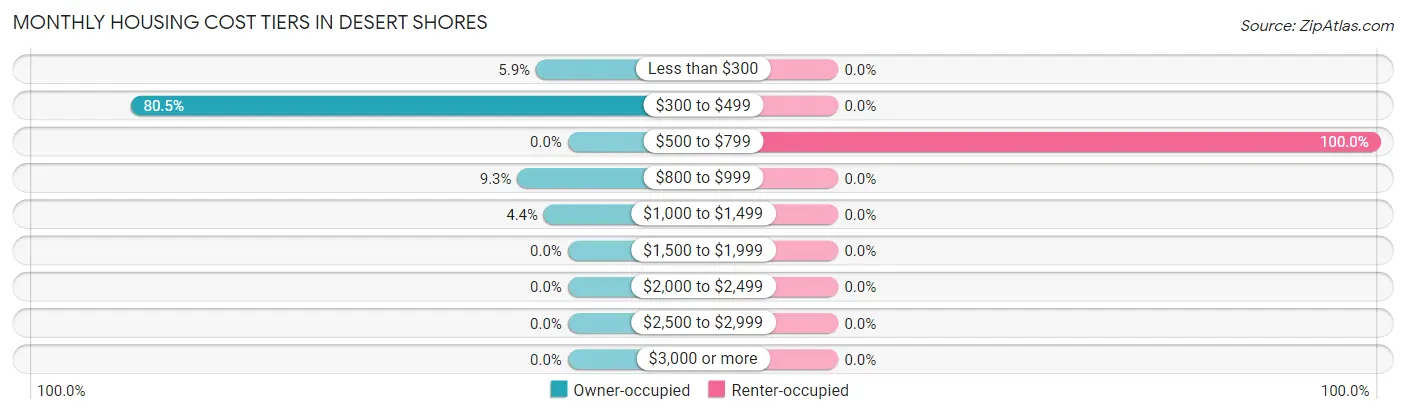
| Monthly Cost | Owner-occupied | Renter-occupied |
| Less than $300 | 12 (5.9%) | 0 (0.0%) |
| $300 to $499 | 165 (80.5%) | 0 (0.0%) |
| $500 to $799 | 0 (0.0%) | 11 (100.0%) |
| $800 to $999 | 19 (9.3%) | 0 (0.0%) |
| $1,000 to $1,499 | 9 (4.4%) | 0 (0.0%) |
| $1,500 to $1,999 | 0 (0.0%) | 0 (0.0%) |
| $2,000 to $2,499 | 0 (0.0%) | 0 (0.0%) |
| $2,500 to $2,999 | 0 (0.0%) | 0 (0.0%) |
| $3,000 or more | 0 (0.0%) | 0 (0.0%) |
| Total | 205 (100.0%) | 11 (100.0%) |
Physical Housing Characteristics in Desert Shores
Housing Structures in Desert Shores
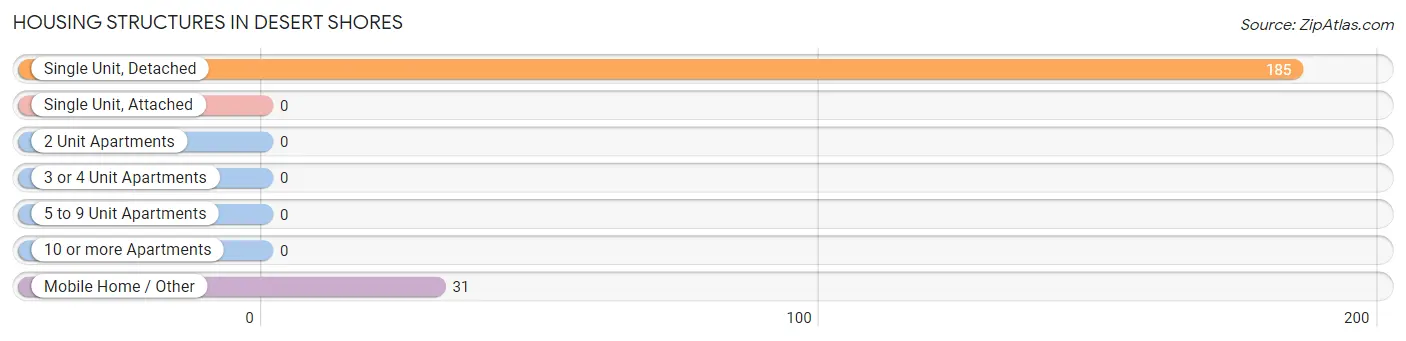
| Structure Type | # Housing Units | % Housing Units |
| Single Unit, Detached | 185 | 85.7% |
| Single Unit, Attached | 0 | 0.0% |
| 2 Unit Apartments | 0 | 0.0% |
| 3 or 4 Unit Apartments | 0 | 0.0% |
| 5 to 9 Unit Apartments | 0 | 0.0% |
| 10 or more Apartments | 0 | 0.0% |
| Mobile Home / Other | 31 | 14.3% |
| Total | 216 | 100.0% |
Housing Structures by Occupancy in Desert Shores
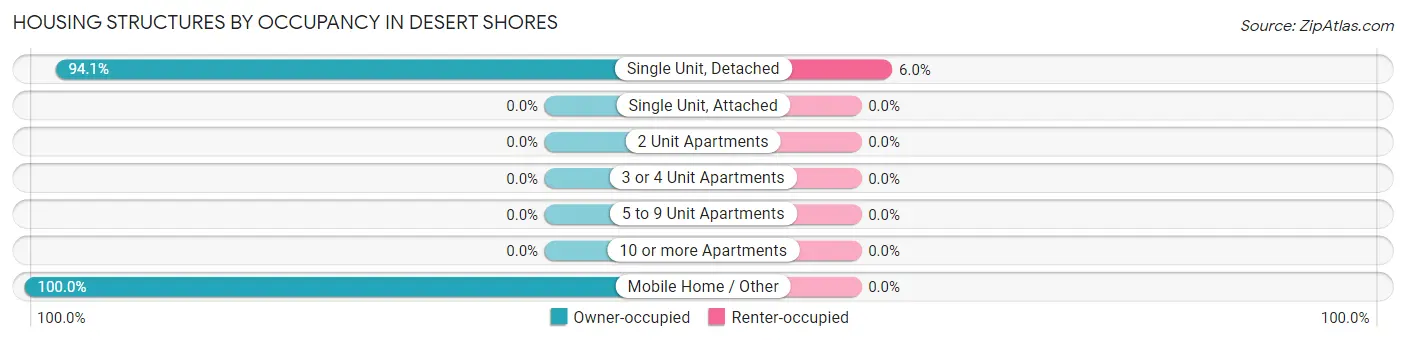
| Structure Type | Owner-occupied | Renter-occupied |
| Single Unit, Detached | 174 (94.1%) | 11 (5.9%) |
| Single Unit, Attached | 0 (0.0%) | 0 (0.0%) |
| 2 Unit Apartments | 0 (0.0%) | 0 (0.0%) |
| 3 or 4 Unit Apartments | 0 (0.0%) | 0 (0.0%) |
| 5 to 9 Unit Apartments | 0 (0.0%) | 0 (0.0%) |
| 10 or more Apartments | 0 (0.0%) | 0 (0.0%) |
| Mobile Home / Other | 31 (100.0%) | 0 (0.0%) |
| Total | 205 (94.9%) | 11 (5.1%) |
Housing Structures by Number of Rooms in Desert Shores
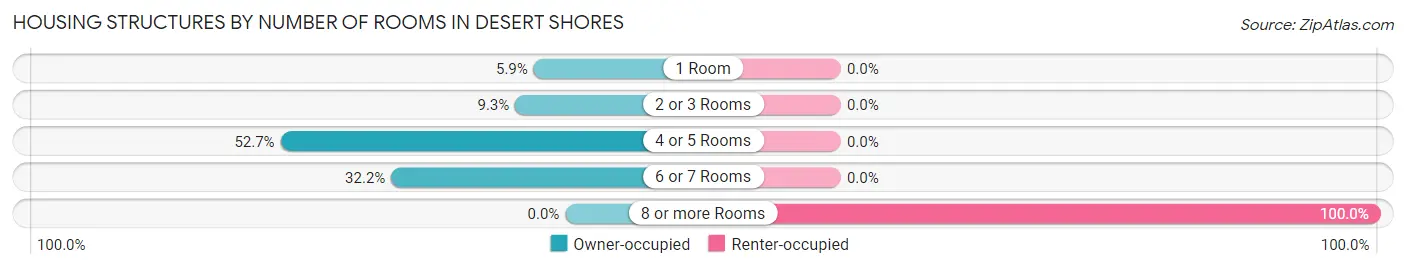
| Number of Rooms | Owner-occupied | Renter-occupied |
| 1 Room | 12 (5.9%) | 0 (0.0%) |
| 2 or 3 Rooms | 19 (9.3%) | 0 (0.0%) |
| 4 or 5 Rooms | 108 (52.7%) | 0 (0.0%) |
| 6 or 7 Rooms | 66 (32.2%) | 0 (0.0%) |
| 8 or more Rooms | 0 (0.0%) | 11 (100.0%) |
| Total | 205 (100.0%) | 11 (100.0%) |
Housing Structure by Heating Type in Desert Shores
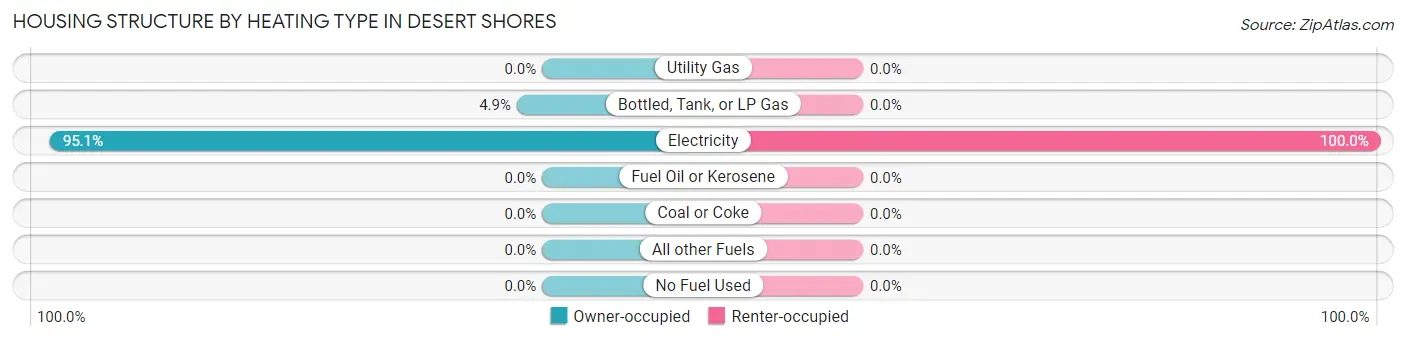
| Heating Type | Owner-occupied | Renter-occupied |
| Utility Gas | 0 (0.0%) | 0 (0.0%) |
| Bottled, Tank, or LP Gas | 10 (4.9%) | 0 (0.0%) |
| Electricity | 195 (95.1%) | 11 (100.0%) |
| Fuel Oil or Kerosene | 0 (0.0%) | 0 (0.0%) |
| Coal or Coke | 0 (0.0%) | 0 (0.0%) |
| All other Fuels | 0 (0.0%) | 0 (0.0%) |
| No Fuel Used | 0 (0.0%) | 0 (0.0%) |
| Total | 205 (100.0%) | 11 (100.0%) |
Household Vehicle Usage in Desert Shores
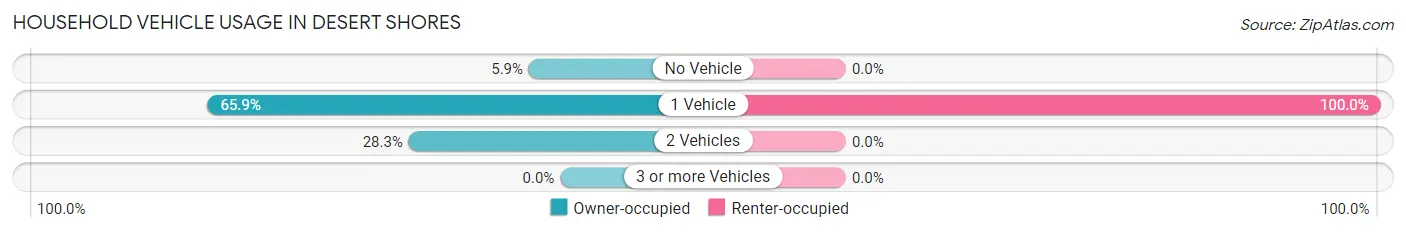
| Vehicles per Household | Owner-occupied | Renter-occupied |
| No Vehicle | 12 (5.9%) | 0 (0.0%) |
| 1 Vehicle | 135 (65.8%) | 11 (100.0%) |
| 2 Vehicles | 58 (28.3%) | 0 (0.0%) |
| 3 or more Vehicles | 0 (0.0%) | 0 (0.0%) |
| Total | 205 (100.0%) | 11 (100.0%) |
Real Estate & Mortgages in Desert Shores
Real Estate and Mortgage Overview in Desert Shores
| Characteristic | Without Mortgage | With Mortgage |
| Housing Units | 196 | 9 |
| Median Property Value | $107,500 | $0 |
| Median Household Income | $22,982 | $0 |
| Monthly Housing Costs | $393 | $0 |
| Real Estate Taxes | $1,695 | $0 |
Property Value by Mortgage Status in Desert Shores
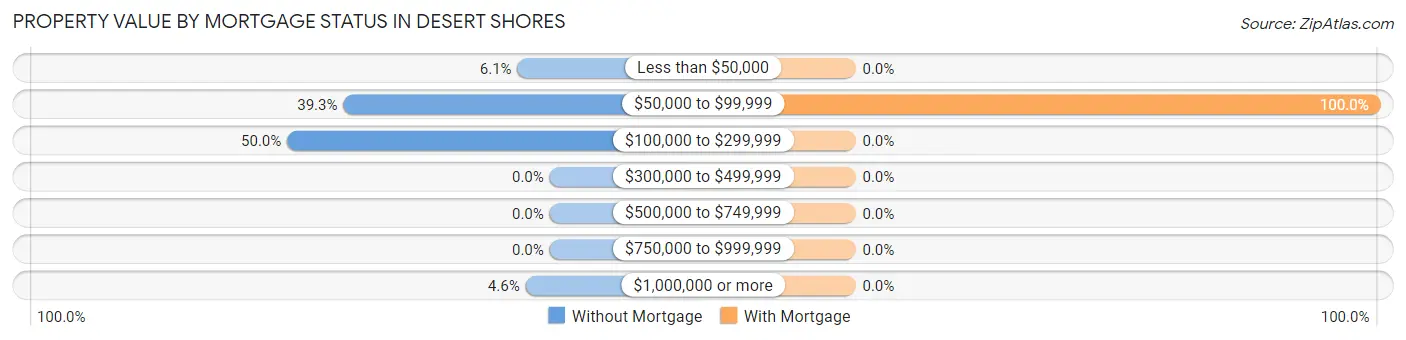
| Property Value | Without Mortgage | With Mortgage |
| Less than $50,000 | 12 (6.1%) | 0 (0.0%) |
| $50,000 to $99,999 | 77 (39.3%) | 9 (100.0%) |
| $100,000 to $299,999 | 98 (50.0%) | 0 (0.0%) |
| $300,000 to $499,999 | 0 (0.0%) | 0 (0.0%) |
| $500,000 to $749,999 | 0 (0.0%) | 0 (0.0%) |
| $750,000 to $999,999 | 0 (0.0%) | 0 (0.0%) |
| $1,000,000 or more | 9 (4.6%) | 0 (0.0%) |
| Total | 196 (100.0%) | 9 (100.0%) |
Household Income by Mortgage Status in Desert Shores
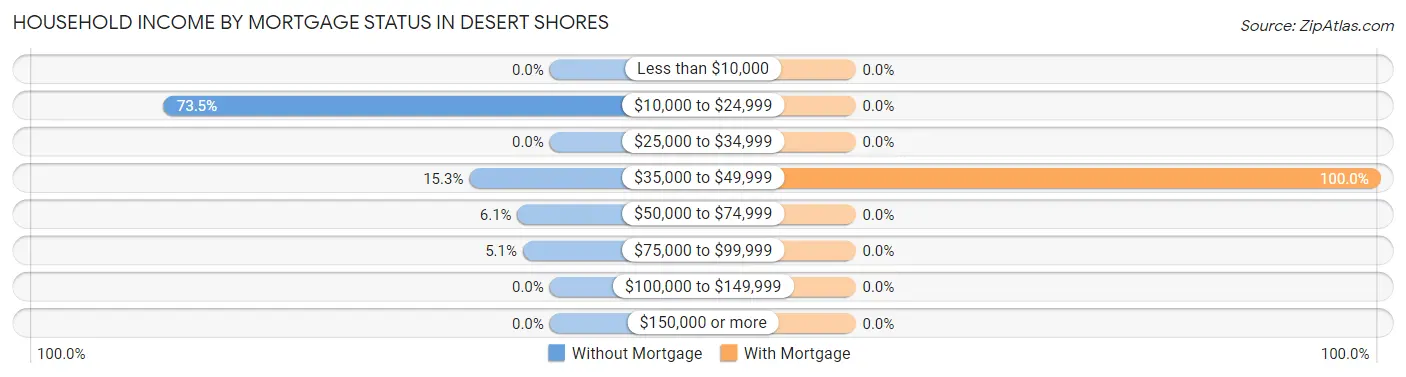
| Household Income | Without Mortgage | With Mortgage |
| Less than $10,000 | 0 (0.0%) | 0 (0.0%) |
| $10,000 to $24,999 | 144 (73.5%) | 0 (0.0%) |
| $25,000 to $34,999 | 0 (0.0%) | 0 (0.0%) |
| $35,000 to $49,999 | 30 (15.3%) | 9 (100.0%) |
| $50,000 to $74,999 | 12 (6.1%) | 0 (0.0%) |
| $75,000 to $99,999 | 10 (5.1%) | 0 (0.0%) |
| $100,000 to $149,999 | 0 (0.0%) | 0 (0.0%) |
| $150,000 or more | 0 (0.0%) | 0 (0.0%) |
| Total | 196 (100.0%) | 9 (100.0%) |
Property Value to Household Income Ratio in Desert Shores
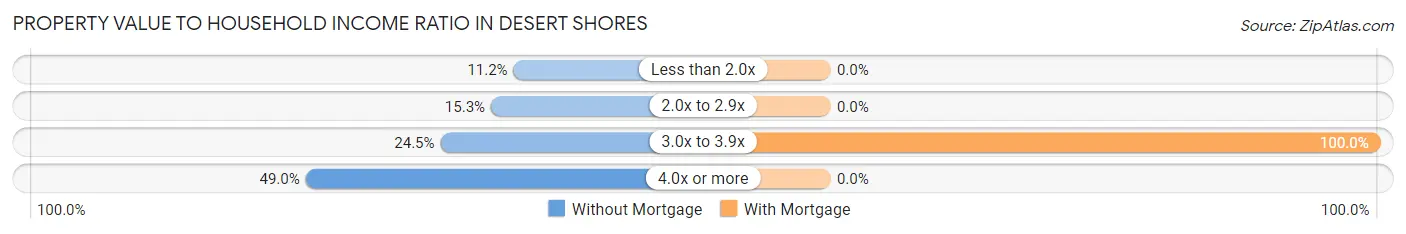
| Value-to-Income Ratio | Without Mortgage | With Mortgage |
| Less than 2.0x | 22 (11.2%) | 0 (0.0%) |
| 2.0x to 2.9x | 30 (15.3%) | 0 (0.0%) |
| 3.0x to 3.9x | 48 (24.5%) | 9 (100.0%) |
| 4.0x or more | 96 (49.0%) | 0 (0.0%) |
| Total | 196 (100.0%) | 9 (100.0%) |
Real Estate Taxes by Mortgage Status in Desert Shores
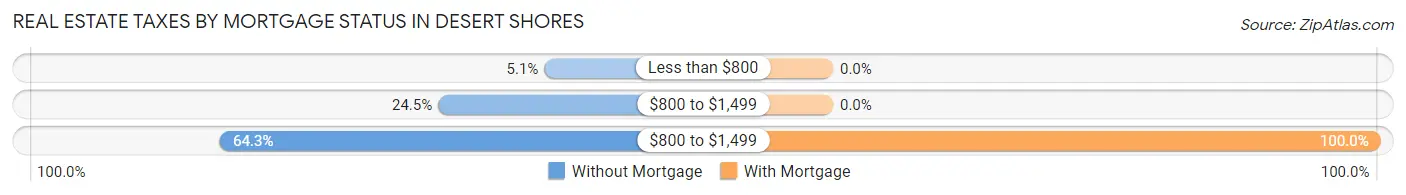
| Property Taxes | Without Mortgage | With Mortgage |
| Less than $800 | 10 (5.1%) | 0 (0.0%) |
| $800 to $1,499 | 48 (24.5%) | 0 (0.0%) |
| $800 to $1,499 | 126 (64.3%) | 9 (100.0%) |
| Total | 196 (100.0%) | 9 (100.0%) |
Health & Disability in Desert Shores
Health Insurance Coverage by Age in Desert Shores
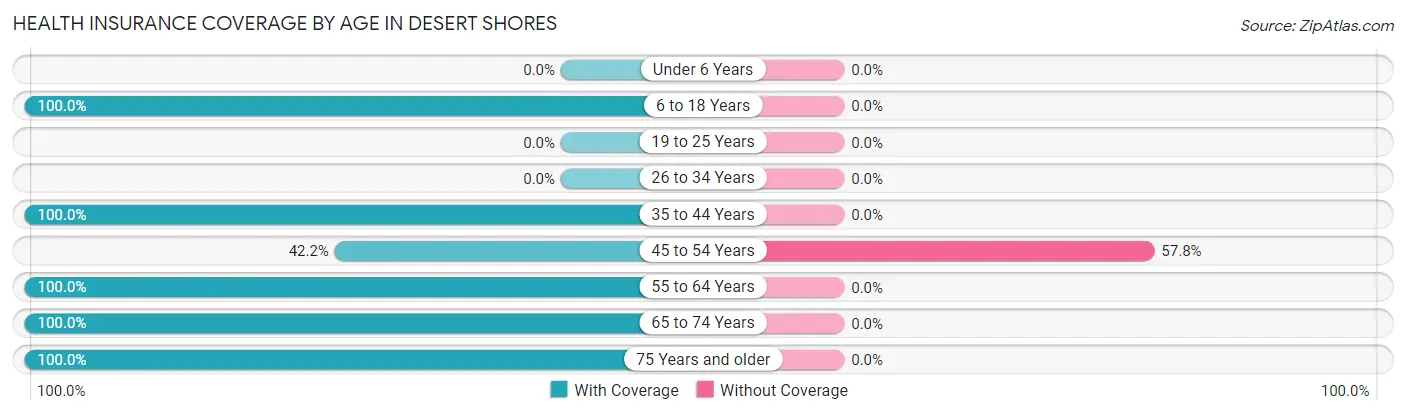
| Age Bracket | With Coverage | Without Coverage |
| Under 6 Years | 0 (0.0%) | 0 (0.0%) |
| 6 to 18 Years | 15 (100.0%) | 0 (0.0%) |
| 19 to 25 Years | 0 (0.0%) | 0 (0.0%) |
| 26 to 34 Years | 0 (0.0%) | 0 (0.0%) |
| 35 to 44 Years | 88 (100.0%) | 0 (0.0%) |
| 45 to 54 Years | 35 (42.2%) | 48 (57.8%) |
| 55 to 64 Years | 31 (100.0%) | 0 (0.0%) |
| 65 to 74 Years | 57 (100.0%) | 0 (0.0%) |
| 75 Years and older | 86 (100.0%) | 0 (0.0%) |
| Total | 312 (86.7%) | 48 (13.3%) |
Health Insurance Coverage by Citizenship Status in Desert Shores
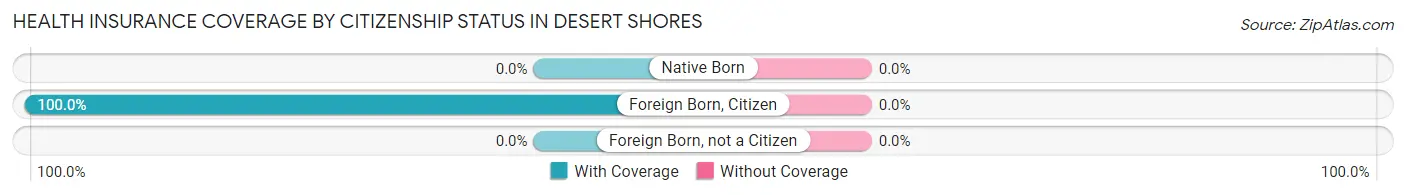
| Citizenship Status | With Coverage | Without Coverage |
| Native Born | 0 (0.0%) | 0 (0.0%) |
| Foreign Born, Citizen | 15 (100.0%) | 0 (0.0%) |
| Foreign Born, not a Citizen | 0 (0.0%) | 0 (0.0%) |
Health Insurance Coverage by Household Income in Desert Shores
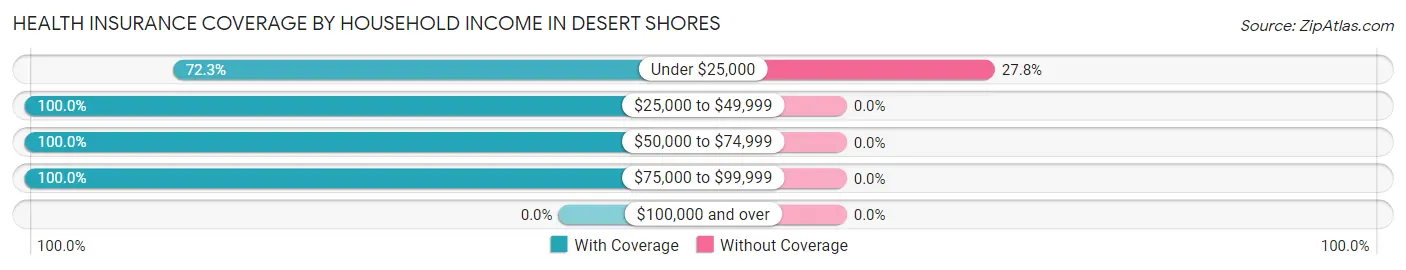
| Household Income | With Coverage | Without Coverage |
| Under $25,000 | 125 (72.3%) | 48 (27.8%) |
| $25,000 to $49,999 | 83 (100.0%) | 0 (0.0%) |
| $50,000 to $74,999 | 22 (100.0%) | 0 (0.0%) |
| $75,000 to $99,999 | 82 (100.0%) | 0 (0.0%) |
| $100,000 and over | 0 (0.0%) | 0 (0.0%) |
Public vs Private Health Insurance Coverage by Age in Desert Shores
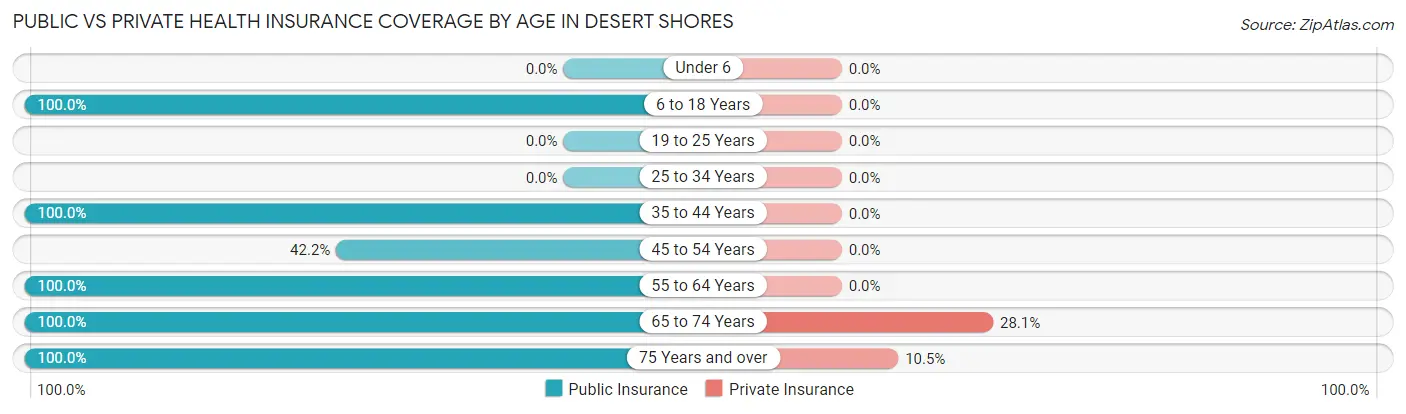
| Age Bracket | Public Insurance | Private Insurance |
| Under 6 | 0 (0.0%) | 0 (0.0%) |
| 6 to 18 Years | 15 (100.0%) | 0 (0.0%) |
| 19 to 25 Years | 0 (0.0%) | 0 (0.0%) |
| 25 to 34 Years | 0 (0.0%) | 0 (0.0%) |
| 35 to 44 Years | 88 (100.0%) | 0 (0.0%) |
| 45 to 54 Years | 35 (42.2%) | 0 (0.0%) |
| 55 to 64 Years | 31 (100.0%) | 0 (0.0%) |
| 65 to 74 Years | 57 (100.0%) | 16 (28.1%) |
| 75 Years and over | 86 (100.0%) | 9 (10.5%) |
| Total | 312 (86.7%) | 25 (6.9%) |
Disability Status by Sex by Age in Desert Shores
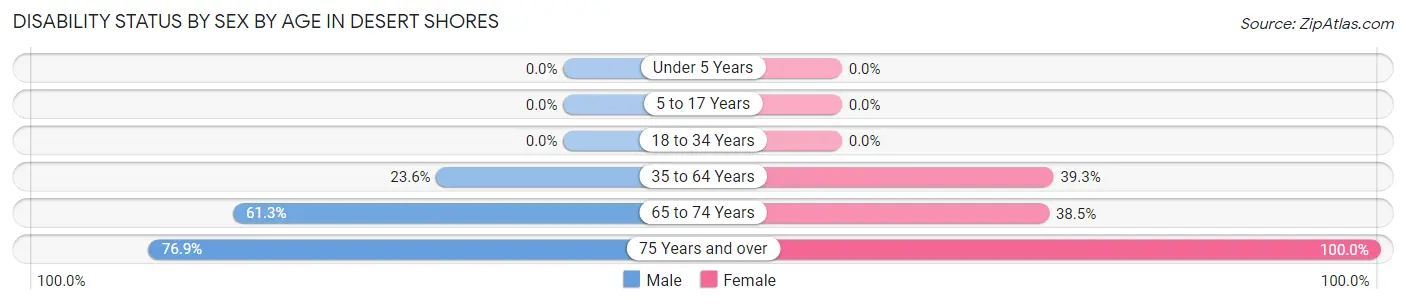
| Age Bracket | Male | Female |
| Under 5 Years | 0 (0.0%) | 0 (0.0%) |
| 5 to 17 Years | 0 (0.0%) | 0 (0.0%) |
| 18 to 34 Years | 0 (0.0%) | 0 (0.0%) |
| 35 to 64 Years | 41 (23.6%) | 11 (39.3%) |
| 65 to 74 Years | 19 (61.3%) | 10 (38.5%) |
| 75 Years and over | 30 (76.9%) | 47 (100.0%) |
Disability Class by Sex by Age in Desert Shores
Disability Class: Hearing Difficulty
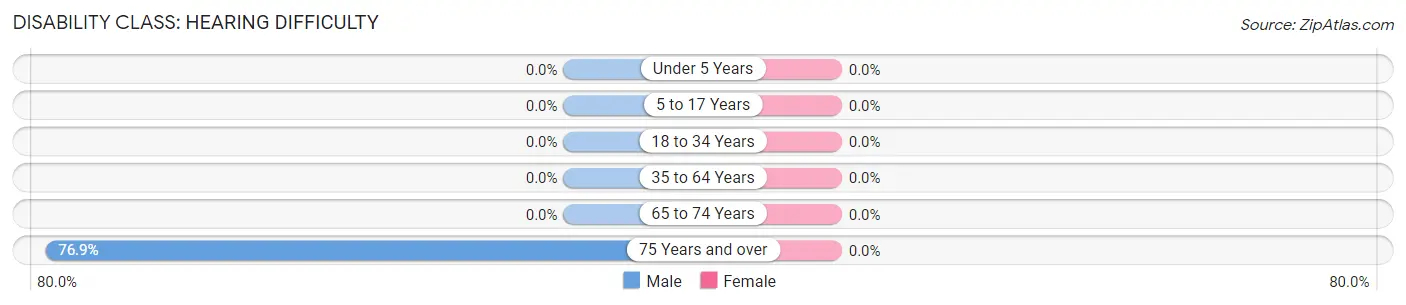
| Age Bracket | Male | Female |
| Under 5 Years | 0 (0.0%) | 0 (0.0%) |
| 5 to 17 Years | 0 (0.0%) | 0 (0.0%) |
| 18 to 34 Years | 0 (0.0%) | 0 (0.0%) |
| 35 to 64 Years | 0 (0.0%) | 0 (0.0%) |
| 65 to 74 Years | 0 (0.0%) | 0 (0.0%) |
| 75 Years and over | 30 (76.9%) | 0 (0.0%) |
Disability Class: Vision Difficulty
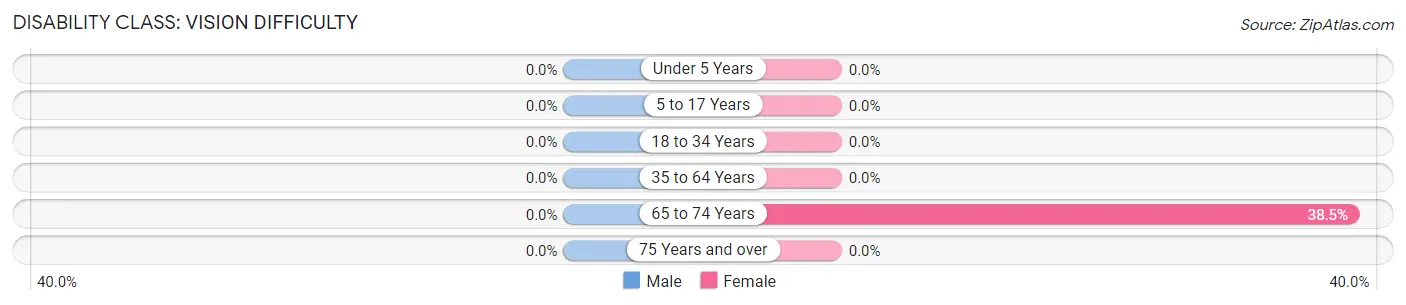
| Age Bracket | Male | Female |
| Under 5 Years | 0 (0.0%) | 0 (0.0%) |
| 5 to 17 Years | 0 (0.0%) | 0 (0.0%) |
| 18 to 34 Years | 0 (0.0%) | 0 (0.0%) |
| 35 to 64 Years | 0 (0.0%) | 0 (0.0%) |
| 65 to 74 Years | 0 (0.0%) | 10 (38.5%) |
| 75 Years and over | 0 (0.0%) | 0 (0.0%) |
Disability Class: Cognitive Difficulty
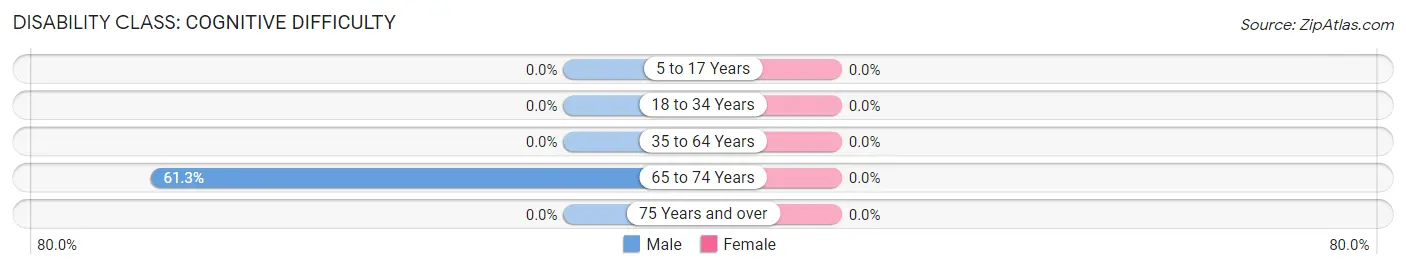
| Age Bracket | Male | Female |
| 5 to 17 Years | 0 (0.0%) | 0 (0.0%) |
| 18 to 34 Years | 0 (0.0%) | 0 (0.0%) |
| 35 to 64 Years | 0 (0.0%) | 0 (0.0%) |
| 65 to 74 Years | 19 (61.3%) | 0 (0.0%) |
| 75 Years and over | 0 (0.0%) | 0 (0.0%) |
Disability Class: Ambulatory Difficulty
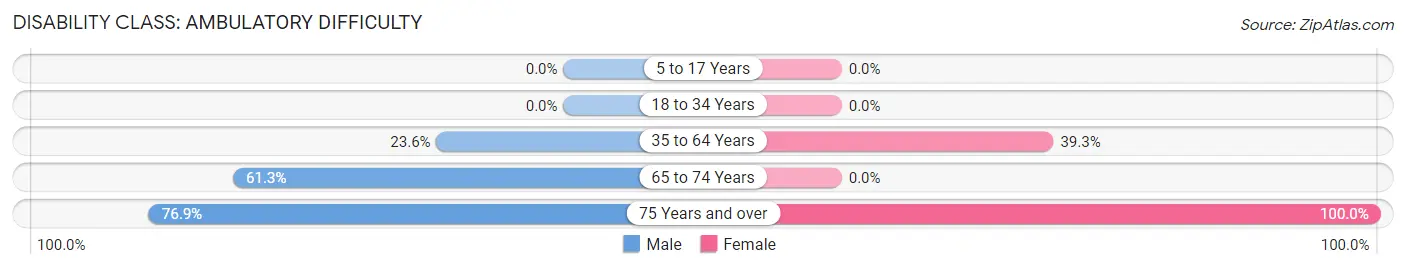
| Age Bracket | Male | Female |
| 5 to 17 Years | 0 (0.0%) | 0 (0.0%) |
| 18 to 34 Years | 0 (0.0%) | 0 (0.0%) |
| 35 to 64 Years | 41 (23.6%) | 11 (39.3%) |
| 65 to 74 Years | 19 (61.3%) | 0 (0.0%) |
| 75 Years and over | 30 (76.9%) | 47 (100.0%) |
Disability Class: Self-Care Difficulty
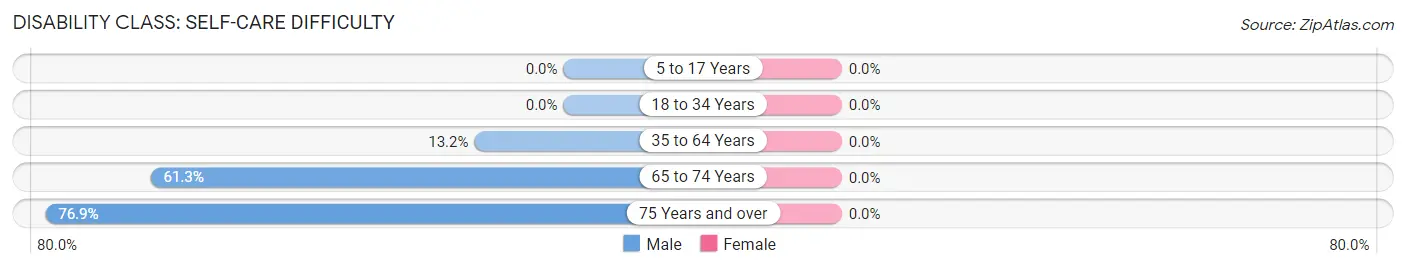
| Age Bracket | Male | Female |
| 5 to 17 Years | 0 (0.0%) | 0 (0.0%) |
| 18 to 34 Years | 0 (0.0%) | 0 (0.0%) |
| 35 to 64 Years | 23 (13.2%) | 0 (0.0%) |
| 65 to 74 Years | 19 (61.3%) | 0 (0.0%) |
| 75 Years and over | 30 (76.9%) | 0 (0.0%) |
Technology Access in Desert Shores
Computing Device Access in Desert Shores
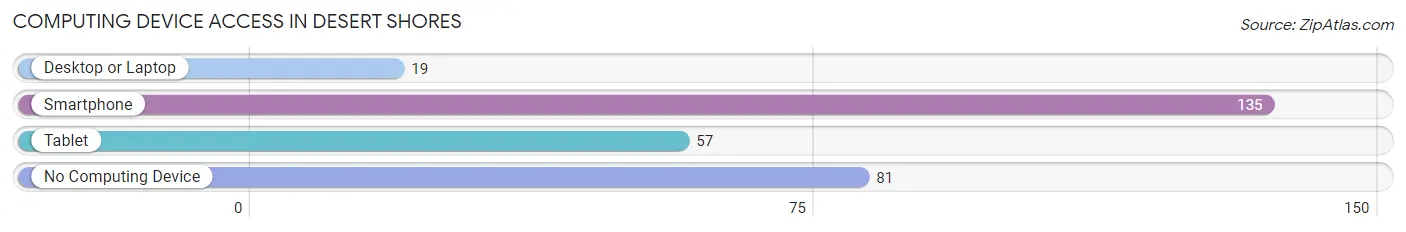
| Device Type | # Households | % Households |
| Desktop or Laptop | 19 | 8.8% |
| Smartphone | 135 | 62.5% |
| Tablet | 57 | 26.4% |
| No Computing Device | 81 | 37.5% |
| Total | 216 | 100.0% |
Internet Access in Desert Shores
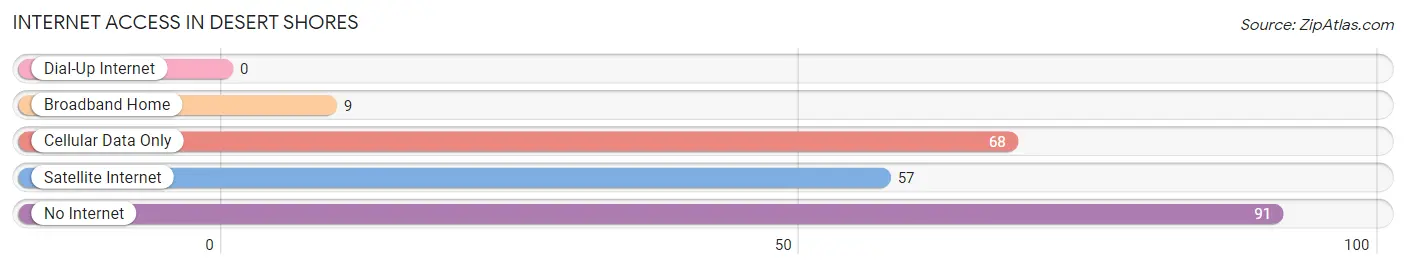
| Internet Type | # Households | % Households |
| Dial-Up Internet | 0 | 0.0% |
| Broadband Home | 9 | 4.2% |
| Cellular Data Only | 68 | 31.5% |
| Satellite Internet | 57 | 26.4% |
| No Internet | 91 | 42.1% |
| Total | 216 | 100.0% |
Desert Shores Summary
Desert Shores is a census-designated place (CDP) located in Riverside County, California, United States. The population was 2,845 at the 2010 census, up from 2,717 at the 2000 census. It is located in the Coachella Valley, about 25 miles (40 km) southeast of Palm Springs.
History
Desert Shores was founded in the late 1950s as a planned community. It was developed by the Desert Shores Corporation, which was owned by the late actor and real estate developer, William Holden. The community was designed to be a resort-style development, with a large lake at its center. The lake was stocked with fish and surrounded by homes, a golf course, and other amenities.
The community was originally planned to be a retirement community, but it quickly became popular with younger families as well. The community has grown steadily since its founding, and today it is home to a diverse population of all ages.
Geography
Desert Shores is located at 33 48 17 North 116 17 17 West 33 804722 116 288333
According to the United States Census Bureau, the CDP has a total area of 4.2 square miles (10.8 km2), all of it land.
Economy
Desert Shores is primarily a residential community, but it does have some commercial businesses. The most notable of these is the Desert Shores Resort, which is located on the lake. The resort offers a variety of amenities, including a golf course, tennis courts, and a spa.
The community also has a few small retail stores, restaurants, and other businesses. The local economy is largely supported by tourism, as the area is a popular destination for visitors from all over the world.
Demographics
As of the census of 2000, there were 2,717 people, 1,072 households, and 790 families residing in the CDP. The population density was 645.3 people per square mile (249.2/km2). There were 1,179 housing units at an average density of 281.2 per square mile (108.7/km2). The racial makeup of the CDP was 79.2% White, 0.7% African American, 0.7% Native American, 0.7% Asian, 0.1% Pacific Islander, 15.2% from other races, and 3.4% from two or more races. Hispanic or Latino of any race were 28.2% of the population.
There were 1,072 households, out of which 28.2% had children under the age of 18 living with them, 56.2% were married couples living together, 10.2% had a female householder with no husband present, and 28.7% were non-families. 22.2% of all households were made up of individuals, and 8.2% had someone living alone who was 65 years of age or older. The average household size was 2.54 and the average family size was 2.94.
In the CDP, the population was spread out, with 24.2% under the age of 18, 6.2% from 18 to 24, 25.2% from 25 to 44, 28.2% from 45 to 64, and 16.2% who were 65 years of age or older. The median age was 41 years. For every 100 females, there were 97.2 males. For every 100 females age 18 and over, there were 94.2 males.
The median income for a household in the CDP was $37,917, and the median income for a family was $41,250. Males had a median income of $31,250 versus $25,000 for females. The per capita income for the CDP was $19,945. About 8.2% of families and 11.2% of the population were below the poverty line, including 15.2% of those under age 18 and 6.2% of those age 65 or over.
Common Questions
What is Per Capita Income in Desert Shores?
Per Capita income in Desert Shores is $18,419.
What is the Median Family Income in Desert Shores?
Median Family Income in Desert Shores is $43,833.
What is the Median Household income in Desert Shores?
Median Household Income in Desert Shores is $22,939.
What is Inequality or Gini Index in Desert Shores?
Inequality or Gini Index in Desert Shores is 0.32.
What is the Total Population of Desert Shores?
Total Population of Desert Shores is 360.
What is the Total Male Population of Desert Shores?
Total Male Population of Desert Shores is 259.
What is the Total Female Population of Desert Shores?
Total Female Population of Desert Shores is 101.
What is the Ratio of Males per 100 Females in Desert Shores?
There are 256.44 Males per 100 Females in Desert Shores.
What is the Ratio of Females per 100 Males in Desert Shores?
There are 39.00 Females per 100 Males in Desert Shores.
What is the Median Population Age in Desert Shores?
Median Population Age in Desert Shores is 52.6 Years.
What is the Average Family Size in Desert Shores
Average Family Size in Desert Shores is 3.0 People.
What is the Average Household Size in Desert Shores
Average Household Size in Desert Shores is 1.7 People.
How Large is the Labor Force in Desert Shores?
There are 152 People in the Labor Forcein in Desert Shores.
What is the Percentage of People in the Labor Force in Desert Shores?
42.2% of People are in the Labor Force in Desert Shores.
What is the Unemployment Rate in Desert Shores?
Unemployment Rate in Desert Shores is 11.2%.